Johnston CA, Lipcius RN (2012) Exotic macroalga Gracilaria vermiculophylla provides superior nursery habitat for native blue crab in Chesapeake Bay. Marine ...
Supporting Information Appendix S1: Search terms used to find relevant studies We searched for relevant studies in Web of Science and Scopus online databases using three complex sets search terms. To identity studies involving invasive ecosystem engineering species ('exposure' set) we used search terms: (("alien species" OR "alien organism*" OR "invasive species" OR "invasive organism*" OR "species invasion" OR "introduced species" OR "introduced organism*" OR "species introduced" OR "species introduction" OR "allochthonous species" OR "nonindigenous species" OR "nonindigenous species" OR "nonindigenous organism*" OR "non-indigenous organism*" OR "non native species" OR "non-native species" OR "non-native organism*" OR "exotic species" OR bioinvaion OR "bioinvasive species" OR "bioinvasive organism*") AND (“ecosystem engineer*”OR "bioconstruct*" OR “habitat modif*" OR "autogenic" OR "allogenic")) This set was combined with a second set ('population') intended to isolate marine and estuarine studies and their associated biota: (("marine" OR "brackish" OR "estuar*" OR "coastal" OR "shallow" OR "sea" OR "seas" OR "maritime" OR "lagoon*" OR "pelagic" OR "benth*" OR "demersal" OR "shore*" OR "intertidal" OR "subtidal" OR "ocean*" OR "bay" OR "cove") AND ("fauna*" OR "animal" OR "infauna*" OR "epifauna*" OR "fish" OR "macroinvertebrate" OR "invertebrate" OR "macrofauna*" OR "mesofauna*" OR "meiofauna*" OR "epibenthic" OR "seagrass" OR "eelgrass" OR "cymodocea" OR "zostera" OR "posidonia" OR "seaweed" OR "macroalgal" OR "macroalgae" OR "fish*" OR "bird*" OR "seabird" OR "shorebird")) This was combined with a third set ('outcome'), aimed to identify studies that had an effect on ecosystem structure and functioning: (("species richness" OR diversity OR "community structure" OR evenness OR biodiversity OR biodiversity OR "biological diversity" OR "Shannon-Weaver" OR "Shannon-Weiner" OR "Shannon index" OR "Simpson Index" OR "abundance-biomass curve*" OR "species abundance distribution*" OR "community similarity" OR "community dissimilarity") OR ("Energy flow*" OR "Energy flux*"OR "Flow* of energy" OR "Flux* of energy" OR biogeochemical OR "Nutrient cycl*" OR "cycling of nutrient*" OR "Nutrient dynamics" OR "nutrient flux*" OR "Nutrient flow*" OR "Flow* of nutrient*" OR "Flux* of nutrient*" OR "cycling of carbon" OR "carbon cycl*" OR "carbon stor*" OR "carbon flow*" OR "carbon flux*" OR "flow* of carbon" OR "flux* of carbon" OR "cycling of sul*ur" OR "Sul*ur cycl*" OR "Flow* of sul*ur" OR "flux* of sul*ur" OR "sul*ur flux*" OR"sul*ur flow*" OR "Hydrogen sul*ide" OR "cycling of nitrogen" OR "nitrogen cycl*" OR "Flow* of nitrogen" OR "flux* of nitrogen" OR "nitrogen flux*" OR "nitrogen flow*" OR denitrification OR "cycling of phosphorus"OR " phosphorus cycl*" OR "Flow* of phosphorus" OR "flux* of phosphorus" OR "phosphorus flux*" OR "phosphorus flow*"OR "cycling of oxygen" OR “oxygen cycl*" OR "Flow* of oxygen" OR "flux* of oxygen" OR "oxygen flux*" OR "oxygen flow*" OR anoxi* OR hypoxi* OR bioturbation OR grazing OR foraging OR herbivory OR predation OR scavengers OR scavenging OR respiration OR ecosystem metabolism OR "sediment stabilisation" OR "sediment mixing" ) OR (primary product*" OR "secondary product*" OR "carbon fixation" OR "community respiration" OR "ecosystem respiration" OR "community metabolism" OR "ecosystem metabolism" OR "abundance of benthic" OR "productivity of benthic" OR "benthic biomass" OR "biomass of benthic" OR "benthic metabolism" OR "benthic respiration" OR ((abundance* OR biomass* OR productivity OR mortalit* OR survival OR growth OR cover OR densit*))
Appendix S2: Formulas for calculating the Hedges’s g effect size Hedegs' g (Hedges, 1981) is defined as:
(1)
𝑔=
𝑥̅ 𝑖𝑒𝑒 – 𝑥̅ 𝑐
× (1 –
𝑆𝑤𝑖𝑡ℎ𝑖𝑛
3
)
4𝑑𝑓−1
where 𝑥̅𝑖𝑒𝑒 is the mean of the response variable in the IEE treatment, 𝑥̅c is the mean in the control, 𝑆𝑤𝑖𝑡ℎ𝑖𝑛 is the within-groups standard deviation pooled across groups, and df are the degrees of freedom used to estimate 𝑆𝑤𝑖𝑡ℎ𝑖𝑛 according to the formula: (2)
(𝑛𝑖𝑒𝑒 −1)𝑠𝑖𝑒𝑒 2 −(𝑛𝑐 −1)𝑠𝑐 2
𝑆𝑤𝑖𝑡ℎ𝑖𝑛 = √
𝑛𝑖𝑒𝑒 − 𝑛𝑐 +2
where niee and nc are sample sizes, Siee and Sc are standard deviations of the IEE treatment and control, respectively. The variance of g was calculated as: 2
(3)
𝑉𝑔 = (1 –
3
2
𝑛𝑖𝑒𝑒 + 𝑛𝑐
) × (𝑛
4𝑑𝑓−1
𝑖𝑒𝑒
× 𝑛𝑐
̅ ̅ 𝑥 –𝑥 ( 𝑖𝑒𝑒 𝑐 )
+
𝑆𝑤𝑖𝑡ℎ𝑖𝑛
)
2(𝑛𝑖𝑒𝑒 +𝑛𝑐 )
Appendix S3: Criteria for exclusion at the full-text level and list of publications included in the meta-analysis Criteria for exclusion Of the 354 references retained after screening at the abstract level, 215 were excluded after full-text assessment: if only non-engineering effects were measured (n=5); if insufficient information to determine an engineering effect was provided (n=68); if an irrelevant outcome was measured (n=72); if no appropriate intervention or control group was described (n=24); if non-marine or estuarine habitats were assessed (n=6); if only theoretical or non-quantitative data (n=31) were given; and if no adequate data for effect size calculation were actually provided (n=9). List of retained publications Angradi TR, Hagan SM, Able KW (2001) Vegetation type and the intertidal macroinvertebrate fauna of a brackish marsh: Phragmites vs. Spartina. Wetlands, 21, 75-92. Bedini R, Bedini M, Bonechi L, Piazzi L (2015) Effects of non-native turf-forming Rhodophyta on mobile macro-invertebrate assemblages in the north-western Mediterranean Sea. Marine Biology Research, 11, 430-437. Bedini R, Bonechi L, Piazzi L (2014) Mobile epifaunal assemblages associated with Cystoseira beds: comparison between areas invaded and not invaded by Lophocladia lallemandii. Scientia Marina, 78, 425-432. Bishop MJ, Byers JE (2015) Predation risk predicts use of a novel habitat. Oikos, 124, 1225-1231. Bonaglia S, Bartoli M, Gunnarsson JS et al. (2013) Effect of reoxygenation and Marenzelleria spp. bioturbation on Baltic Sea sediment metabolism. Marine Ecology Progress Series, 482, 4355.
Bonnici L, Evans J, Borg JA, Schembri P (2012) Biological aspects and ecological effects of a bed of the invasive non-indigenous mussel Brachidontes pharaonis (Fischer P., 1870) in Malta. Mediterranean Marine Science, 13, 153-161. Brusati ED, Grosholz ED (2006) Native and introduced ecosystem engineers produce contrasting effects on estuarine infaunal communities. Biological Invasions, 8, 683-695. Brusati ED, Grosholz ED (2007) Effect of native and invasive cordgrass on Macoma petalum density, growth, and isotopic signatures. Estuarine, Coastal and Shelf Science, 71, 517-522. Bruschetti M, Bazterrica C, Fanjul E, Luppi T, Iribarne O (2011) Effect of biodeposition of an invasive polychaete on organic matter content and productivity of the sediment in a coastal lagoon. Journal of Sea Research, 66, 20-28. Bruschetti M, Bazterrica C, Luppi T, Iribarne O (2009) An invasive intertidal reef-forming polychaete affect habitat use and feeding behavior of migratory and locals birds in a SW Atlantic coastal lagoon. Journal of Experimental Marine Biology and Ecology, 375, 76-83. Bruschetti M, Luppi T, Fanjul E, Rosenthal A, Iribarne O (2008) Grazing effect of the invasive reef-forming polychaete Ficopomatus enigmaticus (Fauvel) on phytoplankton biomass in a SW Atlantic coastal lagoon. Journal of Experimental Marine Biology and Ecology, 354, 212-219. Bulleri F, Badalamenti F, Iveša L et al. (2016) The effects of an invasive seaweed on native communities vary along a gradient of land-based human impacts. PeerJ, 4, e1795. Buschbaum C, Chapman AS, Saier B (2006) How an introduced seaweed can affect epibiota diversity in different coastal systems. Marine Biology, 148, 743-754. Büttger H, Asmus H, Asmus R, Buschbaum C, Dittmann S, Nehls G (2008) Community dynamics of intertidal soft-bottom mussel beds over two decades. Helgoland Marine Research, 62, 2336. Cacabelos E, Engelen AH, Mejia A, Arenas F (2012) Comparison of the assemblage functioning of estuary systems dominated by the seagrass Nanozostera noltii versus the invasive drift seaweed Gracilaria vermiculophylla. Journal of Sea Research, 72, 99-105. Cai L-Z, Hwang J-S, Dahms H-U, Fu S-J, Zhuo Y, Guo T (2014) Effect of the invasive bivalve Mytilopsis sallei on the macrofaunal fouling community and the environment of Yundang Lagoon, Xiamen, China. Hydrobiologia, 741, 101-111. Carnell PE, Keough MJ (2014) Spatially variable synergistic effects of disturbance and additional nutrients on kelp recruitment and recovery. Oecologia, 175, 409-416. Carroll JM, Peterson BJ (2013) Comparisons in demographic rates of bay scallops in eelgrass and the introduced alga, Codium fragile, in New York. Marine Biology, 160, 1451-1463. Chapman M, People J, Blockley D (2005) Intertidal assemblages associated with naturalcorallina turf and invasive mussel beds. Biodiversity & Conservation, 14, 1761-1776. Chen H, Li B, Hu J, Chen J, Wu J (2007) Effects of Spartina alterniflora invasion on benthic nematode communities in the Yangtze Estuary. Marine Ecology Progress Series, 336, 99110. Chen H, Zhang P, Li B, Wu J (2015) Invasive cordgrass facilitates epifaunal communities in a Chinese marsh. Biological Invasions, 17, 205-217. Cordell JR, Levy C, Toft JD (2013) Ecological implications of invasive tunicates associated with artificial structures in Puget Sound, Washington, USA. Biological Invasions, 15, 1303-1318. Cottet M, De Montaudouin X, Blanchet H, Lebleu P (2007) Spartina anglica eradication experiment and in situ monitoring assess structuring strength of habitat complexity on marine macrofauna at high tidal level. Estuarine, Coastal and Shelf Science, 71, 629-640. Crooks JA (1998) Habitat alteration and community-level effects of an exotic mussel, Musculista senhousia. Marine Ecology Progress Series, 162, 137-152. Crooks JA, Khim HS (1999) Architectural vs. biological effects of a habitat-altering, exotic mussel, Musculista senhousia. Journal of Experimental Marine Biology and Ecology, 240, 53-75.
Cutajar J, Shimeta J, Nugegoda D (2012) Impacts of the invasive grass Spartina anglica on benthic macrofaunal assemblages in a temperate Australian saltmarsh. Marine Ecology Progress Series, 464, 107-120. Davidson TM, Ruiz GM, Torchin ME (2016) Boring crustaceans shape the land–sea interface in brackish Caribbean mangroves. Ecosphere, 7. Davis RC, Short FT, Burdick DM (1998) Quantifying the effects of green crab damage to eelgrass transplants. Restoration Ecology, 6, 297-302. Delefosse M, Banta GT, Canal-Vergés P, Penha-Lopes G, Quintana CO, Valdemarsen T, Kristensen E (2012) Macrobenthic community response to the Marenzelleria viridis (Polychaeta) invasion of a Danish estuary. Marine Ecology Progress Series, 461, 83-94. Demopoulos AW, Smith CR (2010) Invasive mangroves alter macrofaunal community structure and facilitate opportunistic exotics. Marine Ecology Progress Series, 404, 51-67. Deudero S, Blanco A, Box A, Mateu-Vicens G, Cabanellas-Reboredo M, Sureda A (2010) Interaction between the invasive macroalga Lophocladia lallemandii and the bryozoan Reteporella grimaldii at seagrass meadows: density and physiological responses. Biological Invasions, 12, 41-52. Deudero S, Box A, Alós J, Arroyo N, Marbà N (2011) Functional changes due to invasive species: Food web shifts at shallow Posidonia oceanica seagrass beds colonized by the alien macroalga Caulerpa racemosa. Estuarine, Coastal and Shelf Science, 93, 106-116. Dijkstra JA, Harris LG (2009) Maintenance of diversity altered by a shift in dominant species: implications for species coexistence. Marine Ecology, Progress Series, 387, 71-80. Drouin A, Mckindsey CW, Johnson LE (2011) Higher abundance and diversity in faunal assemblages with the invasion of Codium fragile ssp. in eelgrass meadows. Mar Ecol Prog Ser, 424, 105-117. Eastwood MM, Donahue MJ, Fowler AE (2007) Reconstructing past biological invasions: niche shifts in response to invasive predators and competitors. Biological Invasions, 9, 397-407. Ferrer E, Garreta G, Ribera MA (1997) Effect of Caulerpa taxifolia on the productivity of two Mediterranean macrophytes. Marine Ecology Progress Series, 149, 279-287. Feyrer F, Herbold B, Matern SA, Moyle PB (2003) Dietary shifts in a stressed fish assemblage: consequences of a bivalve invasion in the San Francisco Estuary. Environmental Biology of Fishes, 67, 277-288. Firstater FN, Narvarte M, Alvarez MF, Fanjul ME, Iribarne OO (2016) Cordgrass canopy elicits weak effects on sediment properties and microphytobenthic abundance in a harsh environment. Marine Ecology Progress Series, 550, 101-110. Fletcher LM, Forrest BM, Bell JJ (2013) Impacts of the invasive ascidian Didemnum vexillum on green-lipped mussel Perna canaliculus aquaculture in New Zealand. Aquaculture Environment Interactions, 4, 17-30. Floerl O, Pool TK, Inglis GJ (2004) Positive interactions between nonindigenous species facilitate transport by human vectors. Ecological Applications, 14, 1724-1736. Francour P, Harmelin-Vivien M, Harmelin J, Duclerc J (1995) Impact of Caulerpa taxifolia colonization on the littoral ichthyofauna of North-Western Mediterranean sea: preliminary results. Hydrobiologia, 300, 345-353. Fukunaga A, Peyton KA, Thomas FI (2014) Epifaunal community structure and ammonium uptake compared for the invasive algae, Gracilaria salicornia and Acanthophora specifera, and the native alga, Padina thivyi. Journal of Experimental Marine Biology and Ecology, 456, 7886. Gan X, Cai Y, Choi C, Ma Z, Chen J, Li B (2009) Potential impacts of invasive Spartina alterniflora on spring bird communities at Chongming Dongtan, a Chinese wetland of international importance. Estuarine, Coastal and Shelf Science, 83, 211-218. Ge B-M, Zhang D-Z, Bao Y-X, Cui J, Tang B-P, Hu Z-Y (2015) Effect of saltmarsh cordgrass, Spartina alterniflora, invasion stage on Cerithidea cingulata (Caenogastropoda:
Potamididae) distribution: A case study from a tidal flat of western Pacific Ocean, China. Pakistan Journal of Zoology, 47, 141-146. Gestoso I, Arenas F, Rubal M, Veiga P, Peña M, Olabarria C (2013) Shifts from native to nonindigenous mussels: enhanced habitat complexity and its effects on faunal assemblages. Marine Environmental Research, 90, 85-95. Gestoso I, Olabarria C, Troncoso JS (2011) Effects of macroalgal identity on epifaunal assemblages: native species versus the invasive species Sargassum muticum. Helgoland Marine Research, 66, 159. Green DS, Boots B, Crowe TP (2012) Effects of non-indigenous oysters on microbial diversity and ecosystem functioning. PLoS One, 7, e48410. Green DS, Crowe TP (2013) Physical and biological effects of introduced oysters on biodiversity in an intertidal boulder field. Marine Ecology Progress Series, 482, 119-132. Green DS, Crowe TP (2014) Context-and density-dependent effects of introduced oysters on biodiversity. Biological Invasions, 16, 1145-1163. Green DS, Rocha C, Crowe TP (2013) Effects of non-indigenous oysters on ecosystem processes vary with abundance and context. Ecosystems, 16, 881-893. Hacker S, Dethier M (2006) Community modification by a grass invader has differing impacts for marine habitats. Oikos, 113, 279-286. Hahn DR (2003) Alteration of microbial community composition and changes in decomposition associated with an invasive intertidal macrophyte. In: Marine Bioinvasions: Patterns, Processes and Perspectives. Springer. Hammond W, Griffiths C (2006) Biogeographical patterns in the fauna associated with southern African mussel beds. African Zoology, 41, 123-130. Heiman KW, Micheli F (2010) Non-native ecosystem engineer alters estuarine communities. Integrative and comparative biology, 50, 226-236. Heiman KW, Vidargas N, Micheli F (2008) Non-native habitat as home for non-native species: comparison of communities associated with invasive tubeworm and native oyster reefs. Aquatic Biology, 2, 47-56. Höffle H, Thomsen MS, Holmer M (2011) High mortality of Zostera marina under high temperature regimes but minor effects of the invasive macroalgae Gracilaria vermiculophylla. Estuarine, Coastal and Shelf Science, 92, 35-46. Höffle H, Wernberg T, Thomsen M, Holmer M (2012) Drift algae, an invasive snail and elevated temperature reduce ecological performance of a warm-temperate seagrass, through additive effects. Holloway MG, Keough MJ (2002a) Effects of an introduced polychaete, Sabella spallanzanii, on the development of epifaunal assemblages. Marine Ecology Progress Series, 236, 137-154. Holloway MG, Keough MJ (2002b) An introduced polychaete affects recruitment and larval abundance of sessile invertebrates. Ecological Applications, 12, 1803-1823. Holmer M, Marbà N, Lamote M, Duarte CM (2009) Deterioration of sediment quality in seagrass meadows (Posidonia oceanica) invaded by macroalgae (Caulerpa sp.). Estuaries and coasts, 32, 456-466. Holsman KK, Mcdonald PS, Barreyro PA, Armstrong DA (2010) Restoration through eradication? Removal of an invasive bioengineer restores some habitat function for a native predator. Ecological Applications, 20, 2249-2262. Ilarri MI, Freitas F, Costa-Dias S, Antunes C, Guilhermino L, Sousa R (2012) Associated macrozoobenthos with the invasive Asian clam Corbicula fluminea. Journal of Sea Research, 72, 113-120. Irigoyen AJ, Trobbiani G, Sgarlatta MP, Raffo MP (2011) Effects of the alien algae Undaria pinnatifida (Phaeophyceae, Laminariales) on the diversity and abundance of benthic macrofauna in Golfo Nuevo (Patagonia, Argentina): potential implications for local food webs. Biological Invasions, 13, 1521-1532.
Janiak DS, Whitlatch RB (2012) Epifaunal and algal assemblages associated with the native Chondrus crispus (Stackhouse) and the non-native Grateloupia turuturu (Yamada) in eastern Long Island Sound. Journal of Experimental Marine Biology and Ecology, 413, 3844. Johnston CA, Lipcius RN (2012) Exotic macroalga Gracilaria vermiculophylla provides superior nursery habitat for native blue crab in Chesapeake Bay. Marine Ecology Progress Series, 467, 137-146. Jones E, Thornber CS (2009) Effects of habitat-modifying invasive macroalgae on epiphytic algal communities. Marine Ecology Progress Series, 400, 87. Kamalakannan B, Jeevamani JJJ, Nagendran NA, Pandiaraja D, Chandrasekaran S (2014) Impact of removal of invasive species Kappaphycus alvarezii from coral reef ecosystem in Gulf of Mannar, India. Curr. Sci, 106, 1401-1408. Knight NS, Prentice C, Tseng M, O'connor MI (2015) A comparison of epifaunal invertebrate communities in native eelgrass Zostera marina and non-native Zostera japonica at Tsawwassen, BC. Marine Biology Research, 11, 564-571. Kochmann J, Buschbaum C, Volkenborn N, Reise K (2008) Shift from native mussels to alien oysters: differential effects of ecosystem engineers. Journal of Experimental Marine Biology and Ecology, 364, 1-10. Kotta J, Orav H, Sandberg-Kilpi E (2001) Ecological consequence of the introduction of the polychaete Marenzelleria cf. viridis into a shallow-water biotope of the northern Baltic Sea. Journal of Sea Research, 46, 273-280. Kristensen E, Hansen T, Delefosse M, Banta GT, Quintana CO (2011) Contrasting effects of the polychaetes Marenzelleria viridis and Nereis diversicolor on benthic metabolism and solute transport in sandy coastal sediment. Marine Ecology Progress Series, 425, 125-139. Lang AC, Buschbaum C (2010) Facilitative effects of introduced Pacific oysters on native macroalgae are limited by a secondary invader, the seaweed Sargassum muticum. Journal of Sea Research, 63, 119-128. Larned ST (2003) Effects of the invasive, nonindigenous seagrass Zostera japonica on nutrient fluxes between the water column and benthos in a NE Pacific estuary. Marine Ecology Progress Series, 254, 69-80. Lejart M, Hily C (2011) Differential response of benthic macrofauna to the formation of novel oyster reefs ( Crassostrea gigas, Thunberg) on soft and rocky substrate in the intertidal of the Bay of Brest, France. Journal of Sea Research, 65, 84-93. Levin LA, Neira C, Grosholz ED (2006) Invasive cordgrass modifies wetland trophic function. Ecology, 87, 419-432. Levin PS, Coyer JA, Petrik R, Good TP (2002) Community-wide effects of nonindigenous species on temperate rocky reefs. Ecology, 83, 3182-3193. López MS, Lavrado HP, Coutinho R (2014) Structure of intertidal sessile communities before and after the invasion of Isognomon bicolor (CB Adams, 1845)(Bivalvia, Isognomonidae) in southeastern Brazil. Aquatic Invasions, 9, 457-465. Lorenti M, Gambi MC, Guglielmo R, Patti FP, Scipione MB, Zupo V, Buia MC (2011) Soft‐bottom macrofaunal assemblages in the Gulf of Salerno, Tyrrhenian Sea, Italy, an area affected by the invasion of the seaweed Caulerpa racemosa var. cylindracea. Marine Ecology, 32, 320334. Lutz ML, Davis AR, Minchinton TE (2010) Non-indigenous macroalga hosts different epiphytic assemblages to conspecific natives in southeast Australia. Marine Biology, 157, 1095-1103. Malyshev A, Quijón PA (2011) Disruption of essential habitat by a coastal invader: new evidence of the effects of green crabs on eelgrass beds. ICES Journal of Marine Science: Journal du Conseil, 68, 1852-1856. Markert A, Esser W, Frank D, Wehrmann A, Exo K-M (2013) Habitat change by the formation of alien Crassostrea-reefs in the Wadden Sea and its role as feeding sites for waterbirds. Estuarine, Coastal and Shelf Science, 131, 41-51.
Markert A, Wehrmann A, Kröncke I (2010) Recently established Crassostrea-reefs versus native Mytilus-beds: differences in ecosystem engineering affects the macrofaunal communities (Wadden Sea of Lower Saxony, southern German Bight). Biological Invasions, 12, 15-32. Matheson K, Mckenzie C, Gregory R, Robichaud D, Bradbury I, Snelgrove P, Rose G (2016) Linking eelgrass decline and impacts on associated fish communities to European green crab Carcinus maenas invasion. Marine Ecology Progress Series, 548, 31-45. Maximov A, Eremina T, Lange E, Litvinchuk L, Maximova O (2014) Regime shift in the ecosystem of the eastern Gulf of Finland caused by the invasion of the polychaete Marenzelleria arctia. Oceanology, 54, 46-53. Mcquaid K, Griffiths C (2014) Alien reef-building polychaete drives long-term changes in invertebrate biomass and diversity in a small, urban estuary. Estuarine, Coastal and Shelf Science, 138, 101-106. Mineur F, Johnson MP, Maggs CA (2008) Non-indigenous marine macroalgae in native communities: a case study in the British Isles. Journal of the Marine Biological Association of the UK, 88, 693-698. Montefalcone M, Morri C, Peirano A, Albertelli G, Bianchi C (2007) Substitution and phase shift within the Posidonia oceanica seagrass meadows of NW Mediterranean Sea. Estuarine, Coastal and Shelf Science, 75, 63-71. Nasrollahzadeh H, Din Z, Foong S, Makhlough A (2008a) Spatial and temporal distribution of macronutrients and phytoplankton before and after the invasion of the ctenophore, Mnemiopsis leidyi, in the Southern Caspian Sea. Chemistry and Ecology, 24, 233-246. Nasrollahzadeh HS, Din ZB, Foong SY, Makhlough A (2008b) Trophic status of the Iranian Caspian Sea based on water quality parameters and phytoplankton diversity. Continental Shelf Research, 28, 1153-1165. Neideman R, Wenngren J, Ólafsson E (2003) Competition between the introduced polychaete Marenzelleria sp. and the native amphipod Monoporeia affinis in Baltic soft bottoms. Marine Ecology Progress Series, 264, 49-55. Neira C, Levin LA, Grosholz ED, Mendoza G (2007) Influence of invasive Spartina growth stages on associated macrofaunal communities. Biological Invasions, 9, 975-993. O'brien AL, Ross DJ, Keough MJ (2006) Effects of Sabella spallanzanii physical structure on soft sediment macrofaunal assemblages. Marine and freshwater research, 57, 363-371. Olabarria C, Incera M, Garrido J, Rossi F (2010) The effect of wrack composition and diversity on macrofaunal assemblages in intertidal marine sediments. Journal of Experimental Marine Biology and Ecology, 396, 18-26. Olabarria C, Rodil IF, Incera M, Troncoso JS (2009) Limited impact of Sargassum muticum on native algal assemblages from rocky intertidal shores. Marine Environmental Research, 67, 153-158. Palomo MG, Bagur M, Quiroga M, Soria S, Bugnot A (2016) Ecological impacts of two nonindigenous macroalgae on an urban rocky intertidal shore. Marine Biology, 163, 178. Piazzi L, Ceccherelli G, Cinelli F (2001) Threat to macroalgal diversity: effects of the introduced green alga Caulerpa racemosa in the Mediterranean. Marine Ecology Progress Series, 210, 149-159. Renz JR, Forster S (2013) Are similar worms different? A comparative tracer study on bioturbation in the three sibling species Marenzelleria arctia, M. viridis, and M. neglecta from the Baltic Sea. Limnology and Oceanography, 58, 2046-2058. Reusch TB, Williams SL (1998) Variable responses of native eelgrass Zostera marina to a nonindigenous bivalve Musculista senhousia. Oecologia, 113, 428-441. Ross DJ, Longmore AR, Keough MJ (2013) Spatially variable effects of a marine pest on ecosystem function. Oecologia, 172, 525-538. Salvaterra T, Green DS, Crowe TP, O’gorman EJ (2013) Impacts of the invasive alga Sargassum muticum on ecosystem functioning and food web structure. Biological Invasions, 15, 25632576.
Schwindt E, Bortolus A, Iribarne OO (2001) Invasion of a reef-builder polychaete: direct and indirect impacts on the native benthic community structure. Biological Invasions, 3, 137149. Sellheim K, Stachowicz JJ, Coates RC (2010) Effects of a nonnative habitat-forming species on mobile and sessile epifaunal communities. Marine Ecology Progress Series, 398, 69-80. Shimeta J, Saint L, Verspaandonk ER, Nugegoda D, Howe S (2016) Long-term ecological consequences of herbicide treatment to control the invasive grass, Spartina anglica, in an Australian saltmarsh. Estuarine, Coastal and Shelf Science, 176, 58-66. Siple MC, Donahue MJ (2013) Invasive mangrove removal and recovery: Food web effects across a chronosequence. Journal of Experimental Marine Biology and Ecology, 448, 128-135. Smith BE, Collie JS, Lengyel NL (2014a) Fish trophic engineering: Ecological effects of the invasive ascidian Didemnum vexillum (Georges Bank, northwestern Atlantic). Journal of Experimental Marine Biology and Ecology, 461, 489-498. Smith JR, Vogt SC, Creedon F, Lucas BJ, Eernisse DJ (2014b) The non-native turf-forming alga Caulacanthus ustulatus displaces space-occupants but increases diversity. Biological Invasions, 16, 2195-2208. South PM, Thomsen MS (2016) The ecological role of invading Undaria pinnatifida: an experimental test of the driver–passenger models. Marine Biology, 163, 175. Strain EM, Johnson CR (2013) The effects of an invasive habitat modifier on the biotic interactions between two native herbivorous species and benthic habitat in a subtidal rocky reef ecosystem. Biological Invasions, 15, 1391-1405. Strong JA, Dring MJ, Maggs CA (2006) Colonisation and modification of soft substratum habitats by the invasive macroalga Sargassum muticum. Marine Ecology Progress Series, 321, 8797. Sueiro MC, Bortolus A, Schwindt E (2012) The role of the physical structure of Spartina densiflora Brong. in structuring macroinvertebrate assemblages. Aquatic Ecology, 46, 25-36. Sureda A, Box A, Terrados J, Deudero S, Pons A (2008) Antioxidant response of the seagrass Posidonia oceanica when epiphytized by the invasive macroalgae Lophocladia lallemandii. Marine Environmental Research, 66, 359-363. Sweetman A, Middelburg J, Berle A, Bernardino A, Schander C, Demopoulos A, Smith C (2010) Impacts of exotic mangrove forests and mangrove deforestation on carbon remineralization and ecosystem functioning in marine sediments. Biogeosciences, 7, 2129-2145. Tamburello L, Maggi E, Benedetti‐Cecchi L et al. (2015) Variation in the impact of non‐native seaweeds along gradients of habitat degradation: a meta‐analysis and an experimental test. Oikos, 124, 1121-1131. Thomsen MS (2010) Experimental evidence for positive effects of invasive seaweed on native invertebrates via habitat-formation in a seagrass bed. Aquatic Invasions, 5, 341-346. Thomsen MS, Stæhr PA, Nejrup L, Schiel DR (2013) Effects of the invasive macroalgae Gracilaria vermiculophylla on two co-occurring foundation species and associated invertebrates. Aquatic Invasions, 8, 133-145. Tlig-Zouari S, Rabaoui L, Cosentino A, Irathni I, Ghrairi H, Hassine OKB (2011) Macrofauna associated with an introduced oyster Pinctada radiata: Spatial scale implications of community differences. Journal of Sea Research, 65, 161-169. Tsai C, Yang S, Trimble AC, Ruesink JL (2010) Interactions between two introduced species: Zostera japonica (dwarf eelgrass) facilitates itself and reduces condition of Ruditapes philippinarum (Manila clam) on intertidal flats. Marine Biology, 157, 1929-1936. Urban-Malinga B, Warzocha J, Zalewski M (2013) Effects of the invasive polychaete Marenzelleria spp. on benthic processes and meiobenthos of a species-poor brackish system. Journal of Sea Research, 80, 25-34. Vázquez-Luis M, Borg JA, Sanchez-Jerez P, Bayle-Sempere JT (2012) Habitat colonisation by amphipods: Comparison between native and alien algae. Journal of Experimental Marine Biology and Ecology, 432, 162-170.
Vázquez-Luis M, Guerra-García J, Sanchez-Jerez P, Bayle-Sempere J (2009a) Caprellid assemblages (Crustacea: Amphipoda) in shallow waters invaded by Caulerpa racemosa var. cylindracea from southeastern Spain. Helgoland Marine Research, 63, 107-117. Vázquez-Luis M, Sanchez-Jerez P, Bayle-Sempere J (2008) Changes in amphipod (Crustacea) assemblages associated with shallow-water algal habitats invaded by Caulerpa racemosa var. cylindracea in the western Mediterranean Sea. Marine Environmental Research, 65, 416-426. Vázquez-Luis M, Sanchez-Jerez P, Bayle-Sempere JT (2009b) Comparison between amphipod assemblages associated with Caulerpa racemosa var. cylindracea and those of other Mediterranean habitats on soft substrate. Estuarine, Coastal and Shelf Science, 84, 161-170. Vázquez-Luis M, Sanchez-Jerez P, Bayle-Sempere JT (2010) Effects of Caulerpa racemosa var. cylindracea on prey availability: an experimental approach to predation of amphipods by Thalassoma pavo (Labridae). Hydrobiologia, 654, 147-154. Wagner E, Dumbauld BR, Hacker SD, Trimble AC, Wisehart LM, Ruesink JL (2012) Densitydependent effects of an introduced oyster, Crassostrea gigas, on a native intertidal seagrass, Zostera marina. Marine Ecology Progress Series, 468, 149-160. Wigginton RD, Pearson J, Whitcraft CR (2014) Invasive plant ecosystem engineer facilitates community and trophic level alteration for brackish marsh invertebrates. Ecosphere, 5, 1-17. Wikström SA, Kautsky L (2004) Invasion of a habitat-forming seaweed: effects on associated biota. Biological Invasions, 6, 141-150. Wilkie EM, Bishop MJ, O'connor WA (2013) The density and spatial arrangement of the invasive oyster Crassostrea gigas determines its impact on settlement of native oyster larvae. Ecology and evolution, 3, 4851-4860. Willette DA, Ambrose RF (2012) Effects of the invasive seagrass Halophila stipulacea on the native seagrass, Syringodium filiforme, and associated fish and epibiota communities in the Eastern Caribbean. Aquatic botany, 103, 74-82. Windham L, Ehrenfeld JG (2003) Net impact of a plant invasion on nitrogen‐cycling processes within a brackish tidal marsh. Ecological Applications, 13, 883-896. Wonham MJ, O'connor M, Harley CD (2005) Positive effects of a dominant invader on introduced and native mudflat species. Marine Ecology Progress Series, 289, 109-116. Wright JT, Byers JE, Devore JL, Sotka EE (2014) Engineering or food? mechanisms of facilitation by a habitat‐forming invasive seaweed. Ecology, 95, 2699-2706. Wright JT, Byers JE, Koukoumaftsis LP, Ralph PJ, Gribben PE (2010) Native species behaviour mitigates the impact of habitat-forming invasive seaweed. Oecologia, 163, 527-534. Wright JT, Gribben PE (2008) Predicting the impact of an invasive seaweed on the fitness of native fauna. Journal of Applied Ecology, 45, 1540-1549. Wright JT, Gribben PE, Byers JE, Monro K (2012) Invasive ecosystem engineer selects for different phenotypes of an associated native species. Ecology, 93, 1262-1268. Wright JT, Mckenzie LA, Gribben PE (2007) A decline in the abundance and condition of a native bivalve associated with Caulerpa taxifolia invasion. Marine and freshwater research, 58, 263-272. Zaiko A, Daunys D, Olenin S (2009) Habitat engineering by the invasive zebra mussel Dreissena polymorpha (Pallas) in a boreal coastal lagoon: impact on biodiversity. Helgoland Marine Research, 63, 85-94. Zhou H-X, Liu J-E, Qin P (2009) Impacts of an alien species (Spartina alterniflora) on the macrobenthos community of Jiangsu coastal inter-tidal ecosystem. Ecological Engineering, 35, 521-528. Zwerschke N, Emmerson MC, Roberts D, O'connor NE (2016) Benthic assemblages associated with native and non-native oysters are similar. Marine Pollution Bulletin, 111, 305-310.
Appendix S4: The number of effects in each category of the 140 papers used in the meta-analysis (The references are ordered alphabetically)
Outcome categories
10 11 12 13 14 15 16 17 18 19
Growth and metabolic functions
9
Nutrient cycling
8
Decomposition
7
Sedimentation rate
6
primary production
5
Species diversity (Shannon Index)
4
Community evenness (Pileou Index)
3
Species richness
2
Single species abundance
Community abundance
1
1
1
1
0
0
0
0
0
0
0
3
1
0
1
0
0
0
0
0
0
0
2
Bedini et al. 2015 2 Bishop & Byers 0 2015 Bonaglia et al. 0 2013 Bonnici et al. 1 2012 Brusati & 2 Grosholz 2006 Brusati & 0 Grosholz 2007 Bruschetti et al. 0 2008 Bruschetti et al. 0 2009 Bruschetti et al. 0 2011 Bulleri et al. 2016 1 Buschbaum et al. 0 2006 Büttger et al. 1 2008 Cacabelos et al. 0 2012 Cai et al. 2014 0 Carnell & 0 Keough 2014 Carroll & 0 Peterson 2013 Chapman et al. 0 2005
0
2
0
0
0
0
0
0
0
4
1
0
0
0
0
0
0
0
0
1
0
0
0
0
0
0
0
4
0
4
0
1
0
0
0
0
0
0
0
2
0
0
0
0
0
0
0
0
0
2
0
0
0
0
0
0
0
0
1
1
0
0
0
0
1
0
0
0
0
1
1
0
0
0
0
0
0
0
0
1
0
0
0
0
1
0
1
0
0
2
0
0
0
0
0
0
0
0
0
1
0
2
0
0
0
0
0
0
0
2
1
0
0
0
0
0
0
0
0
2
0
0
0
0
1
0
0
0
0
1
1
0
0
0
0
0
0
0
0
1
1
0
0
0
0
0
0
0
0
1
References Angradi et al. 2001 Bedini et al. 2014
Sum
2
0
0
0
0
0
0
0
2
4
1
0
0
0
0
0
0
0
0
1
20
Chen et al. 2007
0
1
1
0
1
0
0
0
0
0
3
21
Chen et al. 2014 Cordell et al. 2013 Cottet et al. 2007 Crooks & Khim 1999 Crooks 1998 Cutajar et al. 2012 Davidson et al. 2016 Davis et al. 1998 Delefosse et al. 2012 Demopoulos & Smith 2010 Deudero et al. 2010 Deudero et al. 2011 Dijkstra & Harris 2009 Drouin et al. 2011 Eastwood et al. 2007 Ferrer et al. 1997
1
1
0
0
1
0
0
0
0
0
3
0
4
0
0
0
0
0
0
0
2
6
1
1
1
0
0
0
0
1
0
0
4
1
1
1
0
0
0
0
1
0
0
4
1
1
1
0
0
0
0
0
0
0
3
2
2
2
0
2
0
2
2
0
0
12
0
0
0
0
0
0
0
0
0
1
1
0
1
0
0
0
0
0
0
0
0
1
0
1
1
0
0
0
0
0
0
0
2
1
0
1
1
1
0
0
0
2
0
6
0
1
0
0
0
0
0
0
1
1
3
0
0
0
0
0
1
0
0
0
0
1
1
0
2
0
0
0
0
0
0
0
3
0
0
2
1
1
0
0
0
0
0
4
0
0
0
0
0
0
0
0
0
1
1
0
2
0
0
0
0
0
0
0
0
2
Feyrer et al. 2003 Firstater et al. 2016 Fletcher et al. 2013 Floerl et al. 2004 Francour et al. 1995 Fukunaga et al. 2014 Gan et al. 2009
0
1
0
0
0
0
0
0
0
1
2
0
0
0
0
0
0
1
0
0
0
1
0
0
0
0
0
0
0
0
0
1
1
1
0
0
0
0
0
0
0
0
0
2
1
0
1
0
0
0
0
0
0
0
2
1
0
0
0
0
0
0
0
0
0
1
1
0
0
0
0
0
0
0
0
0
1
Ge et al. 2015 Gestoso et al. 2011 Gestoso et al. 2013 Green & Crowe 2012
0
1
0
0
0
0
0
0
0
0
1
1
0
0
0
1
0
0
0
0
0
2
1
0
0
1
1
0
0
0
0
0
3
1
0
1
0
0
0
0
0
0
0
2
22 23 24 25 26 27 28 29 30 31 32 33 34 35 36 37 38 39 40 41 42 43 44 45 46 47
48 49 50 51 52 53 54 55 56 57 58 59 60 61 62 63 64 65 66 67 68 69 70 71 72 73 74 75
Green & Crowe 2014 Green et al. 2012
2
2
2
0
2
0
0
0
0
0
8
0
0
0
0
0
1
0
1
2
0
4
Green et al. 2013 Hacker & Dethier 2006 Hahn 2003 Hammond & Griffiths 2006 Heiman & Micheli 2010 Heiman et al. 2008 Hoffle et al. 2011
0
0
0
0
0
0
0
0
4
0
4
0
3
0
0
0
0
3
0
0
0
6
0
0
0
0
0
0
0
1
0
0
1
1
0
1
0
1
0
0
0
0
0
3
1
0
0
0
0
0
0
0
0
0
1
1
1
0
0
0
0
0
0
0
0
2
0
1
0
0
0
0
0
0
1
1
3
Hoffle et al. 2012 Holloway& Keough 2002a Holloway& Keough 2002b Holmer et al. 2009 Holsman et al. 2010 Ilarri et al. 2012 Irigoyen et al. 2011 Janiak & Whitlatch 2012 Johnston & Lipcius 2012 Jones & Thornber 2010 Kamalakannan et al. 2014 Knight et al. 2015 Kochmann et al. 2008 Kotta et al. 2001 Kristensen et al. 2011 Lang & Buschbaum 2010 Larned 2003 Lejart & Hily 2011 Levin et al. 2002
0
1
0
0
0
0
0
0
0
0
1
1
1
0
0
0
0
0
0
0
0
2
0
0
0
0
0
0
0
0
0
1
1
0
0
0
0
0
0
3
3
9
0
15
0
1
0
0
0
0
0
0
0
0
1
1
0
1
1
1
0
0
0
0
0
4
0
1
0
0
1
0
0
0
0
0
2
1
1
1
0
0
0
0
0
0
0
3
0
2
0
0
0
0
0
0
0
0
2
1
0
1
0
0
0
0
0
0
0
2
1
0
0
0
0
0
0
0
0
0
1
1
0
0
0
1
0
0
0
0
0
2
0
1
0
0
0
0
1
0
0
0
2
0
1
0
0
0
1
0
0
0
1
3
0
0
0
0
0
0
0
1
0
0
1
1
1
1
0
0
0
0
0
0
0
3
0
0
0
0
0
1
1
0
6
0
8
2
0
2
0
0
0
1
0
0
0
5
0
1
0
0
0
0
0
0
0
1
2
76
Levin et al. 2006
1
0
0
0
0
0
0
0
0
0
1
77
Lopez et al. 2014 Lorenti et al. 2011 Lutz et al 2010 Malyshev & Quijon 2011 Markert et al. 2010 Markert et al. 2013 Martin et al. 2007 Matheson et al. 2016 Maximov et al. 2014 McQuaid & Griffiths 2014 Mineur et al. 2008 Montefalcone et al. 2007 Nasrollahzadeh et al. 2008a Nasrollahzadeh et al. 2008b Neideman et al. 2003 Neira et al. 2007 O’Brien et al. 2006 Olabarria et al. 2009 Olabarria et al. 2010 Palomo et al. 2016 Piazzi et al. 2001 Renz & Forster 2013 Reusch & Williams 1998 Ross et al. 2013 Salvaterra et al. 2013 Schwindt et al. 2001
0
1
0
0
0
0
0
0
0
0
1
1
1
1
1
1
0
0
0
0
0
5
1
1
1
0
0
0
0
0
0
0
3
0
1
0
0
0
0
0
0
0
0
1
1
1
0
0
0
0
0
0
0
1
3
1
1
0
0
0
0
0
0
0
1
3
0
0
0
0
0
0
0
0
1
1
2
1
1
0
0
0
0
0
0
0
0
2
1
0
0
0
0
1
0
0
3
0
5
1
1
0
0
0
0
0
0
0
0
2
0
0
1
0
0
0
0
0
0
0
1
0
1
0
0
0
0
0
0
0
0
1
0
0
0
0
0
1
0
0
4
0
5
0
0
0
0
0
0
0
0
3
0
3
0
1
0
0
0
0
0
0
0
0
1
3
0
3
3
3
3
2
3
0
0
20
1
1
0
0
0
0
0
0
0
0
2
1
0
1
0
0
0
0
0
0
0
2
1
1
1
0
0
1
0
1
0
0
5
1
0
0
0
0
0
1
0
0
0
2
1
0
1
0
1
0
0
0
0
0
3
0
0
0
0
0
0
3
0
0
0
3
0
0
0
0
0
0
0
0
0
1
1
0
0
0
0
0
1
0
0
4
0
5
0
1
1
0
1
0
0
0
0
0
3
1
1
0
0
0
0
0
0
0
0
2
78 79 80 81 82 83 84 85 86 87 88 89 90 91 92 93 94 95 96 97 98 99 100 101 102
103 104 105 106 107 108 109 110 111 112 113 114 115 116 117 118 119 120 121 122 123 124 125 126 127 128 129
Sellheim et al. 2010 Shimeta et al. 2016 Siple & Donahue 2013 Smith et al. 2014a Smith et al. 2014b South et al. 2016 Strain & Johnson 2012 Strong et al. 2006
2
0
2
0
2
0
0
0
0
0
6
0
1
1
0
1
0
0
0
0
0
3
1
1
0
0
0
0
0
0
0
0
2
0
1
0
0
0
0
0
0
0
0
1
0
0
1
0
1
0
1
0
0
0
3
0
1
1
1
1
0
0
0
0
0
4
0
1
0
0
0
0
0
0
0
0
1
1
0
1
1
1
0
0
0
0
1
5
Sueiro et al. 2012 Sureda et al. 2008 Sweetman et al 2010 Tamburello et al. 2015 Thomsen 2010
1
1
1
0
0
0
0
0
0
0
3
0
1
0
0
0
0
0
0
0
0
1
1
1
0
0
0
0
0
0
2
1
5
1
0
0
0
0
0
0
0
0
0
1
1
0
1
0
0
0
0
0
0
0
2
Thomsen 2013 Tlig-Zouari et al. 2011 Tsai et al. 2010 Urban-Malinga et al. 2013 Vazquez-Luis et al 2008 Vazquez-Luis et al. 2009a Vazquez-Luis et al 2009b Vazquez-Luis et al 2010 Vazquez-Luis et al 2012 Wagner et al. 2012 Wigginton et al. 2014 Wikstrom & Kautsky 2004 Wilkie et al. 2013 Willette & Ambrose 2012
1
1
1
1
1
0
0
0
0
0
5
1
0
1
1
1
0
0
0
0
0
4
0
0
0
0
0
0
0
0
1
0
1
1
0
0
0
1
0
0
0
3
0
5
1
0
1
0
0
0
0
0
0
0
2
1
0
1
0
0
0
0
0
0
0
2
1
1
1
0
0
0
0
0
0
0
3
0
1
0
0
0
0
0
0
0
1
2
1
1
1
0
0
0
0
0
0
0
3
0
1
0
0
0
0
0
1
1
1
4
0
1
0
0
0
0
0
0
0
0
1
1
0
0
0
0
0
0
0
0
0
1
0
2
0
0
0
0
0
0
0
0
2
1
1
1
0
0
0
0
0
0
1
4
130 131 132 133 134 135 136 137 138 139
Windham & Ehrenfeld 2003 Wonham et al. 2005 Wright et al. 2007 Wright & Gribben 2008 Wright et al. 2010 Wright et al. 2012 Wright et al. 2014 Zaiko et al. 2009 Zhou et al. 2009 Zwerschke et al. 2016
Summary
0
1
0
0
0
0
0
0
0
0
1
0
1
0
0
0
1
0
0
0
1
3
0
3
0
0
0
0
0
0
0
0
3
0
0
0
0
0
0
0
0
0
1
1
0
1
0
0
0
0
0
0
0
0
1
0
0
0
0
0
0
0
0
0
1
1
0
1
0
0
0
0
0
0
0
0
1
2
0
0
0
0
0
0
0
0
0
2
1
0
0
0
0
0
1
0
2
0
4
0
0
0
0
2
0
0
0
0
0
2
74
82
55
12
31
15
20
16
53
26
384
Appendix S5. A detailed description of the studies distribution among categories. Single-Species Abundance We found 82 relevant studies examining the effects of IEE on single-species, including 44 observational and 38 experimental studies, from 70 different publications (Figs. S2, S3). Forty three studies examined autogenic engineers; 20 examined allogenic effects; and 19 studies described simultaneous allogenic and autogenic effects. The studied regions spanned 23 large marine ecosystems, with the majority originating in the Southeast Australian Shelf (n=10). Forty six of the studies focused on the effects of plants: Spartina (n=12), Lophocladia (n=2), Gracilaria (n=6), Caulerpa (n=11), Phragmites (n=2), Rhizophora (n=1), Sargassum (n=3), Codium (n=4), Grateloupia (n=1), Halophila (n=1), Lepidium (n=1), and Undaria (n=1). Other focused on the effects of the bivalves Magallana (n=10), Mytilus (n=1), Mytilopsis (n=1). Musculista (n=2), Isognomon (n=1), and Potamocorbula (n=1); the gastropod Batillaria (n=2); the annelids Ficopomatus (n=4), Sabella (n=2), and Marenzelleria (n=3), the crab Carcinus (n=2); the urchin Centrostephanus (n=1); and the tunicates Didemnum (n=2), Ciona (n=1), Styela (n=1), and Botrylloides (n=1).
Community Abundance We found 74 relevant studies examining the community abundance effects of invasive ecosystem engineers, including 49 observational and 25 experimental studies from 62 different publications (Figs. S4, S5). All studies were performed in the field. Forty nine studies tested autogenic engineering effects; 13 tested allogenic effects and 12 studies described a combined effect. The majority of studies originated in the Mediterranean Sea (n=13). Of the rest, nine were from California Current, six from the North Sea and five from the Baltic Sea. Forty five of the studies focused on the effects of plants: Spartina (n=13), Rhizophora (n=2), Sargassum (n=5), Gracilaria (n=3), Caulerpa (n=9), Phragmites (n=2), Codium (n=1), and Fucus (n=1). Others focused on the effects of the tunicates Bothrylloides and Didendum (n=1), the bryozoan Watersipora (n=2), the bivalves Mytilus (n=2), Musculista (n=2), Dreisenna (n=2), Magallana (n=7), Pinctada (n=1), Brachiodontes (n=1); the worms Ficopomatus (n=4), Marenzelleria (n=2), and Sabella (n=2), and the crab Carcinus (n=1).
Species Richness We found 55 relevant studies examining effects of IEE on species richness, including 37 observational and 18 experimental studies, from 43 different publications (Figs. S6, S7). Thirty studies quantified effects of autogenic engineers; ten quantified effects of allogenic engineers and 15 studies described a combined effect. Most studies came from the Mediterranean Sea (n=12), eight from the Celtic-Biscay shelf, and six from California current. 32 of the studies focused on the effects of plants: Spartina (n=9), Rhizophora (n=2), Sargassum (n=7), Caulerpa (n=6), Codium (n=4), and Gracilaria (n=2). Other focused on the effects of the tunicates Bothrylloides and Didendum, the worm Marenzelleria (n=1), the bivalves Mytilus (n=3), Musculista (n=2), Magallana (n=5) and Pinctada (n=1), the tunicates Bothrylloides and Didendum (n=1), and the bryozoan Watersipora (n=1).
Species Diversity We found 31 relevant studies examining the effects of invasive ecosystem engineers on species diversity, using the Shannon Index (H') as a measure. These included 16 observational and 15 experimental studies from 25 different publications (Figs. S8, S9). Fifteen studies examined autogenic engineers; six examined allogenic effects and ten studies described a combined effect. Seven studies were performed in the California Current, six in the Celtic-Biscay shelf, three in the Mediterranean Sea. Nineteen of the studies focused on the effects of plants: Spartina (n=8), Rhizophora (n=1), Sargassum (n=3), Caulerpa (n=2), Zostera (n=1), Gracilaria (n=1), and Undaria
(n=1). Others focused on the effects of the bivalves Magallana (n=4), Mytilus (n=3), Limnoperna (n=1), Corbicula (n=1), and Pinctada (n=1), the worm Marenzelleria (n=1), and the bryozoan Watersipora (n=1).
Community Evenness We found 12 relevant studies that tested effects on community evenness, including five experiments and seven observational studies from 10 different publications (Figs. S10, S11). Six studies tested autogenic engineers; four tested allogenic effects and two studies described a combined effect. Most of the invasive engineering species are plants: Rhizophora (n=1), Unidaria (n=1), Spartina (n=3), Caulerpa (n=1) and Sargassum (n=1). Other species are bivalves: Pinctada (n=1), Limnoperna (n=1), Corbicula (n=1), and Mytilus (n=1). Three of the studies have been conducted in the California Current, two in the Mediterranean Sea, and two in the Iberian coastal. Most of the studies are from lagoons (n=3) and rocky intertidal habitats (n=3). The remaining studies were conducted in sandflats (n=2), estuary (n=1); mangrove forest (n=1) and seagrass meadow (n=1).
Primary Production We found 15 relevant studies examining the primary production effects of invasive ecosystem engineers, including three observational and 12 experimental studies from 13 different publications (Figs. S12, S13). All but one of the studies estimated benthic productivity using Chlorophyll a measurements in the water column (n=4) or in sediment (n=10). One study used δ^13C isotopic signal as a productivity measure. Three studies examined autogenic engineers; seven examined allogenic effects and five studies described a combined effect. Four studies came from the California current, two from Patagonian shelf, three from the Iberian Coast, one from the Mediterranean, one from the Caspian Sea, two from the North Sea, one from the Baltic Sea and one from the Southeast Australian Shelf. Seven of the studies focused on the effects of plants: Spartina (n=3), Sargassum (n=1), Gracilaria (n=1), Zostera (n=1), and Caulerpa (n=1). Others focused on the effects of the worms Ficopomatus (n=2), Sabella (n=1), and Marenzelleria (n=2), the gastropod Batillaria (n=1), and the comb jelly Mnemiopsis (n=1).
Sedimentation rate We found 21 relevant studies examining the effects of IEE on sedimentation rate, including 13 observational and eight experimental studies from 12 different publications (Figs. S14, S15). Eleven studies examined autogenic engineering effects, five examined allogenic effects and five studies described a combined effect. Four studies came from the California Current, three from the Mediterranean Sea, three from the Baltic Sea, and three from the Gulf of Alaska. Fifteen of the studies focused on the effects of plants: Spartina (n=9), Zostera (n=1), Caulacanthus (n=1), and Caulerpa (n=3). Others focused on the effects of the worm Marenzelleria (n=3), the gastropod Batillaria (n=1), and the bivalve Magallana (n=2).
Decomposition We found 16 relevant studies examining the effects of invasive ecosystem engineers on decomposition, including six observational and ten experimental studies from 11 different publications (Figs. S16, S17). Five studies examined autogenic engineers; five examined allogenic effects and six studies described a combined effect. Four studies came from the California Current, three from the Mediterranean Sea, two from the North Sea, two from the Southeast Australian Shelf, and one each from the Patagonian Shelf, Celtic-Biscay Shelf, Gulf of Alaska, Gulf of California and Iberian Coastal. Eleven of the studies focused on the effects of plants: Spartina (n=6), Sargassum (n=1), Zostera (n=1), and Caulerpa (n=3). Others focused on the effects of the
worms Ficopomatus (n=1) and Marenzelleria (n=1), and the bivalves Musculista (n=1) and Magallana (n=2). Measurement methods varied between studies: ten used organic matter as a proxy for decomposition, four used sulfate reduction, one used carbon content, and one used total mass loss.
Nutrient Levels and Flux We found 53 relevant studies examining the effects of invasive ecosystem engineers on nutrient fluxes, including 24 observational and 29 experimental studies from 18 different publications (Figs. S18, S19). The tested nutrients varied between studies: 10 measured carbonic compounds (e.g., dissolved inorganic carbon, dissolved organic carbon, particulate organic carbon), 26 tested nitrogen compounds (e.g., nitrate, nitrite, ammonium), 8 tested phosphatic compounds, 4 tested sulfuric compounds, and 5 tested silicate. Twenty two studies examined autogenic effects, 20 examined allogenic effects, and 11 examined a combined effect. Ten studies came from the Mediterranean Sea, 10 from the Baltic Sea, 7 from the Caspian Sea, 7 from the California Current, 5 from the CelticBiscay shelf, 4 from Southeast Australian Shelf, 3 from the North Sea, 2 from East China Sea, one from North east US continental shelf, and 4 from Insular Pacific. 24 of the studies focused on the effects of plants: Caulerpa (n=10), Zostera (n=7), Rhizophora (n=4), Spartina (n=2) and Gracilaria (n=1). The rest focused on the effects of the bivalve Magallana (n=7), the gastropod Crepidula (n=1), the worms Sabella (n=4), and Marenzelleria (n=10), and the comb jelly Mnemiopsis (n=7). Growth and metabolic functions We found 25 relevant studies examining the effects of invasive ecosystem engineers on metabolic functions (e.g., growth rates, feeding rates) of the surrounding biota, including ten observational and 15 experimental studies from 22 different publications (Figs. S20, S21). Nine studies examined allogenic effects; 12 examined autogenic effects and four studies described a combined effect. Five studies came from the California Current, four from the North Sea, three from the Northeast U.S. Continental Shelf, two from the Gulf of Alaska, two from the Caribbean Sea, two from the Mediterranean, one from East-Central Australian Shelf, one from southeast Australia, one from Insular Pacific-Hawaiian, and one from the Iberian Coast. Twelve of the studies focused on the effects of plants: Spartina (n=1), Sargassum (n=2), Codium (n=2), Rhizophora (n=1), Halophila (n=1), Gracilaria (n=1), and Caulerpa (n=3). Others focused on the effects of the gastropods Crepidula (n=1) and the periwinkle Littorina (n=1), the worms Sabella (n=1) and Marenzelleria (n=1), the tunicates Botrylloides (n=1) and Didemnum (n=2), the bivalves Magallana (n=2), Musculista (n=1) and Potamocorbula (n=1). Measurement methods varied between studies: 19 tested growth rate, two measured mean body size, two studied predation rate, two studied calcium carbonate precipitation, two studied carbon uptake, and one studied enzyme activity - all of native species.
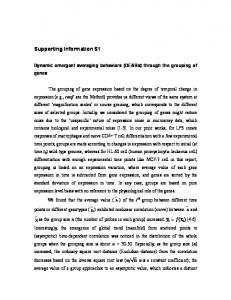
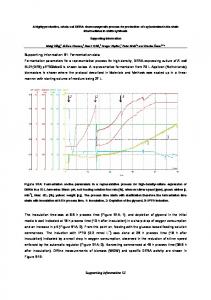
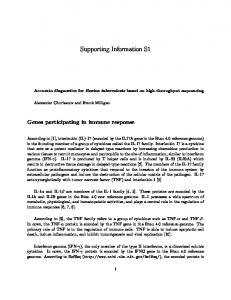
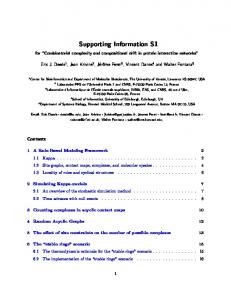
Appendix 6: Supporting Information Figures Supporting Information figure captions Figure S1. Study type (observational / experimental) and engineering effect type (autogenic / allogenic / combined) of the complete meta-analysis dataset (n=387). Figure S2. Meta-analysis of single species abundance (n=83) using random-effects model to compute the summary effect size (Hedges' g ± 95% C.I.). The effect size of each study is represented by a black square symbol, which area is proportional to the study weight. The diamond at the bottom of the forest plot and its width represent the summary effect size ± 95% C.I. Figure S3. Subgroup analyses of single species abundance by: A) engineering type, B) study type, C) habitat, D) invasive ecosystem engineer taxonomic group, and E) region. To compute each summary effect size (Hedges' g ± 95% C.I., represented by a square symbol and a dashed line) a mixed-effects model was used. A random effects model is used to combine studies within each subgroup. The study-to-study variance (tau-squared) is assumed to be the same for all subgroups this value is computed within subgroups and then pooled across subgroups. Figure S4. Meta-analysis of community abundance (n=76) using random-effects model to compute the summary effect size (Hedges' g ± 95% C.I.). The effect size of each study is represented by a black square symbol, which area is proportional to the study weight. The diamond at the bottom of the forest plot and its width represent the summary effect size ± 95% C.I. Figure S5. Subgroup analyses of community abundance by: A) engineering type, B) study type, C) habitat, D) invasive ecosystem engineer taxonomic group, and E) region. To compute each summary effect size (Hedges' g ± 95% C.I., represented by a square symbol and a dashed line) a mixed-effects model was used. A random effects model is used to combine studies within each subgroup. The studyto-study variance (tau-squared) is assumed to be the same for all subgroups - this value is computed within subgroups and then pooled across subgroups. Figure S6. Meta-analysis of species richness (n=55) using random-effects model to compute the summary effect size (Hedges' g ± 95% C.I.). The effect size of each study is represented by a black square symbol, which area is proportional to the study weight. The diamond at the bottom of the forest plot and its width represent the summary effect size ± 95% C.I. Figure S7. Subgroup analyses of species richness by: A) engineering type, B) study type, C) habitat, D) invasive ecosystem engineer taxonomic group, and E) region. To compute each summary effect size (Hedges' g ± 95% C.I., represented by a square symbol and a dashed line) a mixed-effects model was used. A random effects model is used to combine studies within each subgroup. The study-tostudy variance (tau-squared) is assumed to be the same for all subgroups - this value is computed within subgroups and then pooled across subgroups. Figure S8. Meta-analysis of species diversity (n=31) using random-effects model to compute the summary effect size (Hedges' g ± 95% C.I.). The weight of each study is represented by its square size. The effect size of each study is represented by a black square symbol, which area is proportional to the study weight. The diamond at the bottom of the forest plot and its width represent the summary effect size ± 95% C.I. Figure S9. Subgroup analyses of species diversity by: A) engineering type, B) study type, C) habitat, D) invasive ecosystem engineer taxonomic group, and E) region. To compute each summary effect size (Hedges' g ± 95% C.I., represented by a square symbol and a dashed line) a mixed-effects model
was used. A random effects model is used to combine studies within each subgroup. The study-tostudy variance (tau-squared) is assumed to be the same for all subgroups - this value is computed within subgroups and then pooled across subgroups. Figure S10. Meta-analysis of species evenness (n=12) using random-effects model to compute the summary effect size (Hedges' g ± 95% C.I.). The effect size of each study is represented by a black square symbol, which area is proportional to the study weight. The diamond at the bottom of the forest plot and its width represent the summary effect size ± 95% C.I. Figure S11. Subgroup analyses of species evenness by: A) engineering type, B) study type, C) habitat, D) invasive ecosystem engineer taxonomic group, and E) region. To compute each summary effect size (Hedges' g ± 95% C.I., represented by a square symbol and a dashed line) a mixed-effects model was used. A random effects model is used to combine studies within each subgroup. The studyto-study variance (tau-squared) is assumed to be the same for all subgroups - this value is computed within subgroups and then pooled across subgroups. Figure S12. Meta-analysis of primary production (n=15) using random-effects model to compute the summary effect size (Hedges' g ± 95% C.I.). The effect size of each study is represented by a black square symbol, which area is proportional to the study weight. The diamond at the bottom of the forest plot and its width represent the summary effect size ± 95% C.I. Figure S13. Subgroup analyses of primary production by: A) engineering type, B) study type, C) habitat, D) invasive ecosystem engineer taxonomic group, and E) region. To compute each summary effect size (Hedges' g ± 95% C.I., represented by a square symbol and a dashed line) a mixed-effects model was used. A random effects model is used to combine studies within each subgroup. The studyto-study variance (tau-squared) is assumed to be the same for all subgroups - this value is computed within subgroups and then pooled across subgroups. Figure S14. Meta-analysis of sedimentation (n=21) using random-effects model to compute the summary effect size (Hedges' g ± 95% C.I.). The effect size of each study is represented by a black square symbol, which area is proportional to the study weight. The diamond at the bottom of the forest plot and its width represent the summary effect size ± 95% C.I. Figure S15. Subgroup analyses of sedimentation by: A) engineering type, B) study type, C) habitat, D) invasive ecosystem engineer taxonomic group, and E) region. To compute each summary effect size (Hedges' g ± 95% C.I., represented by a square symbol and a dashed line) a mixed-effects model was used. A random effects model is used to combine studies within each subgroup. The study-tostudy variance (tau-squared) is assumed to be the same for all subgroups - this value is computed within subgroups and then pooled across subgroups. Figure S16. Meta-analysis of decomposition (n=16) using random-effects model to compute the summary effect size (Hedges' g ± 95% C.I.). The effect size of each study is represented by a black square symbol, which area is proportional to the study weight. The diamond at the bottom of the forest plot and its width represent the summary effect size ± 95% C.I. Figure S17. Subgroup analyses of decomposition by: A) engineering type, B) study type, C) habitat, D) invasive ecosystem engineer taxonomic group, and E) region. To compute each summary effect size (Hedges' g ± 95% C.I., represented by a square symbol and a dashed line) a mixed-effects model was used. A random effects model is used to combine studies within each subgroup. The study-tostudy variance (tau-squared) is assumed to be the same for all subgroups - this value is computed within subgroups and then pooled across subgroups.
Figure S18. Meta-analysis of nutrient flux (n=53) using random-effects model to compute the summary effect size (Hedges' g ± 95% C.I.). The effect size of each study is represented by a black square symbol, which area is proportional to the study weight. The diamond at the bottom of the forest plot and its width represent the summary effect size ± 95% C.I. Figure S19. Subgroup analyses of nutrient flux by: A) engineering type, B) study type, C) habitat, D) invasive ecosystem engineer taxonomic group, and E) region. To compute each summary effect size (Hedges' g ± 95% C.I., represented by a square symbol and a dashed line) a mixed-effects model was used. A random effects model is used to combine studies within each subgroup. The study-tostudy variance (tau-squared) is assumed to be the same for all subgroups - this value is computed within subgroups and then pooled across subgroups. Figure S20. Meta-analysis of growth and metabolic functions (n=25) using random-effects model to compute the summary effect size (Hedges' g ± 95% C.I.). The effect size of each study is represented by a black square symbol, which area is proportional to the study weight. The diamond at the bottom of the forest plot and its width represent the summary effect size ± 95% C.I. Figure S21. Subgroup analyses of growth and metabolic functions by: A) engineering type, B) study type, C) habitat, D) invasive ecosystem engineer taxonomic group, E) region, and G) nutrient type. To compute each summary effect size (Hedges' g ± 95% C.I., represented by a square symbol and a dashed line) a mixed-effects model was used. A random effects model is used to combine studies within each subgroup. The study-to-study variance (tau-squared) is assumed to be the same for all subgroups - this value is computed within subgroups and then pooled across subgroups. Figure S22. Funnel plots of standard error by Hedges' g, of the following outcomes: A) single-species abundance, B) community abundance, C) species richness, D) species diversity, E) species evenness, F) primary production, G) sedimentation H) decomposition, I) nutrient flux, and J) growth and metabolic functions. The observed studies are shown as open circles and the observed point estimates are shown as open diamonds below the x-axis. The imputed studies and adjusted point estimates according to the Trim and Fill algorithm (Duval & Tweedie, 2000) are shown in filled circles and diamonds.
Fig. S1
Fig. S2
Fig. S3
Fig. S4
Fig. S5
Fig. S6
Fig. S7
Fig. S8
Fig. S9
Fig. S10
Fig. S11
Fig. S12
Fig. S13
Fig. S14
Fig. S15
Fig. S16
Fig. S17
Fig. S18
Fig. S19
Fig. S20
Fig. S21
Fig. S22