Aug 1, 1998 - J. C. Bilello and S. M. Yalisove. Department of ... growth in 400 nm thick Mo films grown on the rough substrates was studied using scanning electron microscopy .... cathode voltage and current of 360 V and 1.3 A for 2 h. The.
JOURNAL OF APPLIED PHYSICS
VOLUME 84, NUMBER 3
1 AUGUST 1998
Surface roughness and in-plane texturing in sputtered thin films J. F. Whitacre Department of Materials Science and Engineering, University of Michigan, 2300 Hayward Street, Ann Arbor, Michigan 48109-2136
Z. U. Rek Stanford Synchrotron Radiation Laboratory, Stanford University, Stanford, California 94309
J. C. Bilello and S. M. Yalisove Department of Materials Science and Engineering, University of Michigan, 2300 Hayward Street, Ann Arbor, Michigan 48109-2136
~Received 19 January 1998; accepted for publication 1 May 1998! Real surfaces are not flat on an atomic scale. Studying the effects of roughness on microstructural evolution is of relevance because films are sputtered onto nonideal surfaces in many applications. To this end, amorphous rough substrates of two different morphologies, either elongated mounds or facets, were fabricated. The microstructural development of films deposited onto these surfaces was examined. In particular, the development of a preferred crystallographic orientation in the plane of growth in 400 nm thick Mo films grown on the rough substrates was studied using scanning electron microscopy, transmission electron diffraction, and high resolution x-ray diffraction ~using f scans in the symmetric grazing incidence x-ray scattering geometry with a synchrotron light source!. It was found that the degree of texturing was dependent upon the type of roughness and its orientation during deposition. By limiting the average oblique angle of incident adatom flux, rough surfaces slowed the development of in-plane texture. Comparison between experimental data and theoretical predictions showed that a recent analytical model is able to reasonably predict the degree of texturing in films grown onto these surfaces. © 1998 American Institute of Physics. @S0021-8979~98!07015-7#
I. INTRODUCTION
II. THEORY
The majority of studies concerned with microstructural evolution during plasma vapor deposition ~PVD! growth focus on films deposited onto very flat surfaces such as polished Si substrates.1,2 However, in most applications ~i.e., tribological films, anticorrosion films, thermal barriers, multilayer thin films, semiconductor devices!, films are grown onto nonideal, rough surfaces.3,4 The role of this roughness on microstructural evolution during sputter deposition is the focus of the work presented here. A methodology for creating two different types of roughness is described, and the microstructures of films grown onto these surfaces are examined. One aspect of film development, inplane texturing, is used to quantify the role roughness plays in altering the geometry of the deposition process. Several papers have described the development of crystallographic texture in the plane of growth in PVD films.1,5,6 An analytical model previously developed suggests that the rate of in-plane texturing is related, in part, to the allowed angular range of incident adatom flux.7 Rough substrates can alter this parameter, since surface features having the appropriate geometry and scale limit incoming adatom flux. Under these circumstances, the rate of in-plane texturing should decrease. This article describes work done to explore this possibility by first modeling and then experimentally testing the dependence of in-plane texturing on two kinds of surface roughness.
In-plane texturing has been observed when Mo films are sputtered onto flat Si wafers under appropriate deposition parameters.1 A ~110! out-of-plane ~or fiber! texture initially develops ~in the first 200 nm! in these films. In-plane texturing then evolves as grains of certain in-plane orientations ~as selected by deposition geometry! overgrow other grains which are oriented less favorably. A recent analytical model describing this phenomena relies on a combination of two physical mechanisms: ~1! anisotropic surface transport, and ~2! atomistic shadowing effects which occur with oblique adatom incidence.7 Anisotropic surface transport causes grains to grow faster along a particular crystallographic direction in the plane of growth. For example, Mo grains grow most rapidly along their ~100! axis and slowest in the ~110! direction. This results in grains which are elongated ~to increasing degrees as the films thicken! along their ~100! direction.1 If there is minimal surface diffusion, atomic shadowing occurs. Adatoms pile up on existing grains creating significant void formation between those grains.8 If the adatoms are obliquely incident onto the substrate, this shadowing effect will also cause the adatom pile up to be more efficient in one in-plane direction over any other. In particular, adatoms will contribute most efficiently to in-plane formation in the direction normal to the projection of the flux vector onto the plane of the substrate. This is the in-plane direction of highest adatom capture efficiency. Minimum capture efficiency is in the
0021-8979/98/84(3)/1346/8/$15.00
1346
© 1998 American Institute of Physics
Whitacre et al.
J. Appl. Phys., Vol. 84, No. 3, 1 August 1998
direction parallel to the projection of the incoming flux vector. When both shadowing and anisotropic surface transport conditions exist concurrently with oblique adatom flux, those grains whose crystallographic fast in-plane growth direction corresponds to the highest adatom capture efficiency direction will compete favorably during deposition.7 Eventually, only those grains that nucleated with their fast crystallographic growth direction aligned with the direction of highest adatom capture efficiency due to shadowing will survive. Mathematically, the total in-plane growth rate in a particular direction x ~polar angle! is given as the product of two probabilities: n ( a eff ,x), which accounts for the shadowing affect, and m~x!, which reflects the in-plane growth anisotropy. a eff is the effective oblique incident adatom flux angle. The in-plane growth rate for a grain crystallographically oriented with its fast growth direction at an angle f with respect to the direction of highest shadowing capture efficiency, is then g ~ a eff , x , f ! 5 n ~ a eff , x ! u ~ x 1 f ! . 7
f ~ f i ,0! G t ~ a eff , f i ! , ( i f ~ f i ,0! G t ~ a eff , f i !
~2!
where f ( f ,t) is the areal fraction of grains with an in-plane crystallographic orientation f at time t ~which represents an incremental step in deposition!. a eff is of interest because rough surface features can locally limit the angular range of adatom flux, thereby changing a eff and the rate of in-plane texturing. a eff is defined as the arc cosine of the ratio of the slow to fast in-plane capture probabilities due to shadowing. The shadowing capture probability in a particular in-plane direction, n, is calculated by integrating the product of the angular cathode flux distribution and the surface atom capture range over a:
n5
E
a max
a min
~ flux distribution!
3 ~ adatom capture range! d a .
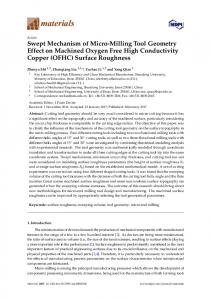
FIG. 1. Schematics showing the angular range of incident adatom flux for a ~a! flat surface, ~b! surface consisting of hemispherical mounds, and ~c! surface consisting of sharp facets. Three different cases, I, II, and III, are given in ~b! and ~c! to illustrate how the degree of shadowing depends on surface location. Calculated values for a eff are given for each case; surface roughness causes the average effective incident angle of adatom flux to decrease.
~1!
The total in-plane growth rate for any grain, G( a , f ), may be calculated by integrating g( a eff ,x,f) over x. The evolution of in-plane texture over time can then be calculated using the formula f ~ f i ,t ! 5
1347
~3!
ogy is rough, however, the range of allowed adatom flux becomes constrained over much of the surface and the average a eff will decrease. Figures. 1~b! and 1~c! show the shadowing present at three different locations on surfaces consisting of either hemispherical mounds or facets. A nonweighted average of a eff is calculated to be 17° for the hemispherical mounds and 20° for the facets ~which, in this case, have faces which are inclined 60° with respect to the plane of the substrate!. The sensitivity of in-plane texturing to a eff is shown in Fig. 2. The areal fraction of grains with particular in-plane crystallographic orientations f are calculated using Eq. ~2! and are plotted for several a eff values. In this case, t5125, and corresponds to a ;400 nm thick film. For higher a eff values, grains with favorable in-plane orientations overgrow other grains more rapidly. In general, the sharper the maxima around f 50, the higher the degree of in-plane texturing. The model predicts that, due solely to geometrical constraints, there is a significant difference in in-plane texturing between a film grown on a flat substrate and an identical film grown on a surface consisting of hemispherical mounds or facets.
Normal to the flux vector in the plane of growth ( n f ), the adatom capture range is 4r, where r is the adatom radius. Parallel to the flux vector, where ( n s ), the capture range is given by 2r12r cos(a). The flux distribution is assumed to be cos3 a, and has been determined experimentally elsewhere.9 Based on the definitions given above, a eff may be calculated using
a eff5arccos
S
D
n s ~ a min , a max! 7 , n f ~ a min , a max!
~4!
where the only relevant variables are the maximum and minimum angle of incident adatom flux in Eq. ~3!. If a film is deposited onto a flat surface, a can range from 290° to 90° everywhere. In this case, a eff is calculated to be 23°, as indicated in Fig. 1~a!. If the substrate morphol-
FIG. 2. In-plane texturing as modeled in a ;400 nm thick film ~t5125 iterations!. f is the angular deviation between a grain’s fast ~in-plane! crystallographic growth direction and the direction of highest capture efficiency due to shadowing.
1348
Whitacre et al.
J. Appl. Phys., Vol. 84, No. 3, 1 August 1998
FIG. 4. Schematic of the ion-bombardment step.
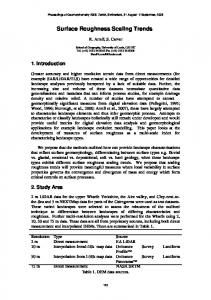
FIG. 3. Comparative images showing the surface morphology of a ;2.4 m m thick Mo film: ~a! plan-view SEM, ~b! AFM ~the profile plot is a cross section taken from the area indicated by the white line!, and ~c! crosssection bright-field TEM.
III. EXPERIMENT A. Initial surface
To create well-defined, repeatable amorphous rough substrates, the existing morphology found on thick (;2.5 m m) sputtered Mo films was modified. The microstructural and crystallographic evolution observed in these films is discussed elsewhere.1 The surfaces of these films consisted of elongated faceted grains. Figures 3~a! and 3~b! show a planview scanning electron micrograph and an atomic force micrograph ~studied using a Digital Instruments atomic force microscope in ‘‘tapping’’ mode10! images of a ;2.4 m m Mo film grown on a flat ~100! Si wafer ~with native oxide!. Figure 3~c! shows a cross-section bright-field transmission electron micrograph. The elongated columnar grains display a ‘‘picket-fence’’ like cross section, where there is significant void formation between large grains ~;0.1 m m in width! which end in pointed facets. This surface morphology is consistent throughout the substrate and is reproducible from deposition to deposition ~provided that all conditions are held constant!. These films were sputter deposited ~planar magnetron!, at room temperature, in 10 mTorr of Ar, at a cathode voltage and current of 360 V and 1.3 A for 2 h. The base chamber pressure was ;2310 26 Torr and the deposition rate was ;20 nm/min.
roughness consisting of hemispherical mounds, a Gatan™ dual ion mill ~using Ar as a sputtering gas! was used to round off the existing surface facets. The samples were not rotated during bombardment and the direction of incoming ion flux was parallel to the direction of grain elongation. Figure 4 is a schematic of the milling procedure. The circular area of bombardment had a 3 mm diameter, as defined by the ion mill sample holder. Figure 5 shows an atomic force microscope ~AFM! image of a typical surface after 10 min of bombardment at a 10° incident angle, a potential of 5.5 kV, and a sample current of 0.5 mA. The attached plot shows a cross section of the surface ~the survey area is indicated by the white line!. A series of nominally hemispherical mounds, whose radii vary from 40 to 60 nm, are evident. The relative height of the surface features vary with respect to each other and stay within 1/260 nm. The experimental surfaces, both milled ~mounds! and unmilled ~facets!, were covered with a thin layer ~less than 20 nm!, as determined using cross-section transmission electron microscope ~TEM! of amorphous carbon using a standard carbon evaporator ~the image in Fig. 5 was collected after the carbon layer was applied!. This negated the possibility of a crystallographic inheritence from the initial Mo film subsequent film growth. C. Film deposition
Figure 6~a! is a schematic showing the deposition geometry used for all films described in this article ~including the Mo underlayer!. Substrates rest on a platen which rotates
B. Roughened substrates
The surface morphology found on the thick films described above served as new faceted substrates. To create a
FIG. 5. AFM image of a ;2.4 m m thick Mo film surface after ion bombardment and subsequent carbon coating. The white line indicates the sample area used in the profile plot.
J. Appl. Phys., Vol. 84, No. 3, 1 August 1998
FIG. 6. Schematic of the experimental deposition system: ~a! chamber geometry, and ~b! substrate orientation during deposition.
beneath a 4 9 planar magnetron cathode. The substrates are exposed to a full 180° range of flux in the plane parallel to their direction of rotation. In the plane normal to rotation direction, however, the angular flux range is much less. This configuration provides a break in the symmetry of the deposition. There is, on average, more oblique flux in one plane over any other, which creates an in-plane adatom capture anisotropy due to shadowing as described in the theory section. The direction of highest in-plane capture efficiency is normal to the direction of rotation. 400 nm thick Mo films were sputtered onto the roughened surfaces under the same deposition conditions used to grow the initial Mo layer ~see in Sec. IV A!. The elongated features in the substrates were aligned perpendicular to the rotation direction to expose their rough cross sections to the full range of adatom flux, as modeled. Other substrates were aligned such that their elongated features were parallel to the rotation direction. This provided a flat cross section in the plane parallel to substrate rotation: the average a eff is ;23° in this direction despite the presence of rough surface features. Films were also deposited onto a flat Si~100! test-grade substrate ~with native oxide!. Figure 6~b! shows substrate alignment during deposition. All experimental films were deposited simultaneously. To test the effectiveness of the native oxide/amorphous layer, a 400 nm thick film was deposited onto a faceted surface which had no oxide or amorphous surface layer. A heavily faceted ;2.4 m m film was grown and left in the evacuated sputter chamber for 18 h to consider the role of residual impurities. A 400 nm experimental deposition was then performed without exposing the deposition surface to oxygen ~or carbon!. D. Analytical methods
The microstructure of the experimental films was studied using scanning electron microscopy ~SEM!, transmission
Whitacre et al.
1349
electron microscopy ~TEM!, transmission electron diffraction ~TED!, and high resolution x-ray diffraction. An Hitachi S-800 field emission SEM was used with its accelerating potential at 7 kV and its sample distance set to 5 mm, allowing for resolved images to be recorded at magnifications of 20 0003 to 40 0003. Further examination was accomplished using a JEOL 2000 TEM ~accelerating voltage5200 kV!. Plan-view TEM samples were created by cutting the substrates into 3mm discs, mechanically thinning them from the back, and chemically etching them to perforation with a HNO3 :HF: CH3COOH mixture ~3:5:3 ratio!. Only the top 100–1000 Å of the deposited ~experimental! film remained in electron transparent areas of the sample. TED was performed using the JEOL 2000 to qualitatively analyze texturing. All diffraction patterns were recorded from a defined area of equal size in each of the samples using a selected area aperture. In-plane texturing in the experimental films was studied using high resolution grazing x-ray diffraction on beamline 7-2 at SSRL ~operating nominally at 3 GeV and 100 mA at fill!. The use of synchrotron radiation was necessary because traditional pole figure analysis would include diffraction from the thick, highly textured, Mo underlayer. A grazing incidence geometry combined with high intensity x rays allowed for only the topmost layers of the experimental films to be examined. Phi scans in the symmetric grazing incidence x-ray scattering ~GIXS! geometry allowed for sections of complete pole figures to be collected. All samples for this study were 3 mm discs cut from the substrate using an ultrasonic cutting device. This allowed those films which were deposited onto milled rough areas of be isolated. The Bragg conditions for the Mo~110! @or ~200!#11 peak was identified for each sample, and were nominally at 2 u 532.38 @46.4 for ~200!# for monochromatic x rays of wavelength 0.124 nm ~10 keV!. I 0 had an incident angle a 50.107° ~u 510°, x 52.1°!, giving a penetration depth of ;17 nm. The divergence of the beam was 0.2 mrad ~vertical! by 3 mrad ~horizontal!. 1 mm by 1 mm slits defined I 0 and 1 mrad Soller slits limited the vertical divergence of the diffracted beam. I 0 doses were measured by a scintillation detector located before the incident beam defining slits. X-ray detection was accomplished using a Ge detector ~liquid nitrogen cooled!. A computer-controlled fourcircle 5020 Huber diffractometer was used for sample manipulation. All diffraction patterns were collected in the ‘‘dose’’ mode to eliminate intensity fluctuations due to beam instabilities. To guarantee that all scans were collected under the same alignment conditions, both 2u and a were rocked over their theoretically ideal positions before each scan to verify that optimal diffraction conditions were met. The samples were rotated about their surface normals ~through F! during data collection and the resulting F scans can be compared to the theoretical plots shown in Fig. 2~b!. The diffracted intensity at any F is directly proportional to the fraction of grains which have that particular in-plane orientation.
1350
Whitacre et al.
J. Appl. Phys., Vol. 84, No. 3, 1 August 1998
IV. RESULTS AND ANALYSIS A. Scanning electron microscopy
Figure 7 shows plan-view SEM images of the ;400 nm experimental films. When the direction of mound elongation was parallel to direction of substrate rotation during deposition, the mounds parallel ~MP! case ( a eff523°), there was visible granular alignment in the direction normal to the substrate motion. If the mounds were oriented normal to the direction of rotation, mounds normal ~MN, a eff517°!, less granular order is observed. Figure 7~c! shows the surface of the ;400 nm film deposited onto a flat Si wafer ( a eff 523°). Some granular organization is evident, though it is less than that observed in the MP case. Figure 7~d! is an image of the same growth on the amorphous faceted surface ~FN! case, where a eff;20°. There is little discernible granular order in the plane of growth. However, the macroscopic surface morphology appears to be rough: there are small equiaxial mounds or clumps which are composed of smaller grains. The facets parallel case ~FP! appears to be identical to the FN case. Figure 7~e! shows an image of the surface morphology for the ;400 nm film deposited onto a faceted Mo surface which was not covered with any amorphous material. The grains are much larger and display a considerable degree of alignment with each other. For the films grown on mounded substrates, a rounded surface morphology is evident after film growth. There is a considerable difference between the size of the mounds on the film surface in comparison to those observed on the original substrate. The spacing on the initial roughened surface ~from Fig. 5! is ;80 nm, whereas it is ;200 nm at the surface of the experimental film. B. Transmission electron microscopy
The degree of in-plane texturing for localized areas was studied using TEM and TED. Figures 8~a!–8~e! show brightfield TEM images with corresponding TED patterns. There is observable in-plane texturing for the MP @Fig. 8~a!# case @as attested to by localized diffracted intensity in the ~110! diffraction ring#. No such crystallographic order exists for the MN @Fig. 8~b!# or FN ~also FP! @Fig. 8~d!# case. As expected from previous studies,1 there is observable in-plane texture in the film deposited onto a flat substrate @Fig. 8~c!#. The grouping of the diffracted intensities in the diffraction pattern in this case is similar to that found for the MP film. Much more in-plane texturing is found in the film grown on the crystalline faceted surface, as shown in Fig. 8~e!. C. X-ray diffraction FIG. 7. Plan-view SEM images of ;400 nm thick Mo films grown in identical conditions onto: ~a! elongated mounded surface parallel ~MP! to the rotation direction, ~b! elongated mounded surface normal ~MN! to the rotation direction, ~c! flat, as received Si wafer, ~d! elongated facets either parallel or normal to the rotation direction, ~e! faceted surface which had no amorphous layer.
Figure 9 shows the diffraction patterns collected. The F scans of the films grown on the MP and flat12 substrates are almost identical, whereas the scan of MN and FN films show a decrease in intensity and spreading of the diffraction peak, indicating a decrease in in-plane texturing.
Whitacre et al.
J. Appl. Phys., Vol. 84, No. 3, 1 August 1998
1351
FIG. 9. Symmetric GIXS f scans collected in the ~110! Bragg condition taken from the top ;17 nm of films which were grown on rough substrates consisting of ~a! elongated rounded mounds, and ~b! elongated facets. The orientation of these features during deposition is indicated.
There is no discernible difference in texturing between the films grown on the amorphous faceted surfaces oriented normal ~FN! and parallel ~FP! to the rotation direction. Figure 11 shows this comparison. V. DISCUSSION
FIG. 8. Plan-view bright-field TEM and corresponding selected area TED images for ;400 nm thick Mo films deposited onto: ~a! elongated mounded surface parallel ~MP! to the rotation direction, ~b! elongated mounded surface normal ~MN! to the rotation direction, ~c! flat, as received Si wafer, ~d! elongated facets either parallel or normal to the rotation direction, ~e! faceted surface which had no amorphous layer.
Little difference was found between the ~110! and ~200! f scans. Figure 10 shows this comparison for the MN case. The data points on these two curves are largely within experimental error of each other. Data collected using the ~110! Bragg condition was used for further analysis due to its significantly greater intensity ~creating less uncertainty in the data!.
It must be established that the amorphous layer of evaporated carbon was effective in preventing the Mo underlayer from crystallographically influencing the experimental films. There is clear evidence to support this. There is a
FIG. 10. Comparison between ~200! and ~110! GIXS f scans taken from the top ;17 nm of the film grown on the MN case substrate.
1352
J. Appl. Phys., Vol. 84, No. 3, 1 August 1998
Whitacre et al.
FIG. 11. Comparison between the degree of ~110! in-plane texture for ;400 nm Mo films grown on the two orientations of roughness consisting of amorphous elongated faceted surfaces.
significant difference in in-plane texturing between identical films grown on similar rough substrates with and without carbon layer. Without an oxide/carbon coating on the faceted substrate, the 400 nm experimental layer displayed significant in-plane texturing. The same film grown on a coated faceted surface had much less in-plane texturing ~less than that found in films grown on flat, amorphous, silicon oxide substrates!. Because the substrates were not able to have any direct crystallographic influence on the experimental films, all differences in in-plane texturing must have been due only to substrate surface morphology and its orientation with respect to deposition geometry. SEM, TEM, and TED qualitatively show this. The highest degree of granular alignment, and in-plane texturing, was observed in the MP case. The MN, FN, and FP cases showed less texturing than that observed for identical films deposited onto flat substrates. This effect was predicted in the theory section, where a decrease in the average a eff for rough surfaces was calculated and correlated to a decrease in-plane texturing. The x-ray data may be fit to the mathematically generated diffraction patterns introduced in the theory section. Figure 12 shows this. The theoretical curves were multiplied by a scalar and offset vertically ~a minimal adjustment! to obtain optimum fit. For the flat surface, a eff523°, as it must be to accommodate the deposition onto flat substrates.7 a eff 525° for the MP case ~2° increase from predicted value!, 18° for the MN case ~1° increase!, and 19 for FN and FP case ~1° decrease!. Figure 13 shows the sensitivity of the fitted plots. The a eff517° curve is applied to the data from the film grown on the flat substrate ( a eff523°). The uncertainty of the data points is too small to account for the theoretical plot, indicating that the predictions may be experimentally resolved. The modeled curves were within 62° a eff to the actual data in all cases. This is reasonable, as the actual rough surfaces were only approximations of the perfectly hemispherical and faceted morphologies modeled. The 2° increase in a eff observed for the MP case, however, may not be explained using the ideas presented in this article alone. Further discussion of this increase in in-plane texturing will be found in future publications.
FIG. 12. Theoretical fits of experimental data. Shown are both predicted and best fit ~via manipulation of a eff! of the ~110! GIXS f scans. The ;400 nm thick Mo films were deposited onto roughened substrates oriented with their: ~a! elongated rounded mounds parallel to rotation, ~b! elongated rounded mounds normal to rotation, ~c! elongated facets parallel or normal to rotation, and ~d! flat surface.
In the theory section, it was assumed that the shape of the macroscopic surface features are constant during film development. It has been shown experimentally that the features on the mounded substrates increase in size by a factor of ;2 but keep the same basic morphology as that found on the substrate. This sort of ‘‘mound competition’’ has been predicted for amorphous films deposited onto roughened surfaces.13–16 The modeling work done by Bales and Zangwill13 is relevant to the films grown in this experiment because we observe shadowing effects which take place as a result of rough surface features which are much larger than the nucleating and developing grains. Two levels of shadowing occur: macroscopic effects due to the rough substrate features and microscopic effects due to the roughness created by individual grain formation.
Whitacre et al.
J. Appl. Phys., Vol. 84, No. 3, 1 August 1998
FIG. 13. Plot comparing the best-fit theory curves for a eff517 and a eff 523 with diffraction data collected from the top ;17 nm of the experimental film deposited onto the flat substrate ~where a eff523!.
This can also explain why the films grown on the amorphous faceted surfaces display less in-plane texturing than was calculated. It is clear from both SEM and TEM images that the initial faceted surface shape did not propagate through the entire growth. Rather, a series of equiaxed ~in the plane of growth! clumps consisting of several grains developed. The deposition surface modeled can not be applied to the entire growth. Further, it has been shown that the average a eff for films grown on these surfaces was ;19° ~for both FN and FP!, which is close to that found in the mounded substrate case. There was no discernible difference in the degree of in-plane texturing between the FP and FN conditions: substrate orientation during deposition was not important for the faceted type of roughness. This corresponds to the SEM, TEM, and TED data, where no dependence on substrate orientation was observed for the FN and FP cases. VI. CONCLUSIONS
The rate of In-plane texturing in thin Mo films has been shown to decrease for depositions onto amorphous roughened surfaces with cross sections consisting of hemispherical mounds or facets. This effect was explained in reference to a recent model which was initially developed to describe texturing in films grown on flat surfaces and was extended here to account for non-ideal substrates. Rough features lowered a eff the average effective angle of incident adatom flux during deposition, thereby decreasing the rate of in-plane texturing. Experimental data were fit, with some accuracy, to theory plots. Further knowledge has been attained concerning the physical reality of texture development during sputter deposition of thin Mo films: by limiting the range of obliquely incident adatom flux via surface engineering, the degree of in-plane texture in sputtered Mo films may be predicted and ultimately controlled.
1353
In summary: Well defined amorphous rough surfaces consisting of hemispherical mounds or facets were created. A decrease in the rate of in-plane texturing was predicted and observed in films deposited onto these surfaces as compared to films grown under identical conditions onto flat surfaces. The critical variant in the experiment was the roughness of the cross section exposed to a full angular range of adatom flux. Rough features limited the average angular range of adatom flux, thereby decreasing the rate of in-plane texturing. If the elongated mounds were oriented parallel to rotation during deposition, the in-plane texturing rate was found to increase. This phenomena is a subject for continued study and will be described in a later publication. The rounded substrate morphology was found to persist through the thickness of the experimental films, though the scale of these features was found to increase. No such behavior was observed for the faceted substrates. Further, no difference in in-plane texturing was observed between the two substrate orientational variants for the faceted substrate. ACKNOWLEDGMENTS
The authors thanks Oleh Karpenko and Ashwani Malhotra for encouragement and stimulating discussion. This work was supported under ARO Army Contract No. DAAH 04-95-1-0120. Diffraction data collected at SSRL beam line 7-2, funded by the US DoE. 1
O. P. Karpenko, J. C. Billelo, and S. M. Yalisove, J. Appl. Phys. 76, 4610 ~1994!. 2 K. Holloway, K. B. Do, and R. Sinclair, J. Appl. Phys. 65, 474 ~1989!. 3 H. Kataoka, J. A. Batin, S. Brennan, and B. M. Clemens, J. Appl. Phys. 73, 7591 ~1993!. 4 T. Salditt, D. Lott, T. H. Metzger, J. Peisl, G. Vignaud, P. Hoghoj, O. Scharpf, P. Hinze, and R. Lauer, Phys. Rev. B 54, 5860 ~1996!. 5 R. M. Bradley, J. M. E. Harper, and D. A. Smith, J. Appl. Phys. 60, 4160 ~1986!. 6 K. G. Ressler, N. Sonnenberg, and M. Cima, J. Electron. Mater. 25, 35 ~1996!. 7 O. P. Karpenko, J. C. Bilello, and S. M. Yalisove, J. Appl. Phys. 82, 4397 ~1997!. 8 A. G. Dirks and H. J. Leamy, Thin Solid Films 47, 219 ~1977!. 9 A. Wucher and W. Reuter, J. Vac. Sci. Technol. A 6, 2316 ~1988!; also T. Tsuge and S. Esho, J. Appl. Phys. 52, 4391 ~1981!. 10 This sample was used as a standard for all AFM work done. The fact that the facet tops appear rounded ~as compared to the cross-section TEM! shows that the resolution of the AFM was limited due to imperfection of the probe tip. 11 If only ~110! out-of plane texture exists, these two scans should be identical. If, however, a ~111! out-of-plane texture exists, the ~110! f scans will be altered since ~111! and ~110! type crystallographic planes are coupled. 12 The data from the film deposited onto the MP substrate were collected when the synchrotron beam was well focused. The rest of the data have more uncertainty due to flawed x-ray optics. 13 G. S. Bales and A. Zangwill, J. Vac. Sci. Technol. A 9, 145 ~1991!. 14 T. C. Tisone and J. B. Bindell, J. Vac. Sci. Technol. 11, 519 ~1974!. 15 A. J. Dernoff and S. Lichter, Phys. Rev. B 39, 10560 ~1989!. 16 S. Lichter and J. Chen, Phys. Rev. Lett. 56, 1396 ~1986!.