The author was finalist of the Best Voted Poster at the British Machine Vision .... dedicated to the staff around Grupo de Procesado Digital de la Señal Laboratory, ...
Universidad de Las Palmas de Gran Canaria Instituto Universitario de Ciencias y Tecnologías Cibernéticas Doctorado en Cibernética y Telecomunicación
Synthetic Signature Generation for Automatic Signature Verification Generación de Firmas Sintéticas para Verificación Automática de Firmas Moisés Díaz Cabrera
Supervisor: Miguel A. Ferrer Ballester, PhD Supervisor: Aythami Morales Moreno, PhD
This dissertation is submitted for the degree of Doctor of Philosophy Las Palmas de Gran Canaria, Spain
September 2016
The author was awarded with a predoctoral contract for PhD Students from Universidad de Las Palmas de Gran Canaria in 2012. The author was finalist of the Best Voted Poster at the British Machine Vision Association (BMVA) Computer Vision Summer School 2013 for his poster entitled “Synthetic Off-line Signature Image Generation”, which is one of the initial works originated from this Dissertation. The author was awarded with a grant from European Cooperation in Science and Technology (COST) to attend the 11th International Summer Schools on Biometrics in Alghero, Italy in 2014. The author was awarded with a Honorable Mention at the Best Student Paper Award at the IEEE 14th International Conference on Frontiers in Handwritting Recognition (ICFHR) for one publication from this Dissertation: Moises Diaz-Cabrera, Miguel Ferrer and Aythami Morales Moreno, “Cognitive Inspired Model to Generate Duplicated Static Signature Images”, Proc. of IEEE ICFHR 2014 (Diaz-Cabrera et al., 2014a). Part of this work was awarded with the Best Student Paper Award at the IEEE 13th International Conference on Document Analysis and Recognition (ICDAR) for other publication from this Dissertation: Moises Diaz, Andreas Fischer, Rejean Plamondon and Miguel A. Ferrer. “Towards an Automatic On-Line Signature Verifier Using Only One Reference Per Signer”. Proc. of IEEE ICDAR 2015 (Diaz et al., 2015b). The author was awarded with a grant from International Association for Pattern Recognition (IAPR) to carry out a visiting research scholar at Università di Salerno, Italy in 2016.
To my three ladies: Grandma, mom & wife
Acknowledgements
“Listen to advice and accept instruction, and in the end you will be wise.” Pr.19:20 Firstly, I would like to thank God for providing me with all necessary - material and non material stuffs - to start and finish this memorable stage of my life. Probably, the most significant scientific award that I have received have been to be supervised by Prof. Miguel A. Ferrer. His special goodness, prudent recommendations, distinctive mental and moral qualities have been an unforgettable example to me. I would also like to thank to Dr. Aythami Morales, which helped to start this Thesis pursuing the excellence. I appreciate his patience and positive attitude to help me, specially at the very beginning when I was completely lost. During the development of this Thesis, I had the opportunity to travel around the world as a visiting research scholar. I had the honor to work under supervision of respectable and distinguish professors which I admire for their research career. I was overwhelmed by the friendliness received from Prof. Giuseppe Pirlo, specially when he picked me up at the airport. I was really glad for his modesty and humility above all else. I also thanks the funny moments with Dr. Donato Barbuzzi and his kind friends, who teach me by far the most “polite” words of their dialect as well as the impressive places in Apulia. I am grateful to Prof. Réjean Plamondon for hosting me at École Polytechnique de Montréal, Canada. I was surprised by his wise suggestion and intelligence, which can be quickly noted through his strong contributions to the community. I am aware of the relevant improvement of my reduced skills after working under his direction. However, I must admit that the secret of my research there was also due to Dr. Andreas Fischer. I also thank him to host me later in Fribourg, Switzerland, where I could conclude this fascinating Canadian-Swiss-Spanish research. I had the honor to meet Prof. Robert Sabourin from École de Technologie Supérieure, Université du Québec, in Montréal. I have to thanks him for motivating me despite my limited capacities, the really stimulating discussions at his office as the possibility to work alongside Dr. George Eskander.
viii I would like to express my gratitude to Prof. Umapada Pal from Indian Statistical Institute, in Kolkata. I really appreciate his invitation to his University where I opened my eyes regarding numerous aspects of the life. I thanks him to introduce me in the multi-script dimension of the handwriting analysis and pattern recognition. Thanks also are due to Dr. Sukalpa Chanda, Parikshit Acharya and the Sir who gave me cookies and tea every single day at 4.00 p.m. Another strong opportunity was working under the supervision of Prof. Angelo Marcelli, at Laboratorio di Computazione Naturale from University of Salerno. I appreciate his intelligence and experience to cope with challenging works. Also I thank to Dr. Antonio Parziale and his colleagues, who took good care of me to feel at home. I cannot forget Prof. Javier Sanchez-Medina, from Universidad de Las Palmas de Gran Canaria. I recognize his patience and friendly dedication on me in my first steps as researcher. Thanks to his motivation I decided to do my first visiting research scholar at University of Parma, Italy. There, I had the pleasure to receive valuable feedback from Dr. Pietro Cerri and Dr. Paolo Medici as well as Prof. Alberto Broggi, who host me to collaborate with his team. I also have to thanks the patience of Pedro Madero, Walter Serlenga, Marcello Mancarella, Giuliano Giannico, Francesco Scuccimarri and Sergio Pérez, all of them engineers, who I had the occasion to learn from them while I co-supervised their Bachelor Thesis. Also I have to thanks to Prof. Eduardo Hernández, and Prof. José Miguel Canino from Departamento de Señales y Comunicaciones for supporting with the necessary paperworks to develop my skills as university lecturer. I would like to acknowledge the guidance of Prof. Rafael Pérez, head of Institute para el Desarrollo Tecnológico y la Innovación en Comunicaciones (IDeTIC) in whatever university matter I needed. Special mention is dedicated to the staff around Grupo de Procesado Digital de la Señal Laboratory, specially to Cristina, Lidia, Jose, Celeste, Suni and Carlos for their gentleness and uncountable words of encouragement. Last but not least, I would like to express my gratitude to my family. I am really fortunate to have Omayra as my wife. I truly appreciate her respect as patience for my work. Her attitude regarding my work during the last years has been crucial to finish this period of my life. A special mention to my mother, brother and grandmother, who were always waiting for me to pop out as researcher. They were the first people who motivated me to do research. Also I am truly grateful to my father, I believe that he has helped me from the heaven at the same time that visualized all this process. Finally, I would like to thank you for your interest in this Thesis. I hope to be able to share with you my experience in synthetic handwriting signature generation.
Abstract
Learning to write is complex and usually starts with lines and scribbles. Before reaching a mature handwriting, children start to know the letters’ shapes and their sequence, although the children’s motor control is not yet accurate. Modeling this behavior in a mathematically way would allow to understand the mechanical processes from the initial thought of signing to its complete fulfillment. For instance, statistical models of a particular muscle could gain a better understanding of its general behavior when a stimulus is applied. The kinematical response of an executed movement is also a source of information about the human reaction. Indeed, these characteristics could be mathematically modeled according to the literature in order to design synthetically human movements. On the other hand, handwriting signature is used as a biometric trait to authenticate the user identity. However, the signature-based biometric systems are not used in practical applications due to their lower performance compared to other biometric technologies. Therefore, it is often preferred to use other traits such as iris, fingerprint or face. As a bridge between synthesis of biometric data and human modeling, innovative methods are addressed in this dissertation to generate synthetic handwriting signatures following the insights learnt from the motor equivalence theory. As such, in this Thesis several procedures are proposed to generate i) fully synthetic signature databases and ii) duplicated signatures from a single real specimen. The goal of the proposed methods is to verify whether the generated signatures are able to introduce realistic intra and inter-personal variability in signature-based biometric systems as well as to certify their human-like appearance. For these purposes, machine-oriented and human-oriented evaluations are discussed in the frameworks used in this document.
Table of contents List of figures
xv
List of tables 1
2
Introduction 1.1 Handwriting signature: a behavioral biometric trait 1.2 Emerging issues in automatic signature verification 1.3 Synthetic signature generation review . . . . . . . 1.3.1 Duplicated synthetic signature generation . 1.3.2 Full synthetic signature generation . . . . . 1.4 Observations on motor equivalence theory . . . . . 1.5 The Thesis . . . . . . . . . . . . . . . . . . . . . . 1.6 Outline . . . . . . . . . . . . . . . . . . . . . . . 1.7 Contributions . . . . . . . . . . . . . . . . . . . .
xvii
. . . . . . . . .
. . . . . . . . .
. . . . . . . . .
. . . . . . . . .
. . . . . . . . .
. . . . . . . . .
. . . . . . . . .
. . . . . . . . .
. . . . . . . . .
. . . . . . . . .
Morphology and lexical aspects in handwriting signatures 2.1 Introduction . . . . . . . . . . . . . . . . . . . . . . . . . . . . . . . 2.2 Basis of the study . . . . . . . . . . . . . . . . . . . . . . . . . . . . 2.2.1 Shape features . . . . . . . . . . . . . . . . . . . . . . . . . 2.2.2 Discrete features . . . . . . . . . . . . . . . . . . . . . . . . 2.2.3 Continuous features . . . . . . . . . . . . . . . . . . . . . . 2.2.4 Statistical similarities between probability density distribution 2.3 Results . . . . . . . . . . . . . . . . . . . . . . . . . . . . . . . . . . 2.3.1 Signature envelope . . . . . . . . . . . . . . . . . . . . . . . 2.3.2 Text lines morphology . . . . . . . . . . . . . . . . . . . . . 2.3.3 Flourish morphology distributions . . . . . . . . . . . . . . . 2.3.4 Some text-Flourish morphology dependencies . . . . . . . . . 2.4 Conclusion . . . . . . . . . . . . . . . . . . . . . . . . . . . . . . .
. . . . . . . . .
. . . . . . . . . . . .
. . . . . . . . .
. . . . . . . . . . . .
. . . . . . . . .
1 1 4 7 7 10 13 15 16 17
. . . . . . . . . . . .
19 19 20 21 21 21 22 23 23 25 29 30 34
xii 3
4
5
Table of contents Off-Line duplicated signature generation from on-line real samples 3.1 Introduction . . . . . . . . . . . . . . . . . . . . . . . . . . . . . . . . 3.2 Generation of Duplicated Signatures . . . . . . . . . . . . . . . . . . . 3.2.1 Component Segmentation . . . . . . . . . . . . . . . . . . . . 3.2.2 Perceptual point selection . . . . . . . . . . . . . . . . . . . . 3.2.3 Intra-component variability . . . . . . . . . . . . . . . . . . . 3.2.4 Inter-component variability . . . . . . . . . . . . . . . . . . . . 3.2.5 Ballistic trajectory reconstruction . . . . . . . . . . . . . . . . 3.2.6 Signature reconstruction and ink deposition model . . . . . . . 3.3 Model Validation . . . . . . . . . . . . . . . . . . . . . . . . . . . . . 3.3.1 Intra-personal variability evaluation of the duplicated signatures 3.4 Conclusions . . . . . . . . . . . . . . . . . . . . . . . . . . . . . . . . Off-Line duplicated signature generation from off-line real samples 4.1 Introduction . . . . . . . . . . . . . . . . . . . . . . . . . . . . . . . . 4.2 Generation of Duplicated Signatures . . . . . . . . . . . . . . . . . . . 4.2.1 Signature Segmentation . . . . . . . . . . . . . . . . . . . . . 4.2.2 Intra-component variability . . . . . . . . . . . . . . . . . . . 4.2.3 Component Labeling . . . . . . . . . . . . . . . . . . . . . . . 4.2.4 Inter-component variability . . . . . . . . . . . . . . . . . . . . 4.2.5 Signature inclination modification . . . . . . . . . . . . . . . . 4.3 Model validation . . . . . . . . . . . . . . . . . . . . . . . . . . . . . 4.3.1 Cognitive inspired duplicator set up . . . . . . . . . . . . . . . 4.3.2 Intra-personal variability evaluation of the duplicated signatures 4.4 Conclusion . . . . . . . . . . . . . . . . . . . . . . . . . . . . . . . . On-Line duplicated signature generation from on-line real samples 5.1 Introduction . . . . . . . . . . . . . . . . . . . . . . . . . . . . . . . . 5.2 Generation of duplicated signatures . . . . . . . . . . . . . . . . . . . 5.2.1 The sigma-lognormal model for signatures . . . . . . . . . . . 5.2.2 Method 1: Stroke-wise distortion method . . . . . . . . . . . . 5.2.3 Method 2: Target-wise distortion method . . . . . . . . . . . . 5.3 Model Validation . . . . . . . . . . . . . . . . . . . . . . . . . . . . . 5.3.1 Single reference signature system set up . . . . . . . . . . . . . 5.3.2 Visual Turing test validation . . . . . . . . . . . . . . . . . . . 5.3.3 Intra-personal variability evaluation of the duplicated signatures 5.4 Conclusion . . . . . . . . . . . . . . . . . . . . . . . . . . . . . . . .
. . . . . . . . . . .
. . . . . . . . . . .
. . . . . . . . . .
. . . . . . . . . . .
37 37 38 39 39 39 40 40 41 43 44 46
. . . . . . . . . . .
47 47 48 48 48 49 50 51 52 53 56 59
. . . . . . . . . .
61 61 62 62 64 66 67 68 70 72 73
xiii
Table of contents 6
7
Unified framework for fully synthesis of on-line and off-line signatures 6.1 Introduction . . . . . . . . . . . . . . . . . . . . . . . . . . . . . . . 6.2 Generation of fully synthetic signatures . . . . . . . . . . . . . . . . 6.2.1 The cognitive plan: signature engram . . . . . . . . . . . . . 6.2.2 Motor control: signature trajectory . . . . . . . . . . . . . . . 6.2.3 Signature dynamics . . . . . . . . . . . . . . . . . . . . . . . 6.3 Generation of duplicated signatures . . . . . . . . . . . . . . . . . . 6.4 Signature imitation . . . . . . . . . . . . . . . . . . . . . . . . . . . 6.5 Model validation . . . . . . . . . . . . . . . . . . . . . . . . . . . . 6.5.1 Unified synthesizer set up . . . . . . . . . . . . . . . . . . . 6.5.2 Visual Turing test validation . . . . . . . . . . . . . . . . . . 6.5.3 Similarity between real and their synthetic databases . . . . . 6.6 Conclusion . . . . . . . . . . . . . . . . . . . . . . . . . . . . . . .
. . . . . . . . . . . .
. . . . . . . . . . . .
. . . . . . . . . . . .
77 77 79 79 82 84 88 88 91 92 93 94 95
Conclusions and Future Works 99 7.1 Conclusions . . . . . . . . . . . . . . . . . . . . . . . . . . . . . . . . . . 99 7.2 Future Works . . . . . . . . . . . . . . . . . . . . . . . . . . . . . . . . . 102
Appendix A Performance metrics, Databases and Systems
105
Appendix B Summary in Spanish / Resumen en Español
111
References
163
List of figures 1.1 1.2 1.3 1.4 1.5 1.6 1.7
Overview of a typical signature-based biometric system . . . . . How many forgeries could you detect? . . . . . . . . . . . . . . Visual differences of the same real on-line and off-line signature Artificial generation of intra-personal variability . . . . . . . . . Visual representation of synthetic signatures . . . . . . . . . . . Overview of the equivalence motor theory . . . . . . . . . . . . Engram of the word “hello” on the hexagonal grid . . . . . . . .
. . . . . . .
. . . . . . .
. . . . . . .
. . . . . . .
. . . . . . .
. . . . . . .
2 3 4 10 12 14 16
2.1 2.2 2.3 2.4 2.5 2.6 2.7 2.8 2.9 2.10 2.11 2.12 2.13 2.14 2.15
Examples of particular lexical morphological features in a set of signatures. Averaged signature envelope . . . . . . . . . . . . . . . . . . . . . . . . . Skew (pdf) modeled by a GEV. . . . . . . . . . . . . . . . . . . . . . . . . Modeling the total letters per line (pdf). . . . . . . . . . . . . . . . . . . . Letter distribution in the first word for signatures written in one line. . . . . Letter distribution in the second word for signatures written in one line. . . Letter distribution in the third word for signatures written in one line. . . . . Letters per word distribution for signatures . . . . . . . . . . . . . . . . . . Slant model by Generalized Extreme Values (GEV). . . . . . . . . . . . . . Speed vs signature “fictitious” corners . . . . . . . . . . . . . . . . . . . . GEV modeling the corners distribution for the main flourish. . . . . . . . . GEV modeling the corners distribution for the secondary flourish. . . . . . Text and flourish (pdf) relations approached by GEV. . . . . . . . . . . . . Forged signature reproduction . . . . . . . . . . . . . . . . . . . . . . . . Probability of the different text-flourish structures . . . . . . . . . . . . . .
20 24 24 26 27 28 28 28 29 30 30 31 31 32 33
3.1 3.2 3.3 3.4
Diagram of the proposed cognitive-based protocol to duplicate signatures. Reconstructed component from trajectory plan . . . . . . . . . . . . . . . Ink deposition model . . . . . . . . . . . . . . . . . . . . . . . . . . . . Examples of multiple duplicated signatures . . . . . . . . . . . . . . . .
38 41 42 43
. . . .
xvi
List of figures 4.1 4.2 4.3 4.4 4.5 4.6 4.7 4.8
General overview of the off-line signature duplicator. . . Visual examples of intra-component variability . . . . . Visual examples of labeling in handwriting signatures . . Visual summery process to duplicate off-line signatures. Fine-tuning duplicator parameters . . . . . . . . . . . . Examples of multiple duplicated signatures . . . . . . . ROC plots for GPDS-300 . . . . . . . . . . . . . . . . . ROC plots for MCYT-75 . . . . . . . . . . . . . . . . .
. . . . . . . .
. . . . . . . .
. . . . . . . .
. . . . . . . .
. . . . . . . .
. . . . . . . .
. . . . . . . .
. . . . . . . .
. . . . . . . .
. . . . . . . .
48 49 50 52 53 55 57 60
5.1 5.2 5.3 5.4
Computation of the scale factor and rotation angle . . . . . . . . Appearance of the signatures as a function of distortion increase Visual Turing test subset . . . . . . . . . . . . . . . . . . . . . ROC curves using 3 verifiers and 6 databases. . . . . . . . . . .
. . . .
. . . .
. . . .
. . . .
. . . .
. . . .
67 70 71 74
6.1 6.2 6.3 6.4 6.5 6.6 6.7 6.8 6.9 6.10
Block diagram of the motor equivalence theory approach . . . . . . Pen-up model . . . . . . . . . . . . . . . . . . . . . . . . . . . . . Muscle activity in the handwriting . . . . . . . . . . . . . . . . . . Multi-level motor control model inspired by inverse internal models Synthetic dynamic version of the static signature of “Jane”. . . . . . Examples of dynamic signatures synthetically generated. . . . . . . Examples of intra-personal variability . . . . . . . . . . . . . . . . Signature imitation. . . . . . . . . . . . . . . . . . . . . . . . . . . Visual Turing test Subset. . . . . . . . . . . . . . . . . . . . . . . . DET Curves for all the experiments . . . . . . . . . . . . . . . . .
. . . . . . . . . .
. . . . . . . . . .
. . . . . . . . . .
. . . . . . . . . .
78 81 82 83 87 89 89 90 93 96
List of tables 1.1 1.2
Related works on duplicated signature generation . . . . . . . . . . . . . . Related works on fully synthetic signature generation . . . . . . . . . . . .
11 12
2.1 2.2
Text and flourish relationship in Western signatures . . . . . . . . . . . . . Analytical results from Generalized Extreme Value distributions. . . . . . .
33 35
3.1
EER results using off-line duplicated signatures . . . . . . . . . . . . . . .
45
4.1 4.2 4.3
Configuration of the off-line duplicator parameters. . . . . . . . . . . . . . Performance results for GPDS-300 database . . . . . . . . . . . . . . . . . Performance results for MCYT-75 database . . . . . . . . . . . . . . . . .
54 56 59
5.1 5.2 5.3 5.4
SUSIG-Visual EER (%) results; stroke-wise method . SUSIG-Visual EER (%) results; target-wise method . Visual Experiment Results . . . . . . . . . . . . . . EER (%) comprehensive evaluation . . . . . . . . .
. . . .
69 70 72 72
6.1 6.2
Visual Experiment Results . . . . . . . . . . . . . . . . . . . . . . . . . . Performance results for real and synthetic signatures . . . . . . . . . . . .
94 94
. . . .
. . . .
. . . .
. . . .
. . . .
. . . .
. . . .
. . . .
. . . .
. . . .
. . . .
Chapter 1 Introduction 1.1
Handwriting signature: a behavioral biometric trait
Learning to write is complex and usually starts with lines and scribbles. After reaching about three years of age, children begin to realize that writing is made up of lines, curves, and repeated patterns. About a year later, children begin to use letters in their own style. Usually, they start by experimenting with the letters of their own names, as they are the most familiar to them. Thus, they start to know the letters’ shapes and sequence, although the children’s motor control is not yet accurate. Children usually start their handwriting practice using printed worksheets. These help kids to trace the letters of the alphabet and to deal with numerals. These worksheets contain writing lines that guide the height, width and length of each letter in upper and lower case and of the numbers. The tracing helps the learning of each letter shape and writing sequence. The guide lines help the spatial relationships between objects thus creating the spatial memory or cognitive map. Once this knowledge is acquired, it is possible to select an ordered sequence of target points to perform fluent writing and signatures. At this stage, the person is ready to define and practice his or her signature. Linked to handwriting learning, the self-designed signature would depend on environmental and long term circumstances such as the signer’s personality, education, cultural environment, etc. plus the signer’s cognitive and motor skills. For centuries, the handwritten signature has been accepted world-wide for the purpose of authentication. Classical applications include the legal validation of documents such as contracts, last wills or testaments, corporative tax statements, financial transfers and so on. It has leaded to use the signature as a biometric trait in the context of computer systems and applications.
2
Introduction
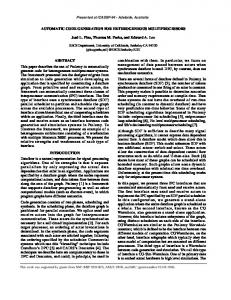
Fig. 1.1 Overview of a typical signature-based biometric system. Figure partially extracted from (Jain et al., 2016) Biometric recognition (Jain et al., 2016) is still in continuously growing. In our daily life, this technology is being more popular to access control, people identification, financial transactions, healthcare and so on. Despite the fact that the limited number of biometric traits, this technology is capable to offer greater security and convenience than traditional methods such as token-based (e.g. passports or ID cards) and knowledge-based (e.g. PINs or passwords) to ensure that the correct person is in this place at this moment. Some example of biometrics traits are the fingerprint, face, iris or voice, being the signature not successfully exploited in practical applications so far. A typical signature-based biometric system is illustrated in Figure 1.1. Once the user (Y) deposits the signature, a sensor digitalizes the sample. Later, a feature matrix (X) is built with the information extracted from the acquire sample. Then, the systems typically have two stages: enrollment (XE ) and recognition (XR ). The former builds a system database (D) where the users store their reference signatures as a set of templates, whereas the latter is used to recognize, identify or verify the identity of a user, who typically claim to be one of the enrolled users. Then, a score (S) is obtained according to the membership of the questioned sample to the claimed template. Finally, the system is supposed to accept or reject the questioned sample. One of the crucial challenge of a signature-based biometric system is the unpredictable intra-personal variability. It means the similarity between signatures executed by the same writer. Often, this variability is attributed to the several sources of noise (µ) that distort the measured trait. According to Figure 1.1, the intra-personal variability which affects to the measured sample (M) could be characterize by: sensor limitations like resolution or sample rate; biological aging effects or cognitive-motor impairments; user interaction with
1.1 Handwriting signature: a behavioral biometric trait
3
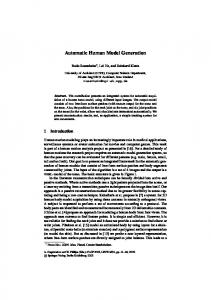
Fig. 1.2 How many forgeries could you detect?1 Figure extracted from (Morocho et al., 2016) the sensor; environment changes like background noise and; other factors as consequence of the individuals’ mood, hurry or willingness to cooperate. Another greatest challenge faced by signature-based biometric systems is the unpredictable inter-personal variability. It means the similarity between signatures executed by different writers. In a signature-based system, inter-personal variability is mainly attributed to ways for faking the identity of signers through two kind of forgeries2 . • Random Forgeries: They lead to a test applied in the situation in which an impostor, without previous knowledge of a specific signature, tries to verify the identity of a signer by using his own genuine signature. The random forgery test is a typical test used in access control and commercial transactions. • Skilled Forgeries: They lead to a test, which simulates the case where an impostor learns the signature of a signer and tries to reproduce it with a similar intra-class variability. This test is the most relevant in signature verification for its impact in forensic applications in signature forgery detection. Finally, as an example, Figure 1.2 illustrates the complication to distinguish visually genuine from non-genuine signatures. 1 Solution:
From left to right. Top: forgery, genuine, genuine, forgery; Center: forgery, genuine, forgery, forgery; Down: genuine, forgery, genuine, genuine. 2 In the literature there are different ways to mentioned the forgeries (e.g. random impostors, deliberate forgeries, deliberate impostors, highly skilled forgeries, etc). For the sake of simplicity, in this Thesis the terms random and skilled forgeries have been used.
4
Introduction
(a) Real on-line signature signals
(b) Real off-line signature image
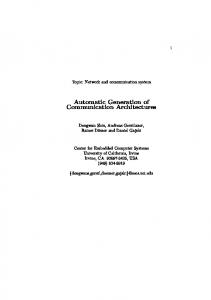
Fig. 1.3 Visual difference of the same real on-line and off-line signature. Figure extracted from (Galbally et al., 2015)
1.2
Emerging issues in automatic signature verification
Automatic Signature Verification (ASV) tends to focus on improving recognition accuracy, although topics such as interoperability, standards, scalability and template protection are also gaining attention. Well-established experimental protocols and benchmarks lead to this technology for a more statistically reliable performance evaluation. Indeed, several standards (ISO/IEC, 95 X), procedures (Mansfield and Wayman, 2002), databases (e.g. (Ferrer et al., 2012a; Frias-Martinez et al., 2006; Kholmatov and Yanikoglu, 2009; MartinezDiaz et al., 2014; Ortega-Garcia et al., 2003; Yeung et al., 2004)) and competitions (e.g. (Blankers et al., 2009; Blumenstein et al., 2010; Liwicki et al., 2012, 2011, 2010; Malik et al., 2015; Yeung et al., 2004)) have been developed for this purposes. Moreover, in this context, two kind of signatures are used in these ASV systems, which are illustrated in Figure 1.3: • Off-line signatures: Also named static signatures, they are the most traditional and the most frequent signatures around the world. The information is typically contained in a scanned image where the inked signature was deposited in a piece of paper through a tool like a pen or a feather, among others. • On-line signatures: Also named dynamic signatures, their main characteristic is that they contain the temporal and dynamic order in which the signer executed the signature. It allows to process an effective representation of the production order of the specimens. To register this kind of signatures, a device like a WACOM tablet is required. Probably, having this device available at any place is the main limitation of this kind of signatures.
1.2 Emerging issues in automatic signature verification
5
Research efforts in signature verification has been compiled in a number of publications and comprehensive surveys (Diaz-Cabrera et al., 2014c; Fairhurst, 1997; Fierrez and OrtegaGarcia, 2008; Hafemann et al., 2015; Impedovo et al., 2012; Leclerc and Plamondon, 1994; Plamondon and Lorette, 1989; Plamondon and Srihari, 2000) published in the literature during previous decades. Some of the new trends faced by researchers can be broken down into the following five topics. • Temporal drifting on automatic signature recognition: The signature, as a behavioral biometric, is sensible to long-term variations which can be related to multiple session acquisitions (Galbally et al., 2013), aging (Erbilek and Fairhurst, 2012) or neuromotor degenerations (O’Reilly and Plamondon, 2012), among others. The main effect of aging in signature processing applications is the degradation of intraclass variability. Hence, distinguishing between genuine and forged signatures is a rather complex. The literature about the effects of time on static handwritten signature recognition is scarce (Erbilek and Fairhurst, 2012). However, the evaluation of aging in handwriting can be analyzed to extrapolate conclusions. In (Drempt et al., 2011), researchers identify seven handwriting factors which are affected by aging: legibility, speed, pen grip, pressure, handwriting movements, styles and error corrections. All these factors influence the way a person sign and therefore the performance of automatic signature processing. Recent works study the relevance of aging in handwriting (Faundez-Zanuy et al., 2012) and dynamic signature (Erbilek and Fairhurst, 2012; Galbally et al., 2013) recognition. Therefore, the development of technologies for static signature recognition adaptable to aging effects is a research line to be explored. • Forger identification: Most automatic signature recognition systems try to answer this question: is this signature made by its real owner? In the case of a forged signature, this classification scheme avoids an obvious second question which is relevant for Forensic Handwriting Experts (FHE): who has forged the signature? The identification of forgers is a daily task for skilled forensics. However it has not attracted any noticeable role in the pattern recognition research community. In (Ferrer et al., 2012b), the researchers evaluate the probability density function of different recognition systems obtained from the forger’s signature, the forged signature and the original owner. Their results establish a baseline but do not allow the forger to be identified. Traditional automatic signature recognition systems are mainly based on the global aspect of the signature and the forensics techniques for forger identification. They are focused on local individual characteristics of the strokes or even the analysis of furrows made by
6
Introduction the writing tool on the paper. The development of automatic identification techniques based on these local features and its application to forger identification are open topics. • Disguised signature recognition: When a questioned signature is analyzed by a FHE, the analysis is done under the assumption of the prosecutor hypothesis (a certain signature was done by a suspected signer) and the defense trial (a certain signature was done by another different signer). Typically, they gives results in terms of Likelihood Ratio (LR). In the defense hypotheses there are two possible scenarios: i) the signature was made by a writer different from the original owner; ii) the signature was made by its original owner but it was disguised. Although FHE have faced this problem for a long time (Bird et al., 2010; Malik et al., 2013b) the development of an automatic recognition system of disguised signatures is an open challenge. The inclusion of a disguised signature in performance benchmarks is relatively new. As an example, eleven state-of-the-art systems were evaluated to detect disguised signatures during the last two Forensic signature verification competition 4NSigComp2010 and 4NSigComp2012. The results obtained during the second evaluation (Liwicki et al., 2012) clearly outperform the previous ones with EER under 30 %. A promising performance based on local descriptors was achieved in (Malik et al., 2013a) with a similar performance to the winners of 4NSigComp2012. This result encourages exploring deeply the feature approaches based on local information, as is proposed by FHE protocols. Again, this is an open challenge and the inclusion of disguised signatures will be more standard in future experimental benchmarks. • Multi-script3 signature recognition: The signatures are commonly composed of letters and/or flourish and the letters can be written using different scripts. Despite the large number of works dealing with the script-based text recognition and the static signature recognition, most of them study the isolate problem (Pal et al., 2011). Some open questions related to multiscript scenarios are: What is the influence of the script in the recognition accuracy? (Das et al., 2016) The performance of a system proposed for the script A will be the same for the script B? In (Pal et al., 2012) Bangla, Devanagari and Roman script signatures were evaluated by using signature recognition systems. The most common errors occur with the misclassification of Hindi and Devanagari signatures. The signature is a behavioral biometric trait and it can be influenced by cultural aspects. The analysis of the influence of multiethnic characteristics in the signature identification systems is another unexplored topic for automatic signature recognition systems. 3 The
set of letters or characters (i.e. symbols) used for writing a particular language is know as script.
1.3 Synthetic signature generation review
7
• Synthetic signature generation: Since this new trend has motivated this dissertation, it is extensively explained in the next section.
1.3
Synthetic signature generation review
Synthesizing a biometric trait is an opportunity to deepen and learn the biological processes that characterize a determined specimen. It is a crucial step in order to propose automatic systems capable to model the measured signals/images. In fact, models and methods to generate biometric samples have been recently proposed for various traits, such as fingerprint (Maltoni et al., 2009), face (Thian et al., 2003), iris (Zuo et al., 2007), speech (Dutoit, 2001), handwriting (Lin and Wan, 2007). In the handwriting signature context, among the number of advantages to synthesize signatures, some of the most relevant could be summarized as: i) it is effortless to produce a number of data (once the generation algorithm has been developed), ii) there is no size restriction (in terms of subjects and samples per subject) since it is automatically produced from a computer, iii) it is not subject to legal aspects because it does not comprise the data of any real user (Rejman-Greene, 2005), iv) it eliminates human mistakes such as labeling the data which bias the performance evaluation of the algorithms, v) it allows to carry out statistically meaningful evaluations of the performance, vi) it can simulate aging or maturity level models, vii) it could simulate signatures affected by some behavioral disorders, neurodegenerative diseases or other cognitive impairment and therefore, viii) it could be also a tremendous opportunity to analyze the deterioration and loss of function in the organs involved in the handwriting production. In line with synthesis of signatures, the tendency seems to be focused on either generation of duplicated signatures or generation of fully synthetic identities.
1.3.1
Duplicated synthetic signature generation
On the duplicated signature generation, it is advisable to refer to the intra-personal variability of the signatures, i.e. the difference between the repetitions of real genuine signatures. Its modeling allows the widening of the distinction between genuine and non-genuine signatures. The generation of duplicated specimens with realistic appearance helps in gaining a better understanding of signature execution from several neuroscientific perspectives. This also supports coherent decision making in psychology and forensic science and assists in optimizing speed and performance for indexing purposes.
8
Introduction
In the literature, many proposals are focused on modeling intra-personal variability for duplicating static or dynamic signatures (e.g. (de Oliveira et al., 1997; Fang et al., 2002; Ferrer et al., 2013b; Frias-Martinez et al., 2006; Galbally et al., 2009; Guest et al., 2014; Huang and Yan, 1997; Munich and Perona, 2003; Rabasse et al., 2007, 2008)). In this context, duplicating a signature means generating artificially a new specimen from a real or several real - signatures. Among its advantages, signature duplication can improve the training of ASV systems, allows the carrying out of statistically meaningful evaluations, enlarges the number of signatures in databases, can match the baseline performances for real signatures, which are often difficult to obtain, can improve the performances of existing automatic signature verifiers, can understand how the writer executed the signature and therefore explore any imparement or disorder. Specifically, it could be say that there are four methods to duplicate signatures: 1. Generation of dynamic (on-line) signatures from real on-line samples (On-2-On). Most of the recent advances in modeling intra-personal variability are focused on on-line signatures. For this category of signature capture, in (Rabasse et al., 2007) is studied that dynamic duplicated signatures performance is comparable to real signatures. We also can find how by applying random and affine deformations, it is possible to improve the performance of an HMM-based classifier (Galbally et al., 2009). In (Song and Sun, 2014) another method is studied for increasing the training set on the basis of a clonal selection of the enrolled signatures without modifying either the diversity of the overall set or the sparse feature distribution. Furthermore, the resultant set has been used for testing purposes in (Munich and Perona, 2003). 2. Static (off-line) signature generation by using real dynamic specimens (On-2Off). There are other proposals in the literature focused on the generation of signature images from on-line signatures (Ferrer et al., 2013b; Guest et al., 2014; Rabasse et al., 2008). The common tendency is to apply different methods to dynamic signatures since these record the kinematic and the timing order in which the traces were registered. Once a new trajectory is obtained, the samples of the new specimen are interpolated in order to create new images. Then, an off-line automatic classifier is used to assess the performance improvement. Parallel to this approach, a method of generating enhanced synthetic signatures images has been formulated using a novel architecture to improve the performance of dynamic verifiers (Galbally et al., 2015). 3. Production of signature images (off-line) from real static signatures (Off-2-Off). In the review of previous work, we have found proposals to duplicate from off-line to off-line signatures. One example is in (Frias-Martinez et al., 2006) where an off-line
1.3 Synthetic signature generation review
9
signature dataset composed of 6 genuine specimens per user and 38 signers is enlarged by applying affine transformations to the original signatures. Since the database contained only genuine signatures, this study was focused only on recognition. The authors did not include the deliberate forgery test. Although the authors enlarged the training set, the paper scarcely addressed either how the duplicated signatures were constructed or gave reference to the cognitive signing procedure. Similar target was studied in (de Oliveira et al., 1997), where the duplication procedure was carried out by convolution and affine produces from parameters obtained through polynomials and signals representations. In (Fang et al., 2002) an elastic matching of two static signatures is proposed. Then, the duplicates are obtained from the common areas described for such matching. Their results suggest the benefit of using duplicated samples to reduce the error rates. Following affine-based distortions to enlarge the reference set, in (Huang and Yan, 1997) the off-line signature verification results are again improved. 4. Generation of dynamic signatures from real static ones (Off-2-On). Regarding to recover the dynamic information from a static signature, to the best of our knowledge, is a topic that the scientific literature has not yet been examined in deep. Recovering the dynamic information of a signature refers to three stage: i) recovering the writing order from signature images, ii) component segmentation and stroke recovering4 from each component and iii) dynamic information deduced from each individual and stroke and their synergies among the rest of strokes produced in the handwriting. Nevertheless, some efforts in the literature have tried to address this Off-2-On conversion. However there are some approaches in the literature to reconstruct the signatures, such as using the real on-line information (e.g. (Nel et al., 2005)), studying some heuristic rules (e.g. (Lee and Pan, 1992)), the use of universal writing model to model the signature writing order (Lau, 2005), or signature stroke estimation (e.g. (Lau et al., 2002)), among others. Despite these genuine approaches, similar to On-2-On, Off2-Off and On-2-Off, in on-line signature verification the Off-2-On goal requires to achieve a comparable performance to a real on-line signature verification. Thus, it assumes that the real on-line information is not used or unknown. Contrary to handwriting, signatures are often composed of a number of strokes which are overlapped with previous written strokes. It creates several ambiguous detection 4 For
the sake of clarification, stroke is used in this thesis to describe a neuromuscular command to execute an elementary movement, which can be observed in the velocity profile as the piece of signal between two minimums. Similarly, the term component is used to describe the segments between pen-down and pen-up, which is usually composed of several strokes (Plamondon and Maarse, 1989).
10
Introduction
Fig. 1.4 Artificial generation of intra-personal variability. The first subplot shows two real signatures (in red and blue) used to generate artificially the rest specimens (in gray). Some sources of artificial intra-personal variability attributed to: 1) connected or non connected letters; 2) close or open loops; 3) variability in the loop shapes (elongated vs rounded); 4) stroke length variability. Figure extracted from (Rabasse et al., 2008) zones obtaining neither the real writing order nor the real stroke segmentation in the majority of the cases. However, some of the techniques and approaches studied in (Nguyen and Blumenstein, 2010) would deserve to take into account for a full Off-2-On process. In order to organize the current literature in duplicated generation of signatures, Table 1.1 summarizes schematically the state-of-the-art in duplicated signature generation. A visual example about artificial generation of intra-personal variability is illustrated in Figure 1.4.
1.3.2
Full synthetic signature generation
On the full synthetic signature generation, algorithms start without any real signature as reference. In this modality, often algorithms define a new identity in first term. Then, the algorithms should be able to generate possible signatures executed by such a virtual identity. In other words, it should be said that these possible signatures are required to produce realistic intra-personal variability. For this purpose, the algorithms need to be adapted in order to simulate real dissimilarity conditions between two specimens executed by the same signer. On the other hand, one of the use of these synthetic databases is to test the systems in order to create common benchmarks with meaningful statistical results. For this purposes, synthetic forgery generation should be also taken into account in the synthetic signature generators. Additionally, the signature generation is also dependent of the script that we are trying to reproduce. This way, it is probably that some rules and logics need to be modified in order to simulate realistic effects in each script, with special attention to the peculiarities in the languages. For instances, Western signatures are typically composed of text and flourishes; Chinese or Japanese signatures are designed with symbols and so on. One of the first works on synthetic signature generation can be attributed to Western script. Specifically, in (Popel, 2007) is described a model to generate dynamic signatures based on
1.3 Synthetic signature generation review
11
Table 1.1 Related works on duplicated signature generation Conversion Authors Methods Seed1 Target On-2-On Munich et al., Affine>1 Statistically meaningful 2003 (Munich scale/geometrical Sign. evaluation and Perona, transformations 2003) On-2-On Rabasse et al., Affine2 Sign. Approaching the base2007 (Rabasse scale/geometrical line performance et al., 2007) transformations On-2-On Galbally et al., Affine1 Sign. Improve the perfor2009 (Galbally scale/geometrical mance et al., 2009) transformations On-2-On Song et al., Clonal Selection Algo- >1 Improve the perfor2014 (Song and rithm Sign. mance Sun, 2014) On-2-Off Rabasse et al., Affine2 Sign. Approaching the base2008 (Rabasse scale/geometrical line performance et al., 2008) transformations On-2-Off Guest et al., Interpolation methods 1 Sign. Approaching the base2014 (Guest et al., line performance 2014) On-2-Off Galbally et al., Ink Deposition Model 1 Sign. Approaching the base2015 (Galbally line performance et al., 2015) Off-2-Off Oliveira et al., Convolution produces 1 Sign. Enlarge database 1997 (de Oliveira from polynomials and et al., 1997) signals representation Off-2-Off Huang et al., Affine1 Sign. Improve the perfor1997 (Huang and scale/geometrical mance Yan, 1997) transformations Off-2-Off Fang et al., Elastic matching 2 Sign. Improve the perfor2002 (Fang et al., method mance 2002) Off-2-Off Frias et al., Affine1 Sign. Enlarge database 2006 (Frias- scale/geometrical Martinez et al., transformations 2006) Off-2-On Open Issue Seed refers to the number of necessary signatures to carry out each conversion
12
Introduction Table 1.2 Related works on fully synthetic signature generation
Modality
Authors
Methods
Script
On-line
Popel, 2007 (Popel, 2007) Galbally et al., 2012 (Galbally et al., 2012a,b)
Visual characteristics extracted from the time domain Spectral analysis and the kinematic theory of rapid human movements
Flourish-based Western
On-line
Flourish-based Western
Kind of signatures Genuine
Genuine
Fig. 1.5 Visual representation of synthetic signatures, being real signatures highlighted in gray. Subset extracted from (Galbally et al., 2012a,b) visual characteristics extracted from the time domain. In this case, flourishes were generated, which are close to Western script style. After a visual validation, no clear quantitative results are given. In (Galbally et al., 2012a,b) the full generation of on-line flourish-based signatures was carried out through two algorithms based on spectral analysis and the kinematic theory of rapid human movements. Apart from visual validation, quantitative evaluations were carried out mainly in terms of comparative performance with real databases. An overview of perceptual results is illustrated in Figures 1.5. Also some quantitative characteristics are given in Table 1.2.
1.4 Observations on motor equivalence theory
1.4
13
Observations on motor equivalence theory
Most methods both to synthesize and duplicate signatures, reported in the literature (Section 1.3), cover geometrical and affine deformations. The capacity of these kind of deformations have been proven. However, this thesis makes the following question: Because of the fact that the execution of a signature implies the activation of a complex human system, will we be able to propose robust systems to synthesize and duplicate signatures by designing algorithms based on human behavior? To this aim, the motor equivalence theory is used. It is well known that the signing procedure involves a high complex fine motor control system to generate the signature trajectory with over-learned movements. This procedure could be described by the motor equivalence theory which define the personal ability to perform the same movement pattern by different effectors. It is attributed that the motor equivalence theory was formulated around the middle of the last century by Lashley (Lashley, 1930), then Hebb (Hebb, 1949) and later Bernstein (Bernstein, 1967). Briefly, this theory studies the central nervous system (CNS) activity, which controls posture, movement and it is focused on kinematic properties from a muscular-skeletal point of view. The motor equivalence theory (Marcelli et al., 2013; Wing, 2000) suggests that the brain stores movements, aimed at performing a single task, in two ways: i) Effector independent: In an abstract form, it means the spatial position of each trajectory points of each individual stroke, which represent the trajectory plan, and the relative position among them. The parietal cortex in general, and the posterior parietal cortex and the occipitotemporal junction in particular, are suggested in (Marcelli et al., 2013) as the most important brain regions for representation of the action plan. Being the basal ganglia involved in the learning process of the target points. ii) Effector dependent: As a sequence of motor commands directed to obtain particular muscular contractions and articulatory movements. It is supposed that the motor cortex interacts with the cerebellum in order to select the target points and the set of motor commands to execute the movement. A scheme of this procedure is illustrated in Figure 1.6. Although both the effector independent and the effector dependent are pretty stables, they have a certain degree of variability and they are affected by external inputs and dissonant psychological states. In fact, under pressure, an individual usually needs to remember his/her signature before signing producing a signature with a large intra-personal variability. Similar distortion in the intra-personal variability could happen with other psychiatric diseases and aging. The muscular path changes due to pose, health, etc., affecting to the signature variability.
14
Introduction
Fig. 1.6 Equivalence motor theory overview. Figure extracted from (Marcelli et al., 2013) Both effects are correlated. For instance, the signature parts with a denser effector dependent grid will convey a low speed for motor apparatus following such a trajectory. For this reason, the dynamic information could be used to adjust the motor apparatus inertial and should be available to validate the usefulness of the proposed models. In (Kawato, 1999) it is suggested that fast and coordinated movements cannot be executed solely under feedback control since biological feedback is slow. Thus (Kawato, 1999) proposes that the brain needs to acquire an inverse model of the object to be controlled by motor learning. Focusing on the internal inverse model of the limbs created by the cerebellum, (Kawato, 1999) calculates the motor commands which compensate for the arm’s dynamics. Therefore, in the human development stage, early handwriting actions are highly demanding of attention, slow to execute, clumsy and not particularly accurate. After long-term practice, the movements become quick, smooth, automatic, and can be performed effortlessly, using minimal cognitive resources. Applying the equivalence model to handwriting, the action plan may be represented in terms of strokes which are encoded in terms of relative positions and spatial directions. Once the movement has been planned, the motor control delivers the commands to specific muscles to produce the handwriting. Finally, it is possible that an algorithmic description of the motor equivalence theory would allow to duplicate and synthesize signatures. Moreover, it could fill the gap between heuristic methods used in the literature and human-like methods for inter- and intra-personal variability modeling. It is the aim of this dissertation.
1.5 The Thesis
1.5
15
The Thesis
This dissertation defend the following hypothesis: The generation of synthetic handwriting signatures for biometric purposes can be modeled by inspiration of the motor equivalence theory. This statement is developed through two actions: 1) Generation of new identities so as to model the inter-personal variability and 2) Generation of duplicated signatures from a specimen so as to model the intra-personal variability. The goal of this Thesis is to design algorithms to generate both synthetic and duplicates signatures inspired by motor equivalence theory perspectives. Contrary to the models proposed in the literature, the models proposed in this thesis are designed under the perspectives analyzed in the previous section. These perspectives are useful to approach the generation of a signature. The signatures considered in this Dissertation uses Latin alphabet. Therefore, a previous study of the morphology and lexical characteristic of Western signatures would throw light on their common distributions. Then, the approach proposed has two main stages: a cognitive stage (related to the effector-independent) and a neuromotor stage (related to the effector-dependent). On the cognitive stage, the algorithms are inspired by experiments made by (Hafting et al., 2005). They showed that the dorsocaudal medial entorhinal cortex (DMEC) contains a directionally oriented, topographically organized neural map of the spatial environment. Its key unit is the grid cell which is activated whenever the person’s position coincides with any vertex of a regular grid of equilateral triangles spanning the surface of the environment. In (Hafting et al., 2005) it is suggested that a place code is computed in the entorhinal cortex and fed into the hippocampus, which may make the associations between place and events that are needed for the formation of memories. Inspired by this idea, the signature engram (target points) is defined as a sequence of nodes through a hexagonal grid that spans the signing surface. The hexagonal grid is defined by the distance between rows and columns. An example of this approach to mimic how the word “hello” is stored in the memory is presented in Figure 1.7. It shows its engram, which is connected by straight lines. On the neuromotor stage, the target is to generate human-like trajectories. The approach followed in this thesis consists of filtering the straights lines used to connect the engram. It should be noted that handwriting movement has different biological rhythms. It is highlighted during the rapid execution of a flourish versus a more fine control when individuals write
16
Introduction
Fig. 1.7 Engram of the word “hello” on the hexagonal grid their names. Therefore, the filters used to design the realistic ballistic trajectories would be taken into account the group of muscles involved in the production of a signature. One essential aspect is the the intra-personal variability between specimens generated by the same writer. Such intra-personal variability can be achieved by a realistic distortion of the grid as well as the engram. Also, the filters would be an appropriate source of intra-personal variability. Furthermore, an additional contribution in favour of this Thesis against other proposals is that all proposed methods to generate artificial intra-personal variability require only one signature as seed. To evaluate the closeness of synthetic signatures with respect to real signatures, both machine-oriented and human-oriented validations are carried out. On the one hand, stateof-the-art automatic signature verifiers are used with publicly available signature databases and our synthetic specimens. It is expected that similar results will be obtained with both kind of signatures. Moreover, the use of duplicated signatures in the enrollment set is evaluated by analyzing improvements in the performance. On the other hand, the perception of the synthetic signatures is evaluated through visual Turing tests. These tests have been completed by non-forensic volunteers which have measured the confusion to identify human and machine generated signatures. Obviously, the fact that this Thesis has been developed using neuroscience concepts does not mean that it claims any fidelity to cognitive and neuromotor processes underlying signature production.
1.6
Outline
The chapters in this dissertation are organizes as follows:
1.7 Contributions
17
• Chapter 1 includes an overview of the handwriting signatures as a biometric trait as well as a revision of different methods to synthesize signatures. Additionally, an explanation of this Thesis under motor equivalence theory perspectives is given. • Chapter 2 is dedicated to study the lexical and morphology characteristics of the signatures in order to a better understanding of their inter- and intra-personal variability of the signatures. • Chapter 3 addresses an off-line duplication procedure from real on-line signatures. This is the first contribution of this dissertation dedicated to generate off-line duplicated signatures inspired on equivalence motor theory. • Chapter 4 describes a method for off-line duplicated signature generation from real off-line signatures. Once again, the method has been inspired on motor equivalence theory ideas. • Chapter 5 proposes two methods to generate duplicated on-line signatures from real on-line specimens. In this case, the kinematic theory of rapid movements was chosen as the core of both procedures. • Chapter 6 suggests a unified framework to generate fully synthetic on-line and off-line signatures simultaneously. In this case, machine and human closeness between real and synthetic signatures is analyzed. • Chapter 7 closes this dissertation drawing the main conclusions as some future work ideas.
1.7
Contributions
As results of this thesis, several research contributions have been published in peer-reviewed international conferences and ISI - JCR journals. • Chapter 1: Introduction 1 chapter in an international book: (Diaz-Cabrera et al., 2014c). • Chapter 3: Morphology and lexical aspects in handwriting signatures 1 paper in a journal included in the JCR: (Diaz-Cabrera et al., 2015).
18
Introduction • Chapter 4: Off-Line duplicated signature generation from on-line real samples (On-2-Off) 4 papers in an international conferences with a Best Student Paper Award: (DiazCabrera et al., 2014a,b; Ferrer et al., 2013b; Galbally et al., 2015) • Chapter 5: Off-Line duplicated signature generation from off-line real samples (Off-2-Off) 1 paper in a journal included in the JCR: (Diaz et al., 2016). • Chapter 6: On-Line duplicated signature generation from on-line real samples (On-2-On) 1 paper in an international conference Best Student Paper Award: (Diaz et al., 2015b) • Chapter 7: Unified framework for fully synthesis of on-line and off-line signatures 2 papers in journals included in the JCR + 1 paper in an international conference: (Ferrer et al., 2016, 2013a, 2015)
Other research contributions related to handwriting automatic signature verification field are listed as well: • Handwriting signature verification 1 submitted patent + 1 JCR paper + 1 conference paper 1. Submitted patent for questioned signatures verification (Diaz and Ferrer, 2016) 2. Novel method based on dynamic stability analysis (Pirlo et al., 2015a) 3. Score normalization for dynamic signature verification (Fischer et al., 2015) • Novel trends 1 JCR paper + 2 conference paper 1. Multi-script study in signature verification (Das et al., 2016) 2. Medical diagnosing in neurodegenerative signatures (Pirlo et al., 2015b) 3. Stability analysis of reference signature images for performance prediction (Diaz et al., 2015a)
Chapter 2 Morphology and lexical aspects in handwriting signatures 2.1
Introduction
In this chapter it is studied the lexical morphology of Western signatures. This is understood as the identification of the most stable signature features, their analysis, and the description of the signature structures and other factors such as the presence of an decorated flourish, the number of words and letters, their distribution, the relation between them and so on. Such lexical morphology depends on the signer and his or her behavior and how they learned to sign. In Western signatures some particular features can be found to define the lexical morphology, for instance, signatures with one or two flourishes or no flourish; different numbers of words distributed into one, two or even three lines; capital letters sometimes followed by a full-stop; internal features such as the skew or slant; letters of different sizes against the constant size of other letters, as well as a combination of capital and non-capital letters. Figure 2.1 shows some of these particular and fairly common features. This chapter is fundamental in this Thesis since the rest of chapters will use some of the morphological and lexical distribution obtained here. Such distributions will help to synthesize the signature. In fact, the more parameters we rely on, the more knowledge of the signatures we can achieve and therefore move towards a deeper understanding of the common and divergent features of the signatures for a particular culture. To the best of our knowledge, the number of works analyzing the lexical morphology of signatures is few. In this chapter we develop a study of the most relevant features of the Western signature lexical morphology. The identified features were statistical modeled by counting the data in several public signature databases collected in several European
20
Morphology and lexical aspects in handwriting signatures
Fig. 2.1 Examples of particular lexical morphological features in a set of signatures. countries to take into account different Western signing styles. As result, a unified framework is obtained for establishing the statistical normality of a signature’s lexical morphology. This framework characterizes how the signers design their signatures and is of interest for this Thesis and to different disciplines and applications such as forensic, graphology, indexing, etc.
2.2
Basis of the study
In this study, five public databases are used. To study the dependence of the lexical and morphological features as a function of the donors’ geographical area, they are studied according to their geographical regions. In this way and sorted by the occidental country where they were collected, in DB1 it is included the GPDS-881 (Blumenstein et al., 2010; Ferrer et al., 2012a) and MCYT-75 (Fierrez-Aguilar et al., 2004; Ortega-Garcia et al., 2003) databases; in DB2 is included NISDCC database (Alewijnse et al., 2009; Blankers et al., 2009), in DB3 the SUSIG-Visual and SUSIG-Blind sub-corpus (Kholmatov and Yanikoglu, 2009); and in DB4 the SVC-Task1 and SVC-Task2 databases (Yeung et al., 2004). Summing up the five datasets, the lexical morphological features have been extracted from 881 + 330 + 100 + 94 + 88 + 40 = 1533 different signers. For more details on these database, the reader could be referred to annex A. Then, to study their lexical and morphological features, they were divided into three categories: shape features (e. g. the signature envelope); discrete features (e.g. the number of words per line); and continuous features (e.g. the signature skew or slope).
21
2.2 Basis of the study
2.2.1
Shape features
In the case of the signature envelope, this is modeled by means of Point Distribution Models (PDMs) or the Active Shape Model (ASM) and consists of a mean signature shape and a number of eigenvectors to describe the main modes of variation of the shape (Cootes et al., 1995). The ASM is built as follows: Using N different signatures, each is converted into black and white by means of Otsu’s threshold and the salt and pepper noise is removed. Each image is morphologically dilated with a square structuring element. The envelope is the contour of the dilated signature. All the contours are aligned by moving their geometrical center to the coordinate origin. From each contour we select n equidistant points called landmarks so as to obtain the vector xs = {x1s , x2s , . . . , xns , ys1 , ys2 , . . . , ysn }, where (xis , ysi ) are the coordinates of the ith landmark of the sth contour. The first landmark (x1s , ys1 ) is the one that satisfies ys1 = 0 s and x1s > 0. The average envelope is calculated as: x¯ = 1/N ∑N i=1 x . The ASM captures the statistical features assuming that the point cloud xs , s = 1, . . . , N is a 2n dimensional ellipsoid which is obtained by applying principal component analysis (PCA). The 2n × 2n covariance matrix is calculated as: S=
1 N s ¯ s − x) ¯T ∑ (x − x)(x N s=1
(2.1)
The principal axes of the ellipsoid are described by the eigenvectors pk , k = 1, . . . , 2n of S and the length of its axis is related to the eigenvalues λk ≥ λk+1 , k = 1, . . . , 2n.
2.2.2
Discrete features
In the case of features with discrete values, the number of occurrences of each feature was manually counted for the databases to compute their occurrence probability. Each feature was validated from about 200 signatures extracted from the databases. Let X = {xi }Li=1 be the L available values of a given feature of M possible values. The occurrence probability of each value is worked out as p(xi ) = #{xi ∈ X}/L, # meaning the number of times.
2.2.3
Continuous features
In the case of features with continuous values, e.g. the skew, the values of such a feature was manually obtained using the databases and their probability density function (pdf) estimated by the histogram non-parametric method (Bishop, 2006). Let {xi }Li=1 be the L available values of the given feature such that the range of this variable, range(x) = max(x) − min(x).
22
Morphology and lexical aspects in handwriting signatures
This is divided into M intervals or bins of width h, which is chosen to obtain a number of intervals M = range(x)/h around L/50 to obtain a good statistical significance for each bin. The histogram is worked out as: hist(n) = #{x ∈ binn} 1 ≤ n ≤ M. To generalize the estimated histogram, it is smoothed for each bin using a 3-point moving average filter as follows: shist(n) = pdfi = mediann−1≤l≤n+1 {hist(l)}, and the density is estimated as p(x | x ∈ binn) = shist(n)/L × h. When M > 4, a parametric procedure is also applied to estimate a further probability density function. This parametric procedure relies on the Generalized Extreme Value (GEV) distribution (Kotz and Nadarajah, 2000) which is used to generalize the human signature variability response. The GEV probability density distribution f (x; µ, σ , ξ ) has the following prescription: f (x; µ, σ , ξ ) =
1 t(x)ξ +1 e−t(x) σ
(2.2)
where 1 + ( x−µ )ξ �−1/ξ σ t(x) = e−(x−µ)/σ
if ξ ̸= 0
(2.3)
if ξ = 0
with x bounded by µ + σ /ξ from above if ξ > 0 and from below if ξ < 0. The symbols µ, σ and ξ represent the location, scale and shape distribution parameters.
2.2.4
Statistical similarities between probability density distribution
Some of the studied parameters share common information, independently of the database analyzed. The statistical similarity of the probability density distribution of one parameter for one database comparing with the others is also analyzed. Such statistical similarity analysis is performed through two-sample Kolmogorov-Smirnov test (KS) (Marsaglia et al., 2003). This method allows us to cluster some single features from a database. For graphical representation only, we have clustered the results when the feature is statistically similar between the databases. This non-parametric test evaluates the degree of similarity between two probability density functions. The null hypothesis H0 of the test means that two data distributions are from the same distribution. The alternative hypotheses H1 means that two data distributions are different. In our implementation, the significance level chosen is 5 %. To accept the null hypothesis, the asymptotic p-value is calculated, which should be as near to 1 as possible. Such a p-value represents the probability that the null hypothesis is true by observing the extreme test under the null hypothesis.
2.3 Results
2.3
23
Results
Thousands of features can be obtained from a signature to model its lexical morphology. In this section the lexical morphological features considered most relevant, i.e. descriptive and common, are described alongside their estimated pdfs. They are presented in a top-down process, starting from global feature characterization and finishing with specific details in the signature.
2.3.1
Signature envelope
The envelope of the signature is a fictitious shape which encloses each deposited signature. Each signature has its own specific envelope. In this study we have analyzed the average envelope of the signatures per databases by using the Active Shape Model (ASM). This method uses the images from off-line signatures to compute their contour. As DB3 and DB4 are composed of dynamic signatures, they were converted into images by interpolating the spatial sequences and fixing the resolution at 600 dpi in all datasets. The envelope of each individual signature was smoothed through a morphological operation which was performed 3 times over each signature and also using 9 components as square structuring elements. Finally, to obtain an average signature envelope for each database, 320 equidistant landmarks were selected per image-based signature in this particular implementation. The average envelopes for the Western databases are shown at Figure 2.2. In the Figure, it is highlighted the ellipses of 4 equidistant landmarks for each average envelope, according to the equation (2.1). We can see their overall elliptical shape in all cases, which is characteristic of signatures with large text, written in a single line and with a flourish. Also we could observe how the right part of the signature is usually smaller than the left part. This is also a characteristic of Western signatures, where the initial part appears slightly bigger on average. Additionally, we can observe that the average envelope for DB1 is more rounded than the others, thus showing the stronger influence of more elaborate flourishes in this dataset. The shape of the signatures can be ascendant, descendent or longitudinal. This particular feature is measured through the skew angle, which indicates the inclination of the shape of the signature. The angle of the skew is measured in degrees and the third image in Figure 2.1 illustrates how it is defined. The skew distribution was calculated for the four databases. From the Kolmogorov-Smirnov approach, the skew distribution is similar for the all considered datasets, and is modeled in Figure 2.3. This figure indicates that the normal skew value is near to zero degrees. Also it is shown that the skew in the signatures is more often ascendant than descendent.
24
Morphology and lexical aspects in handwriting signatures
Fig. 2.2 Averaged signature envelope: Black dots illustrates a reduced set of cloud points from individual signatures; Green lines show the 4 clusters to select a landmark per cluster; Red lines show the final average shapes of the signatures by using 320 landmarks.
Fig. 2.3 Skew (pdf) modeled by a GEV.
2.3 Results
2.3.2
25
Text lines morphology
Western signatures are generally composed of text, which is sometimes difficult to read because of the signing speed, plus a flourish. The text in the Western signature defines the personal identity of the signer which reflects the name, the family name or just a combination of initial letters. The flourish or rubric in the occidental signatures is defined by a kind of doodle written much faster and often rather careless. It sometimes contains personal information as an almost illegible initial. Certainly, this feature is strongly dependent on the personal name of the signer. However, the analyses of this feature highlight some findings about how people decide to show their signature in different geographical areas. We could observe that in certain areas people write their full name and surname thus using a large number of letters and words in their signatures. Also we can observe that other regions prefer to use fewer letters to identify their personal signature. All of these peculiarities are analyzed in this section. The signatures with text and flourish are the most common and are estimated to comprise 86.6 % of the total of Western signatures in the DB1; 50.0 % in the DB2 and; 53.5 % for the DB3. However, in the DB4 the value is just 10.0 %, probably because the donors are not used to signing in native Western styles. Signatures with either only a text name or only a flourish are found in proportions 5.1 % and 8.3 % respectively for the DB1; 33.3 % and 16.7 % for the DB2; 37.7 % and 8.8 % for the DB3 and; 90.0 % and 0.0 % for the DB4. According to the learning process, people in general use their own criteria to decide the number of lines and words in their signatures. The word distribution presented in the signatures has been counted. We find that in signatures with text, the dataset DB1, 90 % are written in one line whilst for the remaining 10 % it is two. For the 10 %, the second line is often below the first and is usually shorter than first line and starts at about 20 % of the signature length toward the right side. The rest of datasets contain all signatures drawn in one line. For those signatures written in one line, the proportion with one, two or three words is 50.0 %, 36.0 % and 14.0 % respectively for the dataset DB1; 64.7 %, 27.5 % and 7.8 for DB2; 77.7 % and 22.3 % for DB3; and 92.5 %, 7.5 % for DB4. These two latter datasets do not contain signatures with three words. We are aware that the total number of words and letters per word depend on personal choice, influenced by the original name and surname. However, we note the influence of two surnames in the Spanish culture, since some signers include both. For signatures depicted in two lines, which applies only to BD1, the proportion is as follows:
26
Morphology and lexical aspects in handwriting signatures
Fig. 2.4 Modeling the total letters per line (pdf). • In the first line one, two and three words appear respectively at 55.0 %, 37.0 % and 8.0 %. • In the second line, 71.0 %, 21.0 % and 8.0 % of the signatures have respectively one, two and three words. For the number of letters per line, two types have been differentiated: type one is related to signatures with one line (line 1) and type two related to signatures with two lines (line 2-1 refers to first line of a signature with two lines and line 2-2 to the second line). Type one is found in all datasets, whereas type two is a feature only of DB1. The parametric and actual number of letter distributions are displayed at Figure 2.4. For the type one, the KS test suggests that DB1 and DB2 are similar among themselves. This is also true of DB3 and DB4. Such a difference was also observed during the analyses of the Western and central Western signatures because their donors usually write the full name or larger names than the other style. However, it can be seen that the model of all the datasets is 5 to 6 letters per signature, independently of the number of lines and the styles. The parameters of the parametric GEV distribution can be seen at Table 2.2. Regarding the number of letters per word, we have differentiated the signatures written in one line (all databases) and the signatures written in two (DB1). Firstly, the non-parametric distribution for the signatures written in one line are shown according to the distribution of
2.3 Results
27
Fig. 2.5 Letter distribution in the first word for signatures written in one line. letters in the first word (Figure 2.5), the second (Figure 2.6) and the third one (Figure 2.7). It is observed that DB3 and DB4 are datasets whose maximum number of words is two. Once again, the Kolmogorov-Smirnov test determined the more suitable clustering representation for these feature in all databases. Secondly, the number of letters in signatures with two lines from DB1 is analyzed in Figure 2.8. The inferred densities present a bimodal behavior basically due to the presence of text based on names or surnames as initials whose probability is proportional to the number of words. When the first symbol is an upper case initial, 60.0 % of the signers write a full-stop after such an initial. However, these signers do not keep such behavior constant. The probability that all of a signer’s signatures retain the full-stop after the initial signing is estimated to be 73.0 %. Similarly, the connectivity between letters in a word is not constant in signer behavior. We have found that, as an average, signers connect 59 % of the characters in their signature. Additionally, some people write their signatures with more rightward angle than their basic handwriting. Such an angle is called slant and it is measured in degrees. An example of how it is defined can be found in the eighth signature in Figure 2.1. Although the majority of text in the signatures appears fairly level, without a tilt, we perceive that there is a major tendency for right-slanted signature than left-slanted one, i.e., people tend to write in cursive style at a slight angle, away from the vertical, according to the estimated distribution in
28
Morphology and lexical aspects in handwriting signatures
Fig. 2.6 Letter distribution in the second word for signatures written in one line.
Fig. 2.7 Letter distribution in the third word for signatures written in one line.
Fig. 2.8 Letters per word distribution for signatures with two lines of up to three words. Left: first line of a signature. Right: second line of a signature.
29
2.3 Results
Fig. 2.9 Slant model by Generalized Extreme Values (GEV). Figure 2.9. he statistical test estimated that the parametric distribution of slant is quite common in all databases. Such parametric values are given at Table 2.2.
2.3.3
Flourish morphology distributions
The flourish is the part that usually introduces higher inter-personal variability in the signature. Several lexical morphological characteristics can be determined from the flourish, namely the number of flourishes and their relation with the text. To characterize the complexity of a flourish which is generally written quickly, we rely on the kinematic theory of rapid movements (Plamondon, 1995a,b, 1998, 2003). This theory models the trajectory as a sequence of superimposed strokes aimed at a sequence of target points. An estimation of the number of target points can be used as a measure of the flourish complexity. Similarly, we can use a complexity measure based on the number of minima in the speed profile of the flourish. This corresponds to zones where the flourish changes direction with high curvature; consequently, the signer slows down the writing. This can be said to correspond to “fictitious” flourish corners, as represented at Figure 2.10. The number of speed minima is smaller than the number of target points because successive strokes are superimposed. Some signatures are found with two flourishes. The flourishes can be distinguished as the main flourish (Fm), which have more “fictitious” corners and means the most elaborate one, and the secondary flourish (Fs), the simpler one with fewer “fictitious” corners. The estimated parametric and non-parametric distributions of the number of corners for the main flourishes (Fm) and secondary flourishes (Fs) are represented in Figures 2.11 and 2.12.
30
Morphology and lexical aspects in handwriting signatures
Fig. 2.10 Relation between the speed profile minima and the signature “fictitious” corners.
Fig. 2.11 GEV modeling the corners distribution for the main flourish. According to the statistical similarity given by the KS test, we can observe in the plots that the number of corners of the first flourish is similar in the first, second and third databases. We found that the elaboration of the secondary flourish is more notable in the DB1 and DB2. We can also deduce that the signers decorate their second flourishes with fewer corners than the main one. The parameters of the GEV are provided at Table 2.2 for all these cases. DB4 has few signatures with a flourish, which were only just worthy of analysis.
2.3.4 Some text-Flourish morphology dependencies In many cases, the text is inserted within or surrounded by a flourish. A relationship exists between the text and flourish width and geometric center of each. The text and flourish width and the ratio between these widths and the distance between the center of the text and flourish have been measured. These latter two aspect ratios locate the relative position of the text and flourish inside the signature envelope. The four distributions are depicted in Figure 2.13 with their GEV parameters presented at Table 2.2. The Kolmogorov-Smirnov test indicates that
31
2.3 Results
Fig. 2.12 GEV modeling the corners distribution for the secondary flourish.
Fig. 2.13 Text and flourish (pdf) relations approached by GEV. the signatures with text and flourish share similar text-flourish dependence in DB1, DB2 and DB3. However, because the DB4 dataset only includes a few signatures with a flourish, we have not included their data in these analyses. On average, the flourish width is slightly larger than the text width, which is normally around 25 mm, despite the larger space available for collecting the signatures. Such a small difference explains that the width ratio is near to one. Also we can deduce that both text and flourish appear centered on average, since the pdf maximum is near to one. Two additional relations between the text and the flourish have been addressed: the temporal order in which they were written and the connection between them.
32
Morphology and lexical aspects in handwriting signatures
Fig. 2.14 Forged signatures with text and flourish written in the same and different order than the genuine one. The blue line refers to the initial part of the signature and the red line the remainder: (left) genuine specimen where the name precedes the flourish; (center) and (right) represents forged signatures correctly and incorrectly drawn respectively. Regarding the temporal order, it is noted that in the case of text plus only one flourish, 15.0 % of the flourishes are written before the text in DB1; 8.1 % in DB2; and 10.6 % for DB3. No such data was available in the dataset DB4. Such an order generates a source of confusion for forgers because they usually imitate the signature image without information on the temporal sequence. As an example, Figure 2.14 shows a signature drawn in red. Note that the initial part of the signature is highlighted in blue. The forger sees an original image of the signature and then tries to reproduce it. Note that the forged signature in the center keeps the correct order but not the one to the right. It is noted that complex structures are found in the databases when there is a text and a flourish. As stated above, we found many cases where signatures have associated flourishes. The 79 %, 91.9 %, 89.4 % and 100 % of the signatures in the datasets DB1, DB2, DB3 and DB4 respectively have a simple structure: they are composed of text plus one single flourish. Such flourishes sometimes appear connected to the text and we have found that 58 % of users connect them. On the other hand, the rest of these signatures have a complex structure of the text plus two flourishes. The combination of the text and two flourishes allows us to define four cases: i) text plus two flourishes represented as T+Fs+Fm; ii) a secondary flourish followed by the text and the main flourish, Fs+T+Fm; iii) the initial text connected with the secondary flourish, LFs+T+Fm and; iv) the initial capital letter of the name enclosed by two secondary flourishes followed by the rest of the text and the main flourish FsLFs+T+Fm. Table 2.1 shows the probability distribution of these different structures in all analyzed datasets. Additionally, the Figure 2.15 depicts an example of each of these structures. It is also noted that the more common complex structure is due to a graphically generated initial plus the rest of the text followed by a flourish. This is closely similar to signatures with simple structures, highlighting that Western signatures usually avoid excessive complexity.
33
2.3 Results
Table 2.1 Relationship between the text and the flourishes in the complex structures for the Western databases. Cases T + Fs + Fm Fs + T + Fm LFs + T + Fm FsLFs + T + Fm
DB1 7% 22% 68% 3%
DB2 0% 27% 37% 36%
DB3 5% 37% 47% 11%
DB4 0% 0% 0% 0%
Fig. 2.15 Probability of the different text-flourish structures. The colors represent the order in which the signature was written. From initial to final signature, the color order is defined as follows: red, cyan, blue, green and magenta.
34
Morphology and lexical aspects in handwriting signatures
The probability density functions previously represented for each selected feature can be analyzed. It was obtained parameters from each generalized extreme value approximation. Apart from the generalized extreme values, Table 2.2 shows the mean and variance of each function, the maximum probable value of the functions, the skewness and kurtorsis, which mainly interprets the function shape, the minimum and maximum values of the GEV and, finally, the mean square error estimator which measures the average of the squares of the errors between real values presented as a histogram and the measured function. These statistical parameters may be useful in further studies on the lexical morphology of signatures.
2.4
Conclusion
In this chapter it has been studied lexical morphological variability of Western style handwritten signatures: i.e. the differences between the parameters which define the particular lexical morphology of a Western signature. From a large set of possible parameters, a small set was selected in order to gain a better understanding of the main factors which characterize the way the signatures are performed. Various statistical distributions were used. Each selected feature has been validated using signatures from five real Western public databases: MCYT-75, GPDS-881, NISDCC, SUSIG-Visual and Blind sub-corpus and SVC-Task1 and Task2 corpuses. The characterized parameters are presented and are presumed helpful for addressing the normality of signatures in general. Certainly, human behavior is rather difficult to measure in this field, as in others. However, this statistical analysis attempts to bring closer the knowledge of the behavior of the lexical morphology of signatures for a human population. Finally, some of these distributions will be used in the following chapters of this Thesis in order to model the normality of handwriting signatures. It is a crucial matter to generate synthetic signatures with realistic appearances.
Letters line 1. DB1-DB2 Letters line 1. DB3-DB4 Letters line 2-1. DB1 Letters line 2-2. DB1 Slant All DBs Skew All DBs Corners (Fm) DB1-DB3 Corners (Fm) DB4 Corners (Fs) DB1 Corners (Fs) DB2 Corners (Fs) DB3 Text width All DBs Flo. width DB1-DB3 Width ratio DB1-DB3 Center ratio DB1-DB3
Shape ξ -0.30 -0.21 0.13 -0.34 -0.31 -0.09 -0.08 -0.09 0.50 -0.06 -0.33 -0.01 0.01 -0.02 -0.17
Scale σ 2.47 1.69 1.53 2.15 14.20 7.78 1.54 0.81 1.20 0.71 0.55 8.84 10.13 0.27 0.14
Local. µ 5.22 4.72 5.77 4.09 75.74 3.81 3.60 1.93 1.83 2.21 2.02 20.75 27.03 0.67 0.90
Mean 6.07 5.40 6.88 4.77 80.47 7.69 4.37 2.32 3.68 2.57 2.20 25.75 33.01 0.82 0.96
Variance 6.01 3.12 5.75 4.34 194.70 81.75 3.24 0.87 ∞ 0.71 0.28 124.64 174.96 0.11 0.02
Pr. max 0.16 0.22 0.24 0.18 0.03 0.05 0.24 0.46 0.34 0.52 0.72 0.04 0.04 1.38 2.73
Skew. -0.06 0.21 2.22 -0.19 -0.11 0.70 0.73 0.67 75.70 0.80 -0.16 1.06 1.22 1.06 0.37
Kurt. 2.71 2.84 13.65 2.75 2.72 3.75 3.81 3.65 39520.80 4.04 2.73 5.09 5.86 4.95 3.03
Table 2.2 Analytical results from Generalized Extreme Value distributions. min. 1 1 4 1 12.31 -20.12 1 1 1 1 1 1.52 12.21 0.13 0.50
max. 12 10 12 9 120.12 40.32 1 4 7 5 3 80.23 78.12 2.30 1.50
MSE 4.12e-03 3.76e-03 6.78e-03 5.75e-03 4.84e-04 1.01e-03 3.29e-03 3.48e-02 1.55e-02 1.38e-02 4.10e-03 3.36e-04 4.21e-04 2.24e-02 6.99e-02
2.4 Conclusion 35
Chapter 3 Off-Line duplicated signature generation from on-line real samples (On-2-Off) 3.1
Introduction
This chapter introduces a method to duplicate off-line signatures by using real on-line signatures. In the literature, there are several works which use dynamic signatures as seed. Then, after certain distortions applied to these dynamic versions, duplicated image-based signatures are eventually created. Because of on-line signature contains the temporal information, pen-downs and penups transitions and dynamic properties, the proposed method gathers all these information to generate 8-connected duplicates signatures. Then, an additional novelty discussed in this chapter is the realistic conversion of these 8-connected signatures into image-based specimens. It is worth noticing that the complete proposed model has been designed inspired by the motor equivalence model to signing. For this purposes and taking into account these perspectives, the method tries to replicate a realistic intra-personal variability. As such, to assess the variability model, as in (Galbally et al., 2009; Rabasse et al., 2008), the duplicated signature samples are used to increase the training sequence of an ASV. The improvements ranges in the final performance are analyzed to study the beneficial effects of this contribution on the ASV.
38
Off-Line duplicated signature generation from on-line real samples
Fig. 3.1 Diagram of the proposed cognitive-based protocol to duplicate signatures.
3.2
Generation of Duplicated Signatures
Given the time samples of a real signature trajectory T [n] = {x[n], y[n]}N n=1 , firstly they are scaled at 600 dpi, which is a standard resolution used for static signature database. Then they are 8-connected through Bresenham’s line drawing algorithm to produce the signature sequence Tc [n] = {xc [n], yc [n]}M n=1 , being M the length of the continuous trajectory, N in pixels. The velocity {v[n]}n=1 , obtained as the derivative of T [n] respect to n is also linearly interpolated to obtain {vc [n]}M n=1 , representing the velocity of each point in Tc [n]. Similar procedure is done with the pressure signal, obtaining {pc [n]}M n=1 . The duplicated generation consist in modeling the signature variability divided into six consecutive steps: A component segmentation to work out with these individual parts of the signatures, Selection of relevant points; Shape variations according to sinusoidal wave; Random variation of the component positions; Smoothing filter to achieve natural duplicated
3.2 Generation of Duplicated Signatures
39
trajectories and; A virtual ink deposition model (IDM) to produce sample as realist as real off-line samples is applied to all reconstructed signature. Figure 3.1 summarized the methodology carried out in our approach.
3.2.1
Component Segmentation
Using the pressure vector {pc [n]}M n=1 , the components are segmented being the pen-ups (pc [n] = 0) as breakpoints. The average velocity of each component is worked out as {vavg (i)}Li=1 , being L the number of signature components. As the velocity profile can be considered as a linear combination of log-normals (Plamondon and Djioua, 2006), the average velocity of individual components are worked out as the mean value of the velocity profile peaks. The components are classified into three classes: 1) the component i is assigned to “low” velocity if vavg (i) ≤ 0.6vavg , being the vavg the average velocity of all signature; 2) the component i is assigned to “high” speed if vavg (i) ≥ 1.35vavg and; 3) otherwise the component i is considered as “medium” velocity. This classification will be useful to define the grid density of perceptual relevant points in order to approach the cognitive map (i.e., the action plan to design a signature at cognitive level) and design the inertial of the filter which approximates the motor apparatus.
3.2.2
Perceptual point selection
From a perceptual point of view, it is well known that the corners are the most relevant points (Brault and Plamondon, 1993), although not the only ones in a signature. The corner points are selected working out the curvature of each pixel which are approached by the radius of its osculating curves (Trott, 2004). The minimum of the curvature radius are selected as relevant perceptual point. Extra points are selected among the relevant perceptual point according to component classification: for a low velocity component, we select more points than for high velocity component which is also related to the human cognitive skills: the slower you write, the more attention is paid to draw the handwriting trajectory. It is accomplished increasing the minimum distance between peaks.
3.2.3
Intra-component variability
The variability due to the cognitive map is modeled through a sinusoidal transformation applied to the perceptual points of the signature. Sinusoidal transformation allows to approach slight variations in the signer’s cognitive map in a practical way. Let s p [n] =
40
Off-Line duplicated signature generation from on-line real samples
({x p [n], y p [n]})Pn=1 be the sequence of the perceptual points of an individual component, being P the number of perceptual point selected, the new sequence is defined as follows:
�
� 2π(x p [n] − min(x p [n]))Nx x [n] = x p [n] + Ax sin hx � � 2π(y p [n] − min(y p [n]))Ny ′ y [n] = y p [n] + Ay sin hy ′
(3.1)
Being hx and hy the horizontal and vertical sizes respectively measured according to the perceptual point coordinates. The intra-component variability for duplicated genuine samples are obtained modifying the amplitudes Ax , Ay and the number of periods Nx , Ny of the sinusoidal waves. These values were randomly selected by a uniform distribution U (a, b), where (a, b) are the minimum and maximum values, as follows: Ax = hx /U (20, 70) and Ay = hy /U (20, 70) for the horizontal and vertical amplitude respectively and for the number of periods: Nx = U (0.1, 2) and Ny = U (0.1, 2). Finally, the new signature trajectory plan is obtained linking the new dots using the Bresenham’s line algorithm.
3.2.4
Inter-component variability
The inter-component variability originated by the spatial cognitive map variability is approached by a local component displacement. Horizontal Dx and vertical Dy position of each component are displaced by pseudorandom values drawn from the standard normal distribution N (µ, σ 2 ). The experimental values are listed as follows. (N (1, 4), N (1, 1)) if vavg (i) is low (Dx , Dy ) = (N (1, 8), N (5, 2)) if vavg (i) is medium (N (1, 12), N (5, 4)) if vavg (i) is high
3.2.5
(3.2)
Ballistic trajectory reconstruction
From the above trajectory plan, a filter to emulate the motor system is applied. Since the handwriting trajectories can be approached as polynomial curves, a Savitsky-Golay filter (Schafer, 2011) is used to produce human-like trajectory (Ferrer et al., 2013a) interpolating the trajectory plan point. The filter works with a frame size f and with the degree k of the polynomial regression on a series of values. Experimentally, the f value is defined by a uniform distribution as U (60, 60 + 10k) for each type of component and the k value as follows:
3.2 Generation of Duplicated Signatures
41
Fig. 3.2 Reconstructed component from trajectory plan through Savitsky-Golay-based interpolation of the perceptual points.
U (6, 8) if vavg (i) is low k= U (4, 6) if vavg (i) is medium U (3, 5) if vavg (i) is high
(3.3)
As low velocity trajectories contain more details, they need a higher polynomial degree in order to be reconstructed. For higher velocities, lower polynomial degree is more adequate for smoother curves. Low and high velocities are generally related to handwriting and flourish respectively. So, all fixed values achieve larger variability in the speedy components. It agrees with human behaviour because hand rapid movements are usually less precise than slower ones. Figure 3.2 shows the final trajectory for an individual component. We can observe the perceptual points using osculating curves and the final component trajectory slightly modified.
3.2.6
Signature reconstruction and ink deposition model
At the end of this stage, each component is concatenated with the rests of components to create the skeletal bitmap image, which represents the skeleton of the signature path. Then, an ink deposition model (IDM) is designed to create realistic image-based signatures by simulating a ballpoint pen. A ballpoint pen is a writing instrument which dispenses ink from an internal reservoir through the rolling action of a metal ball at its tip. Mainly due to ink viscosity and gravity or reservoir pressure, the ink flows from the reservoir to coat the ball. Handwriting is produced by rolling the ball on a sheet which deposits the ink on the paper. Our model supposes that the ballpoint pen generates a sequence of inked spots when rolling.
42
Off-Line duplicated signature generation from on-line real samples
(a) Ballpoint spot modelling depending on the position
(b) Real signature stroke detail from GPDS database (left); detail of synthetic(right)
Fig. 3.3 Ink deposition model The spot shape is modeled as an ellipse the vertical and horizontal axes of which are p given by φv = φs cos β and φu = 2φs φv − φv2 where φs is the pen tip diameter and β the pen inclination angle. The major axis of the ellipse is perpendicular to the pen azimuth θ . Both are calculated by supposing that a pen pivot (a, b) is located 2.5 cm from the lower right hand corner of the paper and at 2.5 cm above the paper. This assumes an average hand size. In Figure 3.3-a are represented the mentioned parameters. Although the pen speed and pressure are not always correlated, this ink deposition model assumes that the spot gray level amplitude is inversely proportional to the speed. Let vc [n] be the pen speed at dot1 (xc [n], yc [n]), the normalized pressure is presumed to � be pc [n] = 1/ vc [n]/ max{vc [n]}M n=1 . The spot gray level amplitude is defined as Ac [n] = pc [n] × ∆p + pmin where ∆p and pmin are heuristically random numbers in the range [0 − 0.3] and [0.6 − 0.8] respectively. To take into account the pen tip irregularities or deposition failures, the spot is multiplied by a random normal noisy spot defined as N (0.75, 0.25). The signature images is obtained by overlapping the consecutive spots so as to correspond to 1 In
Figure 3.3-a these coordinates are represented as (xi , yi )
3.3 Model Validation
43
Fig. 3.4 Examples of multiple signatures from only one seed. The first column shown the seed and the rest of columns the duplicated samples. the rolling action of the ballpoint pen. The maximum dark value is taken into account by cropping the signature level intensity to 2φs . The last step in improving the realism of the off-line signature images is to approximate the calculated stroke gray level histogram to a real ink histogram distribution. The histogram of the generated strokes is equalized to match one of the ink histograms of the three more usual ink types: fluid, viscose and solid (Franke and Rose, 2004). These inks plus the usual commercial ball pen diameters φs = {0.20, 0.25, 0.30, 0.35, 0.40, 0.45} mm mean that 18 pen types are available. Additionally, the variables ∆p and pmin are randomly generated for each signature. An example of the result can be seen in Figure 3.3-b. The effect is realistic although there is room for improvements, e.g. to create striated ink deposition. Finally, we could visualize how the variability is modified for a set of samples in Figure 3.4. From only one original seed, we show five possible samples synthetically generated through the proposed model.
3.3
Model Validation
The experiments have been conducted to analyze whether our cognitive inspired model is able to introduce natural variability using duplicated samples as similar as the variability
44
Off-Line duplicated signature generation from on-line real samples
introduced by human beings. Such a synthetic variability has been tested with an off-line verifier. The validation process tries to determine whether the classifier response is similar in both cases: when real signatures are added to augment the training model or when duplicated ones are introduced. The hypothesis underlying the principle that the duplicated signatures contain complementary information which can be used to outperform the performance of the original models. On the one hand, the dataset used in this trial is the publicly available dynamic MCYT330 corpus (Ortega-Garcia et al., 2003). On the other hand, the performance evaluation is computed by using the Texture-based + SVM (Ferrer et al., 2012a) verifier. For further details on dataset and verifier, reader could revise Section A and Section A, respectively. The baseline is calculated using the dynamic MCYT-330 corpus converted into realistic off-line images by using the ink deposition model. The evaluation is assessed with four different training models. The first training model is formed by the first 5 signatures; the second with the first 10; the third relies on the first 2 and the last one with the first 4, all according to nomenclature database. While 5 and 10 signatures are traditional enrollment sizes in the literature, 2 signatures is a more challenging scenario with a very limited amount of data. The generation of duplicated data could be exploited in such limited applications. For all cases, the genuine scores were calculated matching the rest of genuine samples of the owners against the trained model. Then, impostor scores were obtained with random selection of genuine samples of others signers not included into the training model. It tries to prove whether a signature without previous knowledge of the originals (random forgeries) could be enrolled in the system. Skilled forged scores were calculated against the trained model in each case. Such results are the baseline which estimates the utility and the limits of our duplicated samples, shadowed in Table 3.1.
3.3.1
Intra-personal variability evaluation of the duplicated signatures
The aim of this experiment is to ascertain the complementarity information between the duplicated and the real signatures used to generate them. The training models used to calculate the baseline in the previous section are trained again adding duplicated samples generated from the own real signatures contained in the models. The goal is to determine the ability of the cognitive approach to generate samples with complementary information about the signature owner. Table 3.1 shows the Equal Error Rate obtained using the MCYT-330 signatures (baseline) and the enhanced models trained with real and synthetic signatures.
3.3 Model Validation
45
Table 3.1 Equal Error Rate (EER) results using the texture-based verifier for the two validations. The baselines are shading with certain gray level. Training Random Forgeries Skilled Forgeries R∗ D/R∗ 2 3.70 % 23.73 % 2 1 3.33 % 19.86 % 2 4 3.13 % 19.73 % 2 20 2.89 % 19.12 % 5 1.88 % 19.17 % 5 1 1.97 % 16.52 % 5 4 1.63 % 16.37 % 5 20 1.43 % 16.19 % 10 1.07 % 13.13 % ∗ R means the real enrolled signatures and D/R means the duplicated per real enrolled signatures.
In general, the results obtained with the duplicate samples outperform the baseline. Such improvements can be observed initially in the skilled forgeries in which EER starts to decrease, even with the smaller duplicate sets. In the random forgery scenario, the improvements are more observable when larger duplicate sets are included. Although the system generates more synthetic specimens from one signature, the results seem to saturate around 1.5 % for random forgeries and almost 16 % for skilled forgeries. However, obtained results with 10 and 4 real signatures suggests that there is still margin to improve the performance. The usefulness of the duplicate samples is more evident in the scenario with only 2 training signatures. The cognitive generation approach clearly increases the robustness of the trained models. In the case of the skilled forgeries, it is possible to improve by 4 % the performance of the original models. As we can observe, the EER saturates at certain number of duplicated signatures. Such saturation is due to the limited inner variability available in only one seed. We could estimate that the improvement is higher when we have a few samples in the training model. It might play a special role in criminology and forensic science where they deal with a few genuine samples.
46
3.4
Off-Line duplicated signature generation from on-line real samples
Conclusions
A new method inspired by the cognitive neuromotor perspective to generate static duplicated signatures has been proposed. The developed generator introduces non linear deformation in on-line signatures to mimic the characteristics of human beings’ variability. This cognitive method has been validated improving the performance of a recent state-ofthe art automatic signature verifier. Database with few genuine samples could find benefits duplicating synthetically their samples following this methodology. Also, behavioral disorders, neurodegenerative diseases and other cognitive impairment in neurodegenerative problems are related to muscular path variability. This approach could be taken into account to generate perturbing trajectories inserting carefully random movements into the inter-component variability stage. As preliminary evaluation of this cognitive inspired model, the duplicated generation was conducted from dynamic trajectories. However, the duplicated signature method should be adapted so as to generate off-line signatures from off-line signatures. The latter is supposed to be a more challenging case and more realistic than the former for automatic off-line signature verification. This case will be discussed in next chapter.
Chapter 4 Off-Line duplicated signature generation from off-line real samples (Off-2-Off) 4.1
Introduction
Modeling its intra-personal variability in off-line signatures is still an open challenge which has caught the attention of researchers on pattern recognition and machine intelligence. It is important to understand intra-personal variability of the signatures of a signer. Its modeling allows the widening of the distinction between genuine and non-genuine signatures. The generation of duplicated specimens with realistic appearance helps in gaining a better understanding of signature execution from several neuroscientific perspectives. This also supports coherent decision making in psychology and forensic science and assists in optimizing speed and performance for indexing purposes. In this chapter, the realism of the intra-personal variability model is evaluated by increasing a training sequence with duplicates and ascertaining the improvement in performance of four different state-of-the-art generative classifiers. So as to consider as many aspects of the variability as possible, we have chosen verifiers which are based on different features and classifiers. Additionally, we have used two different public datasets. The improved performance after training with the enlarged set is discussed as well as the complementary information contained in data produced by the cognitive inspired duplication algorithm.
48
Off-Line duplicated signature generation from off-line real samples
Fig. 4.1 General overview of the off-line signature duplicator.
4.2
Generation of Duplicated Signatures
This section describes the duplicator algorithm steps, which are listed as follows: signature segmentation, intra-component variability, component labeling, inter-component variability and signature inclination. A general overview of this duplicator is depicted in Figure 4.1.
4.2.1
Signature Segmentation
Let I(x, y) be the 256-level gray scale signature image input to the duplicator. The segmentation process is performed to remove the background from the scanned images. A simple thresholding operation is applied (Otsu, 1979) to obtain a binary image Ibw (x, y). Because this image still contains noise, careful processing is carried out to remove it (Ferrer et al., 2012a). The resulting image is used as a mask to remove the background and segment the original inked signature. Next, the canvas size is processed by cropping the white borders of the image thus obtaining the preprocessed image IP (x, y).
4.2.2
Intra-component variability
The intra-component variability is introduced by a piecewise sine wave function. Let IP (x, y) be a segmented gray scale signature whose canvas size is defined by M columns and N rows. A sinusoidal transformation is applied to the rows and columns of the image according to equation (4.1) to obtain IS (xs , ys ).
4.2 Generation of Duplicated Signatures
49
Fig. 4.2 Visual examples of intra-component variability in different repetitions of a scanned image. Note how loops in letters “d” and “a” are opened and closed without losing their original continuity.
xs = x + Ax sin (ωx x + ϕx ) ys = y + Ay sin (ωy y + ϕy )
(4.1)
Where the parameters of the sine wave are defined as follows: i) The sinusoidal amplitudes are calculated for both coordinates: Ax = M/αA and Ay = N/αA , where αA is a factor which follows a uniform distribution U (αAmin , αAmax ). ii) The angular frequencies are obtained through the oscillation period ωx = 2π/τx and ωy = 2π/τy . iii) A certain variability is added to the period similar to the amplitude: τx = M/αP and τy = N/αP . In the same way, the parameter αP follows a uniform distribution U (αPmin , αPmax ). iv) Finally, the phase is defined by: ϕ = 2παS , where αS follows a uniform distribution U (αSmin , αSmax ). Accordingly, ϕx and ϕy are computed. Visual details of this transformation on the word da are shown in Figure 4.2. Several sinusoidal transformation parameters distort the inked image producing different duplications. The figure illustrates how the intra-component relationship is modified.
4.2.3
Component Labeling
In this step each connected area is separately labeled (Haralick and Shapiro, 1992) in the binary image. Starting with the first detected pixel, the algorithm searches for all 8-connected areas. Using the information in each label, an enclosing box is built for each isolated, inked component. Figure 4.3 shows different detected components in different handwriting signatures. In some examples it is possible to see that the flourish is merged with the text. In such cases, a large area of the signature is detected as one component (see Figure 4.3-c or 4.3-d, among others). This stage allows the generation of a set of L individual images {Ii (x, y)}Li=1 from each labeled component of the image IS (xs , ys ).
50
Off-Line duplicated signature generation from off-line real samples
Fig. 4.3 Visual examples of labeling in handwriting signatures. The non-connected components are highlighted by assigning different colors to each signature component.
4.2.4
Inter-component variability
The inter-component variability is dealt with by applying different horizontal and vertical independent displacements to each labeled component. In an ideal case, each labeled component represents an inked trace from a pen tip which touches the paper until it is lifted up. This section assumes that the larger the component ratio, the more rapidly the component was drawn and that eventually it will be subjected to more inter-component variability. Figure 4.3 reveals that many components are not correctly labeled mainly because their flourishes are drawn over many letters. Although this could introduce certain errors in classification in signatures with a prominent flourish, this classification has been used in the algorithm for convenience (Diaz-Cabrera et al., 2014a). Additionally, for signatures with small or without a flourish at all, this stage still introduces personal variability to the duplicates (see Figure 4.3-f and 4.3-j). Let us define a sequence of labeled images {Ii (x, y)}Li=1 where each image represents each detected component. The new image Idis with the displaced component is computed as: L
Idis (x, y) = ∑ Ii (x + δxi , y + δyi )
(4.2)
i=1
Three kinds of section were identified for each of the horizontal and vertical coordinates, which are delimited by κ. Thus, the displacement of each component (δx , δy ) is worked out as follows: 1 1 1 gevrnd{ξx , σx , µx } δx = gevrnd{ξx2 , σx2 , µx2 } gevrnd{ξx3 , σx3 , µx3 } 1 1 1 gevrnd{ξy , σy , µy } δy = gevrnd{ξy2 , σy2 , µy2 } gevrnd{ξy3 , σy3 , µy3 }
if Γi < κ1 if κ1 ≤ Γi < κ2 if Γi ≥ κ2
(4.3)
if Γi < κ1 if κ1 ≤ Γi < κ2 if Γi ≥ κ2
(4.4)
To categorize each component, a ratio is calculated per component: Γi = γi /γT . This ratio denotes the relationship between the number of pixels in each individual componentγi
51
4.2 Generation of Duplicated Signatures
and the total number of inked pixels γT in IS (xs , ys ). These displacements are obtained by pseudo-random values drawn from a Generalized Extreme Value (GEV) distribution (Kotz and Nadarajah, 2000). This function was also used in Chapter 2 to define the lexical and morphology characteristic of handwriting signatures. After the displacement, the summation of individual images over Idis could overlap certain pixels of two or more individual images. In real handwriting, a similar effect of ink summation is noted in crossed over traces. If there are such crossovers, to obtain the gray scale values in the relevant pixels, two steps are taken: Step 1: One of the individual components is randomly chosen to be the first drawn trace and the second is summed to make the new image. Step 2: For only the crossed traces, a simple blending factor ψ is worked out to mimic the effect of having two overlapped traces. If any pixel is not overlapped, step 2 is omitted during the summation of the two relevant individual Ii images. We formalized this stage using simple concepts in set theory, along with the inter-component variability stage. Finally, an extra stage to introduce variability is generated to the whole image, it is explain in the next subsection.
4.2.5
Signature inclination modification
The signatures can be written in an ascendant, descendent or longitudinal manner. This inclination is the so called skew. Chapter 2 studies the skew of signatures from different signers (inter-personal variability). While in Chapter 2 was studied the skew of different signers, here the study is focused on the signature inclination of each signer (intra-personal variability). The procedure to measure this intra-personal distribution is as follows: Let N be a set of genuine signatures from a signer. The skew with respect to the horizontal is measured for each specimen ρi . Then, the user’s average inclination is computed to finally obtain the difference (ρˆ i ) between each individual value and its average. ρˆ i =
! 1 N ∑ ρi − ρi N i=1
(4.5)
When the inclination dispersion is calculated for N signers, a global Probability Density Function (pdf) is estimated by the histogram non-parametric method. Accordingly, a Generalized Extreme Value (GEV) distribution has been used to approximate the measured pdf with the parameters [ξS , σS , µS ]. Due to the fact that the skew of the signature introduces personal variability in the set of genuine signatures, each image has been rotated a certain angle calculated using a GEV
52
Off-Line duplicated signature generation from off-line real samples
Fig. 4.4 Visual summery process to duplicate off-line signatures. distribution. Again, the image borders are cropped to remove the white pixels at the edges of the signature. At the end of this stage, a duplicated signature Idup (x, y) is obtained. As a final example, Figure 4.4 illustrates the effect of each stage in an off-line signature.
4.3
Model validation
The procedure is conducted with two off-line signature databases, namely the GPDS-300 (Ferrer et al., 2012a) and MCYT-75 (Ortega-Garcia et al., 2003) along with four published state-of-the-art-ASVs so as to avoid biased results and to obtain more consistent and general conclusions. Specifically, System A (Ferrer et al., 2005) works with geometrical features and Hidden Markov Models (HMM); System B (Eskander et al., 2013) employs the Boosting Feature Selection (BFS) approach and single grid-based features; System C (Ferrer et al., 2012a) is a Support Vector Matching (SVM) classifier with texture features; and System D (Zois et al., 2016), which is a third-party system, uses pose-orientated grid features and an SVM. For the training, different strategies have been carried out. In this work, the training set consists of the first two, the first five and first eight real genuine signatures. As such, for each strategy, we have added the duplicated signatures to the training. For instances, let 5 be the number of the first real signatures enrolled in the system. We have trained with these 5 real signatures plus 0, 1, 5, 10 and 20 duplicated signatures, obtained from each individual real enrolled specimen. To test the GPDS-300 database, we used from the ninth to the twenty-third genuine signature for all cases, i.e. 15 signatures per user in total. So as to do a fair comparison, we used the identical test in all experiments. For the MCYT, the testing set is composed of 7 signatures: from the ninth to the fifteenth. This way, the false rejection rate (FRR) is calculated with 15×300 = 4500 scores for GPDS-300 and 7×75=525 scores for MCYT-75.
53
4.3 Model validation
(a) Intra-Component
(b) Inter-Component
Fig. 4.5 At the top, from left to right the values used to illustrate the intra-component variability for the four signatures were respectively: αA = 30, 5, 5, 5; αP = 0.8, 0.8, 0.5, 0.5 and αS = 0, 0, 0, 0.5. Similarly, at the bottom, from left to right, the values used to defined the inter-component variability were respectively, σx1 = 10, 0, 40, 40 and σy1 = 0, 4, 4, 16. Symbols ✓ and × indicate natural and unnatural writing styles respectively. For the random forgery test, we have selected the first testing signature of other users, i.e. the signature number nine according to the database nomenclature. We compute the false acceptance rate (FAR) with 1×(300-1)×300 = 89700 scores for GPDS-300 and 1×(751)×75 = 5550 scores for MCYT-75. For the skilled forgery test, all forged signatures in the databases were used. Therefore, we compute the false acceptation rate (FAR) using 30×300 = 9000 scores for GPDS-300 and 15×75 = 1125 scores for MCYT-75. We note that the skilled forgeries are never used for training.
4.3.1
Cognitive inspired duplicator set up
Setting up the duplicator algorithms requires optimization of their parameters. Therefore a development dataset and ASV are required. To avoid adjusting the data, this is conducted on a subset of one of the two training databases and with one of the four ASVs. Specifically, the development set is composed of the first 5 samples of the first 150 users of the GPDS-300. This is used to train the System C which is based on texture features followed by applying a Support Vector Machine ASV. The parameters were heuristically optimized in a trial and error procedure in three steps. Firstly, initial values were given to each parameter in order to produce the desired distortion effect; secondly, a coarse tuning of the parameters by a perceptual evaluation of the results was conducted; and thirdly, a fine-tuning of the parameters to produce the best performance with the above mentioned ASV was undertaken. On intra-component variability, incorrect selection of a parameter could produce an unnatural handwriting image. Because αA is inversely proportional to the amplitude, while large values do not produce any effect because the amplitude results are close to 0, lower values would produce rectangular traces if αP and αS were 1 and 0, respectively. In the case that the amplitude is near to one, and the sinusoidal phase is null, large values in αP create highly sinusoidal images that are not human-like. Nevertheless a combination of
54
Off-Line duplicated signature generation from off-line real samples Table 4.1 Configuration of the off-line duplicator parameters. αAmin = 5 Intra-Component Variability
αAmax = 30 αPmin = 0.5 αPmax = 1 αSmin = 0 αSmax = 1 {ξx1 , σx1 , µx1 } = {−0.5, 20, 2 × σx1 } {ξx2 , σx2 , µx2 } = {−0.5, 1.4 × σx1 , 2 × 1.4 × σx1 }
Inter-Component Variability
{ξx3 , σx3 , µx3 } = {−0.5, 1.8 × σx1 , 2 × 1.8 × σx1 } {ξy1 , σy1 , µy1 } = {−0.5, 8, σy1 } {ξy2 , σy2 , µy2 } = {−0.5, 1.2 × σy1 , 1.2 × σy1 } {ξy3 , σy3 , µy3 } = {−0.5, 1.5 × σy1 , 1.5 × σy1 } κ1 = 0.33 κ2 = 0.67 ψ = 0.8
Signature Inclination
ξS = −0.19 σS = 3.28 µS = −1.30
them in the correct range produces acceptable human-like results. As example of writing style modification is illustrated in Figure 4.5-a. The correct parameter combinations are highlighted with a tick whereas unnatural looking signatures are shown by a cross. On the inter-component variability, too much deformation displays strange effects in the text. Specifically, an extra large value for δx can change the order of the text: for instance, the original name “Peter” could be converted to “Peert”. Thus, an excessive deformation in vertical displacement δy yields an unnatural order of the letters in the vertical direction. These effects are observed in Figure 4.5-b. Also, the inter-component variability becomes too sensitive to the size of the image. Therefore, it became necessary to fix a location parameter ξ . Because the natural variation in vertical displacement is usually positive, ξ was fixed at -0.5 in order to bring the center of mass of the distribution back to the lower position. Because the scale σ controls the opening of the range of possible values, it is incremented according to the kind of sector it is in, thus giving more variability to most inked components. Finally, the parameter µ moves the distribution without changing the shape. Experimentally, this parameter is related to the scale for natural writing and to the relationship between sections. The sections were then divided into equal ranges,κ1 and κ2 , and ψ was visually fixed at 0.8 to account for the natural effect of the ink. Table 4.1 shows the parameters and their range used in this work. Finally, we can visualize the natural writing style obtained through our model in Figure 4.6. In this case a set of five possible duplicates are generated from only one original signature.
4.3 Model validation
55
Fig. 4.6 Examples of multiple signatures from only one original signature. The first column shows the original signature and the rest the duplicated samples. Some details in the signature variability are highlighted with gray spots.
56
Off-Line duplicated signature generation from off-line real samples
Table 4.2 Equal Error Rate (first) and Area Under Curve (second) results in % for the GPDS-300 Off-line Signature DB for four validations. The baselines are shaded in gray. Training Random Forgery R∗ D/R∗ System A System B System C System D System A 2 0 8.30 – 97.13 17.10 – 92.20 2.84 – 99.58 8.88 – 96.98 34.34 – 71.30 2 1 8.42 – 96.91 13.12 – 95.23 2.59 – 99.64 7.53 – 97.58 33.62 – 71.88 2 5 7.63 – 97.25 9.71 – 97.10 1.90 – 99.79 4.65 – 98.95 33.55 – 71.73 2 10 7.10 – 97.59 8.63 – 97.48 1.69 – 99.84 4.22 – 99.16 33.05 – 72.30 2 20 6.25 – 97.87 8.04 – 97.75 1.43 – 99.88 3.81 – 99.30 32.01 – 73.67 5 0 4.95 – 98.63 5.58 – 98.92 0.92 – 99.93 4.38 – 99.04 29.37 – 76.78 5 1 5.29 – 98.64 4.09 – 99.36 0.75 – 99.95 3.42 – 99.31 30.61 – 75.88 5 5 4.41 – 98.87 3.01 – 99.56 0.54 – 99.98 2.41 – 99.60 28.58 – 77.77 5 10 4.23 – 98.89 2.76 – 99.61 0.48 – 99.98 2.19 – 99.68 28.60 – 77.51 5 20 4.16 – 99.00 2.64 – 99.64 0.36 – 99.98 1.83 – 99.73 27.86 – 78.57 8 0 4.80 – 98.78 4.01 – 99.33 0.57 – 99.97 2.85 – 99.53 29.03 – 77.63 8 1 4.85 – 98.80 3.19 – 99.57 0.45 – 99.98 2.65 – 99.54 28.89 – 77.96 8 5 4.02 – 99.00 2.46 – 99.74 0.29 – 99.99 2.01 – 99.65 27.82 – 78.85 8 10 4.19 – 99.00 2.29 – 99.75 0.22 – 99.99 1.81 – 99.72 27.10 – 79.76 8 20 4.28 – 99.03 2.78 – 99.62 0.20 – 99.99 1.34 – 99.82 26.60 – 80.29 ∗ R means the real enrolled signatures and D/R means the duplicated per real enrolled signatures.
4.3.2
Skilled Forgery System B System C 34.19 – 72.28 24.86 – 82.74 31.80 – 74.19 25.11 – 82.69 29.20 – 77.37 23.70 – 84.16 28.67 – 77.92 22.68 – 85.32 28.55 – 78.12 21.63 – 86.46 25.57 – 82.05 20.91 – 86.95 24.91 – 82.87 19.99 – 87.66 24.19 – 83.29 18.98 – 88.73 23.82 – 83.61 17.98 – 89.70 24.04 – 83.39 17.19 – 90.39 23.96 – 84.10 19.02 – 88.96 23.32 – 84.38 18.21 – 89.46 23.54 – 84.43 16.45 – 91.29 23.11 – 84.51 15.08 – 92.17 20.39 – 87.19 14.58 – 92.72
System D 28.87 – 78.24 29.42 – 78.11 26.88 – 80.64 25.73 – 81.74 25.95 – 82.06 24.69 – 82.64 24.36 – 83.50 23.25 – 84.93 22.90 – 84.91 22.57 – 85.36 22.16 – 85.48 22.16 – 85.81 21.52 – 86.07 21.60 – 86.57 19.97 – 88.08
Intra-personal variability evaluation of the duplicated signatures
The aim of this experiment is to ascertain whether our duplicated signatures present a human-like variability through the complementarity between them and the signatures used to generate them. Accordingly, we have trained different classifiers without duplicates, with duplicates and with the same number of real signatures. Also the test used is identical in all cases. The goal is to determine the ability of the cognitive approach to generate samples with complementary information about the signature owner, especially in critical conditions when only a few signatures for training are available. The essential part of this section focuses on demonstrating that the progressive addition of duplicated signatures to a training set improves the system performance, highlighting the cognitive-based signature duplicator’s capability of working out human-like variability in signature verification. This concrete finding has been demonstrated by testing two offline publicly available databases and four state-of-the-art off-line signature verifiers, as is mentioned in Section 4.3. Table 4.2 and Table 4.3 analyze the resulting performance, both in terms of Equal Error Rate and Area Under Curve. “GPDS-300 and System A”. We could observe the same tendency in both random and skilled forgery tests: the more duplicates we use, the better the results. This highlights the potential of the duplicated signatures in both tests, but the biggest improvement is for skilled forgeries.
4.3 Model validation
57
Fig. 4.7 ROC plots training with the first 5 real signatures plus the duplicates for GPDS-300. “GPDS-300 and System B”. Excellent improvements in the verification rates are achieved, especially in the case where we have few signatures to train the model and for skilled forgeries. Note that, the skilled forgery test is the most critical one for ASV systems. Hence these results highlight the potential of this duplicator for security or forensic applications. Moreover, it is worth taking into consideration how close the performance of 5 R + 20 D/R is to that for 8 R + 0 D/R, which suggest that the duplicates are equivalent to three real signatures. “GPDS-300 and System C”. This case confirms the hypothesis that for whatever traditional training set, the GPDS database provides a significant improvement in performance. Again, the most significant improvements are observed when the training models have a few signatures. But it is relevant to say that although we use 8 real signatures to train it, the cognitive model itself still benefits in all cases from additional information. Moreover, it is observed that this method is able to achieve a promising performance with only 8 real signatures. “GPDS-300 and System D”. The robustness of our duplicating procedure is successfully proved with this fourth system since it was not designed by the authors of this article. The relevant improvement with the three different training sets confirms the utility of the cognitive duplication method to outperform the traditional method. The most relevant effect is observed in the case of 2 real enrolled signatures, where the performance improvement is five 5 percent for the random forgery test. In Figure 4.7, it is shown, as an example for a model composed of 5 real signatures, the two errors (FAR and FRR) in a ROC plot for each system and each test. This curve shows
58
Off-Line duplicated signature generation from off-line real samples
the real behavior in all operative points. The general observation in the middle case of 5 real signatures again demonstrates how the improvement is not only at the operational point, but at all points of the ROC curves. Similar findings can be assessed in Table 4.3 for MCYT: “MCYT-75 and System A”. The most notable improvements are for the training set with 2 real signatures for the random forgery test and for 5 real ones for the skilled forgery test, duplicating at 20 times per real enrolled specimen. The table in this case shows consistent results which verify the targeted goal. “MCYT-75 and System B”. Excellent results are observed here. We could highlight the effect in the random forgery test where both the EER and AUC indicate the maximum performance for 5 real signatures. An anomaly in our results occurs at an outlier which produces a strange performance (EER=0.19 %) in the random forgery test with 5 R + 10 D/R. As we said in Section 4.3, the FRR error is computed with 525 scores. Failure here implies a value of 1/525 = 0.0019 (or 0.19 %). Such a value in the table indicates that only one genuine signature was incorrectly classified. Note that, statistically speaking, this inconsistency is irrelevant to the impact of the duplicator so we do not need to adjust our conclusions. Moreover, the most relevant improvement is due to the training set with 2 real enrolled samples. It highlights the convenience of this method in criminology and forensics, where only one or two genuine samples may be available. In this case, we can observe for skilled forgeries - the most difficult and relevant test - the notable improvement when only 2 real signatures are enrolled. “MCYT-75 and System C”. Again, this system tends to reinforce the hypothesis that the proposed duplicator is robust enough to categorize the intra-personal variability. It is worth pointing out that under experimental conditions, using an objectively fair protocol, impressive performance is achieved with 5 R + 20 D/R of the skilled forgeries. “MCYT-75 and System D”. The potential of the cognitive method is demonstrated with this system. The best impact is achieved with skilled forgeries using only two real signatures in the training set whereas the minimum impact is observed when the performance is still quite competitive, as in the case of 8 real enrolled signatures in the random forgeries test. Graphically, the case of 5 real enrolled signatures is summarized at Figure 4.8 using a ROC plot. Beyond the operative points, once again, we can see the significant and consistent improvement in all cases. These experiments attempt to validate the robustness of our verifier for experiments in respect to each database where, at zero human cost and in all assessed conditions, the duplicator outperforms the baseline. As general tendency, our experimental results lead to the conclusion that 20 duplicated specimens have a similar effect, in performance average terms,
59
4.4 Conclusion
Table 4.3 Equal Error Rate (first) and Area Under Curve (second) results in % for the MCYT-75 Off-line Signature DB for four validations. The baselines are gray. Training Random Forgery R∗ D/R∗ System A System B System C System D System A 2 0 6.84 – 97.81 17.42 – 93.08 1.95 – 99.77 3.09 – 99.29 21.40 – 86.35 2 1 5.31 – 98.51 7.78 – 98.39 1.77 – 99.80 3.44 – 99.31 22.94 – 83.83 2 5 3.51 – 99.22 1.39 – 99.93 1.69 – 99.86 2.36 – 99.58 20.37 – 86.94 2 10 3.59 – 99.03 0.17 – 100.00 1.29 – 99.92 1.72 – 99.73 20.09 – 87.16 2 20 3.05 – 99.25 0.17 – 100.00 0.69 – 99.96 1.11 – 99.81 19.03 – 87.86 5 0 3.18 – 99.11 6.09 – 99.08 0.81 – 99.96 1.31 – 99.81 18.18 – 90.53 5 1 2.24 – 99.35 1.81 – 99.92 0.89 – 99.95 1.25 – 99.83 17.17 – 90.44 5 5 2.01 – 99.53 0.00 – 100.00 0.48 – 99.99 0.81 – 99.91 16.08 – 91.50 5 10 2.11 – 99.56 0.19 – 100.00 0.22 – 100.00 0.50 – 99.94 16.35 – 91.50 5 20 2.26 – 99.57 0.00 – 100.00 0.32 – 100.00 0.34 – 99.96 15.27 – 91.63 8 0 1.78 – 99.72 1.41 – 99.93 0.36 – 99.99 0.37 – 99.96 13.42 – 93.50 8 1 1.90 – 99.72 0.36 – 99.99 0.25 – 99.99 0.50 – 99.96 14.32 – 93.02 8 5 1.56 – 99.81 0.19 – 100.00 0.23 – 100.00 0.32 – 99.97 14.34 – 92.71 8 10 1.20 – 99.86 0.38 – 100.00 0.09 – 100.00 0.31 – 99.98 13.06 – 93.73 8 20 1.06 – 99.90 0.38 – 100.00 0.14 – 100.00 0.30 – 99.98 12.02 – 94.08 ∗ R means the real enrolled signatures and D/R means the duplicated per real enrolled signatures.
Skilled Forgery System B System C 34.36 – 73.04 16.88 – 89.98 30.84 – 76.53 17.90 – 88.82 25.20 – 82.58 17.63 – 89.67 24.73 – 83.74 16.70 – 90.38 23.67 – 84.44 16.06 – 91.47 24.26 – 83.84 14.06 – 93.25 20.99 – 86.41 13.58 – 93.19 19.02 – 88.32 12.44 – 94.16 20.15 – 88.25 11.99 – 94.82 16.58 – 90.09 11.90 – 95.05 15.13 – 92.08 11.05 – 95.06 14.62 – 92.07 11.61 – 95.45 14.72 – 92.24 9.72 – 96.34 16.11 – 91.34 9.78 – 96.66 15.26 – 91.61 9.12 – 97.01
System D 21.15 – 87.45 20.54 – 88.28 18.41 – 89.48 16.88 – 90.88 16.50 – 91.50 16.42 – 91.40 15.71 – 92.30 15.17 – 92.63 14.19 – 93.65 14.02 – 93.83 12.90 – 93.49 12.76 – 94.05 12.43 – 94.74 12.57 – 94.69 11.57 – 94.92
to 3 real signatures. In one particular case, in the random forgery test, 5 real specimens in the training set and System B is equivalent to adding more than 5 real signatures from both databases. It should be noted that the feature extraction in each ASV and the classifier are completely different. This explains the different sensitivities in each case. Nevertheless, the sensitivities always have a positive effect on the performance, which sustains the hypothesis that the cognitive inspired method is able to introduce certain intra-class variability to the systems. Actually, the controlled deformation allows us to enlarge and adapt better the model boundaries for each classifier and for each kind of training model.
4.4
Conclusion
This chapter proposes an off-line signature duplicator based on the cognitively inspired principles of the equivalence model of human motor function. This contribution integrates the actions of each effector independent and effector dependent, from motor equivalence theory. The proposed hypothesis relies on the idea that the duplicated signatures under a cognitive perspective are able to model better the intra-personal variability of a signer. This hypothesis is evaluated by studying the improvement in the performance of off-line signature recognition systems when duplicated specimens are provided to the training set. The results obtained
60
Off-Line duplicated signature generation from off-line real samples
Fig. 4.8 ROC plots training with the first 5 real signatures plus the duplicates for MCYT-75. in this work suggest that independently of the number of real signatures we introduce, the performance of the system improves in all cases when the cognitive-based duplicator is used. As result, signatures from our duplicator consistently improve the performance of four generative classifiers, which were used with their original configuration without being adapted to any dataset. These automatic signature verifiers are completely different among themselves in the type of selected features and in the classifiers employed. Additionally, to generalize our conclusions, the experiments were repeated in two well-known publicly off-line signature databases: GPDS-300 and MCYT-75. Finally, it could be said that this method is simple, fast, efficient and useful for generative classifiers for effectively zero human effort and at only the cost of machine time. This novel duplicate generator has high potential in signature-based biometric applications, especially in resolving security problems or in cases where only a few image-based signatures are enrolled.
Chapter 5 On-Line duplicated signature generation from on-line real samples (On-2-On) 5.1
Introduction
This chapter studies the intra-personal variability in dynamic signatures, achieved by means of a human behavioral model of signature kinematics. One of the most mature models for human movement analysis is the kinematic theory of rapid movements (Plamondon, 1995a,b; Plamondon and Djioua, 2006). This theory has demonstrated its effectiveness in the development of tools for learning handwriting in children (Djeziri et al., 2002), detection of problems related to brain strokes (O’Reilly and Plamondon, 2011) and especially in signature verification (Diaz et al., 2015b; Fischer and Plamondon, 2015; Galbally et al., 2012a, 2011, 2012b; Gomez-Barrero et al., 2015, 2013; O’Reilly and Plamondon, 2009; Plamondon et al., 2014). In particular, the sigma-lognormal model (O’Reilly and Plamondon, 2009) analytically decomposes the complex movement into a linear combination of lognormal strokes. Based on lognormal parameters, it is possible to obtain a robust mathematical framework, able to exploit the intra-personal variability of a signature from both a neuroscience and a computational point of view. This chapter uses these perspectives for duplicating on-line signatures derived from real on-line reference specimens in order to synthesize human-like intra-personal variability, related to both the signature shape and its kinematic properties. This biological and neuromuscular model has been used in two ways to generate on-line duplicated signatures: the former consists of modifying all the sigma-lognormal parameters by which a single stroke is re-defined and duplicated; the latter modifies the strokes by perturbation of the target points of their action plan with a cognitive inspired distortion and
62
On-Line duplicated signature generation from on-line real samples
rebuilding the signature. Each approach, called the stroke-wise and the target-wise method respectively, has the property of generating human-like duplicate signatures with a realistic intra-personal variability.
5.2
Generation of duplicated signatures
Two methods are proposed for duplicating the reference signature: a stroke-wise sigmalognormal parameter distortion method and a target-wise sigma-lognormal action plan distortion method. In each method, the lognormal signature parameters are modified bi, b bi , σbi , θbsi , θbei ) - to mimic from only one real specimen the human signature Pi → Pbi = (D t0i , µ intra-personal variability. One of the major advantages of the sigma-lognormal model is its use for the neuromuscular decomposition of the movement into elementary strokes and the recovery of the initial action plan. This enables us to generate new trajectories by keeping the intra-personal variability at stroke level, instead of altering the observed trajectory. In this work, the number of strokes of the original signature is not modified, only the parameters that define a stroke.
5.2.1
The sigma-lognormal model for signatures1
Signature pre-processing Standard signal pre-processing was carried out for dynamic signatures captured by any device such as LCD touch pad, Wacom, handheld, etc. The pre-processing prepared the signatures for subsequent extraction of the sigma-lognormal model parameters. This consisted of three consecutive steps applied to each component trajectory. 1) Trajectory resampling: Each component was resampled at 200 Hz, which was the suggested sample rate for extracting the sigma-lognormal model data. As such, the original time sequence was artificially substituted with a new one sampled at 200 Hz and based on cubic spline interpolation. 2) Trajectory smoothing: Next, a Chebyshev filter was applied to the interpolated trajectory. The filter enhanced the signals, therefore removing the particular noise often introduced by the capturing device. 3) Trajectory enlarging: For 200 ms at 200 Hz the initial and the final sampling points were repeated both for the horizontal and vertical signals independently. This third step 1 Note
that this section is not a direct contribution of this Thesis. Instead, it is presented as a brief review of sigma-lognormal model since this model is the design basis of the proposed duplication methods.
63
5.2 Generation of duplicated signatures
introduced a null velocity during the first and last 200 ms and led to an improved extraction of the first and the last stroke parameters. Sigma-lognormal parameter extraction The kinematic theory of rapid human movements describes a movement as resulting from the controlled activation of the impulse response of a neuromuscular system, which is modelled through the vector summation of lognormal functions (O’Reilly and Plamondon, 2009; Plamondon and Djioua, 2006; Plamondon et al., 2014). Each component of the trajectory is analysed individually. Note that in this context the term component refers to the trajectory between the beginning and the end of a pen-down movement. A component is usually composed of several elementary strokes hidden in the signal. Each stroke {Pi }i=n i=1 was represented by one parametrized lognormal, n being the total number of strokes made during the execution of one component. The theory assumes that each individual impulse during the signature starts by executing the ith lognormal movement at time t0i by inputting a command Di into the neuromuscular system. The execution of this movement depends on the timing properties of the neuromuscular network activated, which is represented by the parameters µi the log-time delay and σi , the log-response time. It is also assumed that the movement of a single stroke occurs along a pivot with respect to a starting angle θsi and an ending angle θei . In total, each stroke is described in 2D space by six sigma-lognormal parameters: Pi = (Di ,t0i , µi , σi , θsi , θei ). The velocity of the complete handwriting movement is considered as the vector summation of the individual stroke velocities ⃗v(t) = ∑ni=1⃗vi (t), where the magnitude |⃗vi (t)| and direction φi (t) of each stroke is described as: � � Di (ln(t − t0i ) − µi )2 |⃗vi (t)| = √ exp − 2σi2 2πσi (t − t0i ) θe − θsi φi (t) = θsi + i Di
Z t 0
|⃗vi (τ)|dτ
(5.1)
(5.2)
A central part of the framework is the fully automatic extraction of the stroke sequence P = {P1 , . . . , Pi , . . . , Pn } from observed pen tip velocity profiles. The algorithm (O’Reilly and Plamondon, 2009) is based on two main steps. In the first step, it localizes the strokes Pi using the original velocity ⃗v(t). A local maximum is identified in the speed profile along with neighbouring inflexion points and minima. To identify a stroke, the maximum speed and the area under the curve have to be greater than a certain threshold. The second step extracts the analytical parameters of each identified stroke on the basis of zero crossings of the first and second derivatives of the
64
On-Line duplicated signature generation from on-line real samples
lognormal equation. The result of this Robust XZERO (RX0 ) estimator is further improved with non-linear least squares curve fitting. These two steps are repeated until the quality of the stroke sequence cannot be further improved. The quality of the extraction process is estimated with respect to the squared Euclidean distance between the original velocity⃗vo (t) and the reconstructed velocity ⃗vr (t) expressed as the Signal-to-Noise Ratio (SNR): R te
SNR = 10 log
ts
R te ts
|⃗vo (τ)|2 dτ
!
|⃗vo (τ) −⃗vr (τ)|2 dτ
(5.3)
The time ts is the start time and te the end time of the trajectory. High SNR values indicate high reconstruction quality of the speed profile. We refer the reader to (O’Reilly and Plamondon, 2009) for more details on the neuromuscular representation framework. Signature reconstruction The trajectory of the analytical signature is obtained component by component. It can be reconstructed by the following equations: n
n
vx (t) = ∑ |⃗vi (t)| cos(φi (t)), vy (t) = ∑ |⃗vi (t)| sin(φi (t)) i=1
(5.4)
i=1
Z t
x(t) = 0
Z t
vx (τ)dτ, y(t) =
0
vy (τ)dτ
(5.5)
Because the trajectory of each component is extended during pre-processing to improve the parameter extraction, the first and final 200 ms are ignored for both x(t) and y(t). Once all trajectory components were processed, to build the whole signature, each component is joined, starting at the same time and position as in the original signature. This guarantees the coincidence between the initial point of the original and the reconstructed signatures.
5.2.2
Method 1: Stroke-wise distortion method
In this method, the intra-personal variability is artificially introduced by changing the sigmalognormal parameters stroke by stroke. Three sources of variability are employed in this model: temporal, spatial and neuromuscular. All the perturbations are based on Gaussian noise.
5.2 Generation of duplicated signatures
65
• The neuromuscular intra-personal variability is achieved by distorting the parameters related to the neuromuscular execution of the stroke: bi = N (µi ; (µi · dµ )2 ) µ
(5.6)
bi = N (σi ; (σi · dσ )2 ) σ
(5.7)
• The intra-personal variability regarding the motor command time occurrence of each stroke is generated by: b t0i = t0i + N (0; (dt0 )2 )
(5.8)
• To represent the geometrical intra-personal variability in each stroke, a deformation is applied to the magnitude and stroke direction as follows: b i = N (Di ; (Di · dD )2 ) D
(5.9)
θbsi = θsi + N (0; (dθs )2 )
(5.10)
θbei = θei + N (0; (dθe )2 )
(5.11)
As extreme values of the normal distribution could distort the human-like appearance of the duplicated specimens, the randomly generated values are clipped in the range of twice the standard deviation of the Gaussian which comprises 95 % of the distribution. Once a new sequence of strokes parameters Pbi is obtained, the duplicated signature is reconstructed according to the ΣΛ equations (5.1)(5.2),(5.4) and (5.5). Each duplicated component starts at the same position as the original one. A similar method was proposed in (Galbally et al., 2012b) in the context of fully synthetic generation of flourish like signatures. In this chapter, the stroke-wise distortion method allows us to generate duplicated specimens from a real signature that contains a flourish and text. The automatic signature verifiers will be tested with real signatures, which is a difference with respect to (Galbally et al., 2012b) since training and testing is performed only with synthetic signatures in that study. It is worth mentioning that the main difficulty in our work is the incorporation of duplicated signatures into real biometric signature verification processes since the duplicates have to be generated by fitting the peculiarities of the intra-personal variability of real people.
66
5.2.3
On-Line duplicated signature generation from on-line real samples
Method 2: Target-wise distortion method
An advantage of the ΣΛ model is the extraction of parameters which allows us to recover the virtual target points of the action plan used to generate a given trajectory (Plamondon and Srihari, 2000). Virtual targets are defined as the end points of the strokes when executed in isolation. A signature is the result of multiple overlapped strokes. Therefore, in most cases, the writing instrument does not reach the virtual points, except for the last stroke, which ends at its corresponding virtual target. The model introduced in (Diaz-Cabrera et al., 2014a) suggests that the sinusoidal mapping of the target points generates a human-like variability for obtaining a new signature sample. This concept is combined with the lognormal formulation by applying such a sinusoidal transformation to the virtual target points as follows: xbV T = xV T + Ax sin(ωx xV T + φx )
(5.12)
ybV T = yV T + Ay sin(ωy yV T + φy )
(5.13)
where the real virtual target point coordinates are denoted by (xV T , yV T ) and the duplicated ones as (b xV T , ybV T ). (Ax , Ay ) refers to the amplitude of the sinusoid, (ωx , ωy ) to the oscillation frequency and (φx , φy ) to the phase. Figure 5.1 illustrates the geometrical consequence in the action plan when a virtual target is moved. Accordingly, Di , θsi and θei are modified by using λ = δ2 /δ1 and the rotation angle α, as depicted in Figure 5.1. b i = Di · λ D
(5.14)
θbsi = θsi + α
(5.15)
θbei = θei + α
(5.16)
The sigma-lognormal parameters related to the neuromuscular intra-personal variability and the motor command time occurrence of every stroke were modified in accordance with the Normal distribution defined in equations (5.6), (5.7) and (5.8). All parameters were modified anew in this second method. As the initial point of every component changes its position because of the pen-up to pendown transition, this procedure introduces a certain variability to the component trajectory positioning. Finally, this algorithm also introduces a realistic variability to the original skew of the whole signature with respect to ascenders and descenders. The parameters regarding with this deformation were previously optimized in (Diaz-Cabrera et al., 2014a).
5.3 Model Validation
67
Fig. 5.1 Computation of the scale factor and rotation angle when a virtual target point is sinusoidally translated from point (1) to point (2).
5.3
Model Validation
We have studied this method on six publicly available on-line signature databases that are widely used in the literature. The main differences among these databases were the acquisition protocol, the geographical location and registering device. In the following, the databases used in this chapter are briefly described in chapter A, which are SUSIG-Visual and SUSIG-Blind sub-corpus (Kholmatov and Yanikoglu, 2009), SVC-Task1 and SVC-Task2 sub-corpus (Yeung et al., 2004), MCYT100 sub-corpus (Ortega-Garcia et al., 2003) and SG-NOTE database (Martinez-Diaz et al., 2014). All signatures were initially reconstructed in the sigma-lognormal domain. The average quality of all signature reconstruction is 19.75 dB ± 3.05 in terms of the SNR. Previous studies (Djioua and Plamondon, 2009) have shown that an SNR greater than 15 dB is sufficient for reconstructing rapid human movements. As the result show, the reconstructed signatures can conveniently represent their original version. This way, they will be used as reference specimens for a performance-based evaluation. In order to unify all database conditions, the pen-up components were omitted. This does not affect the validity of the experimental assessment as the kinematics of the pen-downs and pen-ups are similar. Moreover, it enables us to work in a more realistic domain since the current handheld devices do not register pen-ups. On the other hand, three different dynamic automatic signature verifiers were used during the experiments. They were based on completely different features and matchers. These systems allowed us to study the impact of our method across different technologies belonging to the current state-of-the-art, which are: System A: DTW-based verifier (Diaz et al., 2015b; Fischer et al., 2015), System B: Manhattan distance based verifier (Sae-Bae and Memon,
68
On-Line duplicated signature generation from on-line real samples
2014) and System C: HMM-based verifier (Fierrez et al., 2007). They are briefly introduced in annex A.
5.3.1
Single reference signature system set up
Depending on the training condition, a single automatic signature verifier can have different effective error rates. One of the main limitations of current systems is the number of training signatures required to learn the unpredictable level of intra-personal variability. The more signatures enrolled during training, the better the expected test performance. Nevertheless, in a real situation, it is often impractical to obtain many signature samples from a client, for example, in the context of banking applications. Therefore, to validate the duplication method to generate on-line signatures from real on-line samples, we explore the design of an automatic signature verification system using only one real reference signature per enrolled signer and some of its duplicates to train the systems. It is namely Single Reference Signature System (SRSS) in the rest of the chapter. The SRSS needs to set up several variables. These variables are (dD , dt0 , dµ , dσ , dθs , dθe ) for both stroke-wise and target-wise methods. These values are optimized experimentally using the SUSIG Visual sub-corpus database and the DTW-based verification. These values are set by looking for the best trade-off among the following three criteria: i) Optimum performance of the SRSS. The performance is measured in terms of Equal Error Rate (ERR)2 of the SRSS for different values of the variables and the number of duplicates. As is usual in forensic environments, the skilled forger test is prioritized over the random one. ii) Minimum computational load. This criterion is tied to the number of duplicates which increases the computational load due to the cost of both duplicating the signature and classifying. In the case of the DTW, the training computational load increases quadratically with the number of duplicates and the testing load increases linearly. The Manhattan-based and HMM systems have the same time relationships for the load during testing. The duplicates are used to find the optimal model parameters, which makes training take somewhat longer. iii) Human-like duplicates. To avoid duplicates beyond the natural intra-personal variability, the images obtained are visually checked to limit the variability of the system parameters. Once, the set up framework is established, the variables for the stroke-wise distortion method are obtained as follows: 2 The
Equal Error Rate (EER) represents the operating point when the Type I and II Errors are coincident, i.e. False Rejection Ratio (FRR) and False Acceptance Ratio (FAR) respectively.
69
5.3 Model Validation
Table 5.1 SUSIG-Visual EER (%) results training with the first signature plus duplicates; stroke-wise distortion method and DTW-based verifier. Real
Dup.
1 1 1 1 1 1 1 1 1
0 2 4 8 16 32 64 128 256
0 8.09 3.28 2.38 2.51 2.68 3.11 3.15 3.23 3.11
0.005 8.09 2.94 2.26 2.04 2.51 2.89 3.06 3.06 3.11
Random Forgery Test dD , dθs , dθe 0.015 0.025 0.05 8.09 8.09 8.09 3.36 2.85 2.77 2.60 3.06 2.17 2.60 2.81 2.38 2.77 2.51 2.55 2.94 2.51 2.77 3.11 3.06 2.68 3.28 3.32 2.68 3.15 3.06 2.85
0.1 8.09 2.26 2.34 2.34 2.13 2.13 2.43 2.55 2.77
0.2 8.09 2.60 2.94 2.72 2.13 1.49 1.53 1.83 1.96
0.4 8.09 4.30 3.91 3.87 3.11 3.11 3.23 3.28 3.23
0 15.53 10.85 9.47 8.83 9.68 10.53 10.85 12.13 12.34
0.005 15.53 10.74 10.85 9.36 9.68 10.43 10.85 11.70 12.45
0.015 15.53 11.38 10.96 9.47 10.00 10.21 10.96 11.81 12.23
Skilled Forgery Test dD , dθs , dθe 0.025 0.05 15.53 15.53 10.21 8.94 8.94 8.72 8.72 8.62 9.36 8.83 10.21 9.47 10.64 9.68 11.91 10.32 12.66 11.49
0.1 15.53 9.26 8.83 8.62 8.19 7.45 7.98 8.83 8.94
0.2 15.53 8.19 8.19 8.09 7.34 7.55 7.43 7.34 7.45
0.4 15.53 8.62 8.40 8.30 7.98 7.87 7.55 7.34 7.34
1. The variables (dt0 , dµ , dσ ) are fixed to the values optimized in our preliminary study (DiazCabrera et al., 2015), i.e dµ = dσ = 0.1 and dt0 = 2.5. 2. The search space for the remaining parameters (dD , dθs , dθe ) is simplified by applying the same deformation levels to each of them. 3. Table 5.1 shows the performance of the SRSS for a grid of (dD , dθs , dθe ) values and a different number of training duplicated signatures. It can be seen that there is a minimum in the error surface around 32 duplicates and dD = dθs = dθe = 0.2 in the random forgery scenario. For a skilled forgery the minimum is reached around dD = dθs = dθe = 0.2 and 128 duplicates. 4. Figure 5.2 illustrates that this procedure generates human like signatures up to dD = dθs = dθe = 0.1. 5. Looking for the minimum error in dD = dθs = dθe = 0.1 columns and taking into account the goal of reducing the computational load, a trade-off set up can be established in dD = dθs = dθe = 0.1 and 32 duplicates. 6. A double check was performed at this point in order to analyse the duplicate stability. Thus, the SRSS was run 10 times to obtain the following average performance and standard deviation: (EERRF = 2.33 %, σRF = 0.12) and (EERSF = 7.74 %, σSF = 0.20) for random and skilled forgery experiments respectively. For the target-wise distortion method, we followed the steps: 1. The parameters relating to the neuromuscular intra-personal variability were fixed heuristically to dµ = dσ = 0.025. Then, the search space was reduced to dt0 . 2. Table 5.2 shows the performance of the SRSS for a grid of dt0 values and a different number of training duplicates. In this case, the minimum error surface seems to be
70
On-Line duplicated signature generation from on-line real samples
Fig. 5.2 Variation in the appearance of the signatures as a function of distortion increase. The first row refers to stroke-wise distortion method in which dD , dθs , dθe are changed; the second row corresponds to the target-wise distortion method, in which dt0 is tuned. Table 5.2 SUSIG-Visual EER (%) results training with the first signature plus duplicates; target-wise distortion method and DTW-based verifier. Real
Dup.
1 1 1 1 1 1 1 1 1
0 2 4 8 16 32 64 128 256
0 8.09 8.60 7.32 6.55 5.45 5.36 5.19 4.98 4.72
0.005 8.09 7.45 7.36 7.49 6.13 5.74 5.15 4.68 8.43
0.015 8.09 6.26 5.91 4.34 4.17 3.70 3.53 3.83 3.57
Random Forgery Test dt0 0.025 0.05 8.09 8.09 4.68 3.62 4.13 2.72 3.79 2.17 3.40 1.45 3.40 1.49 3.45 1.62 3.40 1.74 3.23 2.21
0.1 8.09 4.98 3.83 3.45 3.40 3.23 3.40 3.40 3.49
0.2 8.09 4.51 4.77 4.72 5.96 6.94 7.57 7.02 8.43
0.4 8.09 6.68 8.26 10.85 12.26 13.11 14.38 15.53 16.26
0 15.53 11.81 11.28 9.79 9.79 9.68 10.11 10.21 9.89
0.005 15.53 11.91 10.74 10.85 9.79 9.68 9.36 9.26 7.77
0.015 15.53 12.13 11.17 10.11 9.68 8.30 8.09 8.19 10.00
Skilled Forgery Test dt0 0.025 0.05 15.53 15.53 12.66 9.26 13.40 8.30 14.15 7.66 14.36 7.34 13.51 7.02 12.02 6.60 11.06 6.60 16.91 6.47
0.1 15.53 8.72 7.77 7.45 7.23 7.13 6.81 6.60 6.70
0.2 15.53 10.11 9.26 8.30 7.98 8.30 8.09 8.09 7.77
0.4 15.53 10.11 9.79 9.47 8.72 8.62 8.72 8.62 8.62
around 16 duplicates and dt0 = 0.05 in the random forgery scenario and 64 duplicates and around dt0 = 0.05 for the skilled forgery. 3. The second row of Figure 5.2 suggests that this second procedure generates human-like signatures up to dt0 = 0.05. 4. Prioritizing the skilled forgery scenario over the random forgery as is usual in forensic environments, the set up can be stablished at dt0 = 0.05 and 64 duplicates. 5. Running the complete system 10 times at this operative point for a double check, we obtained (EERRF = 1.55 %, σRF = 0.08) and (EERSF = 6.67 %, σSF = 0.09) for random and skilled forgery experiments respectively. These results confirm the stability of the selected operative points.
5.3.2
Visual Turing test validation
The human capacity to distinguish our duplicated signatures from real specimens has been evaluated through a visual Turing test. This consists in measuring the human ability to distinguish between real and computer duplicated signatures. With this aim, a number of pairs of signatures were showed to different volunteers. In each pair, the first was the
5.3 Model Validation
71
reference signature and the second was a duplicate of the given reference signature. Each volunteer was questioned about the authorship of the second one, i.e. whether the second one was duplicated by a human being or by a computer. In this one-by-one process, the reference signature was the same for each of 5 consecutive questions. Similarly to (Ferrer et al., 2015; Galbally et al., 2012a; Lake et al., 2015), a set of 100 questioned specimens composed of 50 signatures written by real human beings, 25 duplicates following the stroke-wise method and 25 duplicates made on the basis of the targetwise method were judged by 100 non-forensic volunteers from several Western countries. Figure 5.3 shows a subset of this experiment. Once the questioning had been conducted, different measures were carried out to evaluate the distinguishability of human and machine made duplicates. These measures are described through the following type of error rates: • False Stroke-Wise Rate (FSWR): Error of misjudging a duplicated signature designed by the stroke-wise algorithm as real. • False Target-Wise Rate (FTWR): Error of misjudging a duplicated signature designed by the target-wise algorithm as real. • False Real Rate (FRR): The average between FSWR and FTWR.
Fig. 5.3 Visual Turing test subset. No asterisk means signatures made by human beings, * means duplicated with the stroke-wise method and ** means duplicated with the target-wise method.
72
On-Line duplicated signature generation from on-line real samples Table 5.3 Visual Experiment Results FSWR
FTWR
FRR
FDR
ACE
50.78 %
52.33 %
51.56 %
51.59 %
51.57 %
Table 5.4 EER (%) comprehensive evaluation using the first enrolled real signature per user for training. SW denotes the stroke-wise duplication method and TW the target-wise. System A: DTW-based [7][24] Random Forgery Skilled Forgery BL∗ SW TW BL SW TW SUSIG-Visual 8.09 2.13 1.62 15.53 7.45 6.60 SUSIG-Blind 9.45 1.91 1.54 13.75 5.68 5.22 SVC-Task1 10.50 4.00 1.50 29.13 17.25 17.88 SVC-Task2 8.10 1.90 0.50 23.66 18.25 18.63 MCYT100 12.48 5.04 4.04 23.20 13.72 13.56 Mobile 12.80 2.06 1.03 ∗ BL means baseline Database
System B: Manhattan-based [33] Random Forgery Skilled Forgery BL SW TW BL SW TW 46.85 11.36 12.64 8.51 5.53 5.85 52.14 8.05 8.86 13.64 8.52 8.64 44.00 13.60 15.20 29.50 27.88 28.25 42.50 10.40 12.80 28.00 25.00 27.88 56.32 10.20 10.96 33.88 20.36 21.36 47.20 10.72 11.04 -
System C: HMM-based [28] Random Forgery Skilled Forgery BL SW TW BL SW TW 11.98 4.76 4.32 40.96 30.64 31.60 7.19 2.86 2.76 31.25 18.07 18.52 10.79 8.16 5.53 33.25 27.00 24.12 7.50 3.81 3.68 31.88 22.38 23.88 14.62 5.79 5.66 31.96 16.32 16.24 9.05 2.35 2.73 -
• False Duplicated Rate (FDR): The error made when a duplicated signature is judged as real. • Average Classification Error (ACE): Measured in global terms, the average between FRR and FDR. For all these error rates, 50 percent means that the real and duplicated signatures cannot be told apart. These error rates are given in Table 5.3. For both stroke-wise and target-wise duplicates, the artificial signatures were considered as real in more than 50 % of the cases, which means that human beings were not able to distinguish duplicates from real signatures. In summary, these results clearly emphasize the human likeness of the generated duplicates.
5.3.3 Intra-personal variability evaluation of the duplicated signatures The results of the SRSS when tested against three standard automatic signature verifiers on six publicly available, on-line signature databases with the two duplication methods are illustrated at Table 5.4. To establish a fair comparison, all verifiers had the same configuration for all databases and only the first registered signature per user was used for training in each case. The baselines were obtained by training with only one enrolled signature, without duplicates. “System A”. Excellent results are obtained in the random forgery mode, the best being achieved with the SVC-Task2. This observation is reinforced by the skilled forgeries results, where we obtain the best results with the SUSIG-Blind subcorpus. It is also worth pointing out that in this system, target-wise (TW) method performs slightly better than stroke-wise (SW) for all databases in random forgery and for three out five in skilled forgeries.
5.4 Conclusion
73
“System B”. Relevant improvements are obtained in all cases for random forgeries. The most relevant effect is shown again in SUSIG-Blind subcorpus. Note that this database was not used to fine-tune the system, but only as a testing database. Moreover, we can observe that skilled forgery, the most difficult and relevant test, also improved on the baseline performance. Although the improvements are not as impressive as in random forgery, the performance is not impaired in any case. Additionally, although a comparison between SW and TW performances lead to obtaining similar findings, we can observe that the SW method achieves a better performance for the SVC-Task1 and SVC-Task2 databases. “System C”. The potential of the designed SRSS is proven. All cases show notable improvements in random forgery. Although the TW only slightly improved the results, the best performance was given by the Mobile database with the SW method. In the case of skilled forgeries, the performance was also reduced for both duplication procedures, the TW method being a little better than for the SVC-Task1. In general terms, experimental results highlight the robustness of the SRSS since the common tendency observed in all cases is that both duplication methods give improvements in all cases with respect to the baseline. Also, we could say that both duplication methods (SW and TW) perform in a similar way, thus highlighting a coherent improvement for both random and skilled forgery tests. Additionally, this is graphically illustrated in Figure. 5.4 with the ROC curves for both random and skilled forgery tests. So it is possible to conclude that both duplication methods mimic in a reasonable way the intra-personal variability of the different databases which is the basic requirement for an efficient single reference signature system. The maximum impact on performance is provided by the DTW-based system.
5.4 Conclusion In this chapter, it is presented a theoretical and experimental, novel procedure to generate intra-personal variability from the synthetic generation of duplicated on-line signatures from only one real on-line signature. The duplicated specimens were produced from a neuromuscular model based on the kinematic theory of rapid human movements, and its sigma-lognormal parameters. This is one of the most mature models widely used in pattern analysis applications and verification systems. Two methods were presented to generate human-like duplicated signatures: the first is based on stroke-wise distortion, whereas the second pursues a target-wise distortion, directly applied to the position and orientation of the action plan. Experimental results have revealed that these approaches generate duplicated samples which are indistinguishable, as is demonstrated by a visual Turing test. Also, a performance-based test studied the behaviour of the SRSS on multiple public databases and
74
On-Line duplicated signature generation from on-line real samples
(a) Random Forgery Test
(b) Skilled Forgery Test
Fig. 5.4 ROC curves for random and skilled forgery tests using 3 verifiers and 6 databases. Systems A, B and C are the DTW, Manhattan and HMM based classifiers respectively.
5.4 Conclusion
75
several state-of-the-art automatic signature verifiers. Although our results were competitive, to achieve a more accurate estimation of the intra-personal variability in order to cope with skilled forgeries, more research is needed. Finally, this novel framework opens the door to new competitions on signature verification using a single signature as reference. Also, it leads to work on signatures registered in several scenarios such as Wacom-like or handheld devices, where the dynamic features and the precision of the frame rate is not as accurate as the signatures from tablets or LCD devices (Martinez-Diaz et al., 2014). This suggests the possibility of using handheld tablets for personal authentication in e-security problems where only one reference sample is available.
Chapter 6 Unified framework for fully synthesis of on-line and off-line signatures 6.1
Introduction
This chapter is quite different to the previous ones. Chapter 3, 4 and 5 studied methods to generate of duplicated samples from real specimens. It could be said that real signatures were required. However, in this chapter we do use neither real signature nor information of a particular user. Instead we use statistical models given in Chapter 2 as initial knowledge to generate synthetic signatures. Specifically, in this chapter it is developed a human like model for signature synthesis inspired by motor equivalence theory (Marcelli et al., 2013; Wing, 2000). The signature synthesizer includes synthetic signature definition with text and flourish, the generation of genuine signatures and of forgeries with both static and dynamic patterns. Pen-ups are also included. The databases generated with this synthesizer produce simultaneously coherent performance results in the static and dynamic domains. As far as we know, this is the only signature synthesizer that includes all these features. The procedure proposed in this chapter, which is illustrated at Figure 6.1, can be summarized as follows: first, the synthetic user signature morphology is defined. Second, we define a user grid, based on the cognitive map. Third, it is represented the name and flourish engrams as a sequence of grid nodes and their stroke limits, including pen-ups. Fourth, the signature trajectory is designed by applying a motor model to the signature engram. Fifth, from the signature trajectory, it is generated the dynamic signature by lognormal sampling of the signature trajectory. Finally, it is generated multiple samples and forgeries that mimic the performance of real databases.
78
Unified framework for fully synthesis of on-line and off-line signatures
Fig. 6.1 Block diagram of the motor equivalence theory approach. The blue skeletal picture was extracted from www.strath.ac.uk/humanities/psychologicalscienceshealth
6.2 Generation of fully synthetic signatures
6.2
79
Generation of fully synthetic signatures
Generating a synthetic signature is equivalent to designing the signature morphology which is the language model needed to generate readable synthetic names, the signature components such as text and flourish and the relation between them such as the components’ order and connection rules (Diaz-Cabrera et al., 2015; Ferrer et al., 2015). Specifically, this proposal considers the following components in a synthetic signature. I: capital initial letter of the text, T : text of the readable part of the signature, Fm: main flourish and Fs: secondary flourish. Possible sequences of these elements are defined by means of a vector called Morphology = {Fm, Fs, I, Fs, T, Fs, Fm}. The connections are defined in the vector Connection. If Connection(k) = 1, then Morphology(k + 1) the component is connected to the previous component, otherwise it is disconnected. For instance, a signature with a small flourish at the very beginning followed by a connected initial, a space and the rest of the name connected with a flourish is defined as Morphology = {∼, Fs, I, ∼, T, ∼, Fm} and Connection = [0, 1, 0, 0, 0, 1]. The components of these vectors were worked out randomly from different probability density functions according to functions described in chapter 2. Likewise, the number of words per signature and letters per word, the slant, skew, number of corners of the main and secondary flourishes, velocity for the production of genuine signatures and forgeries, stroke time dispersion, text to flourish width ratio and flourish to text center ratio have also been modeled for each dataset (Diaz-Cabrera et al., 2015). These values are worked out randomly for each synthetic user. The text of the synthetic signatures is based on a simple language model which alternates consonants and vowels. The probability of repeating a consonant and a vowel is fixed at 0.95. The probability of using any letter is obtained from its frequency of appearance in the English language. So we obtain realistic texts which are readable but avoid real names because of potential privacy concerns.
6.2.1
The cognitive plan: signature engram
The signature engram is described in three steps: text, pen-ups and flourish engrams. Text engram In our implementation, the engram sequences of every Latin alphabet letter have been defined in three parts: prefix, body and suffix. The prefix means a ligature added to the beginning to connect the body with the previous letter. The body defines the individual isolated letter and
80
Unified framework for fully synthesis of on-line and off-line signatures
the suffix also connects the body to the next letter. If the body of the letter is not connected, the prefix and suffix are not used. Different prefixes, bodies and suffixes for each letter were generated. Each letter engram definition includes a stroke division which means the nodes where the pen velocity will be the minimum in the synthetic velocity profile. These were defined by inspecting recorded samples of each letter and examining minima in the velocity profile. Note that these trajectory points are not necessarily related to the cortex action plan. This procedure is loosely based on equivalence model theory but it does not pretend to model it. Pen-up engrams Once the text engrams are defined, it is necessary to define the pen-up engrams, i.e. the trajectory which represents the pen being lifted between written strokes. Pen-up trajectories can be divided into three zones: the start or source area, the intermediate area and the sink area. 1. The source area is located around the end of the previously written stroke. When the pen is lifted, sometimes it displays a degree of hesitation until it begins the transition to the start of the next stroke. 2. The intermediate area is defined by the trajectory from the source area to the sink area. 3. The sink area is located around the beginning of the next written stroke. Just before the pen starts to write, a randomly made decision about the precise point at which to start creates variability for the end of the trajectory in that area. The proposed pen-up model defines the source area as a circle around the end of the first stroke. After manually examining many pen-up trajectories in different databases, its radius is heuristically set to d/10, d being the pen-up distance. The sink area is a similar circle, centered on the beginning of the second stroke. The intermediate area is a rectangle that links the source and sink areas. The model is illustrated at Figure 6.2. A number of grid nodes are randomly selected inside each area. The number of nodes defines the hesitation after lifting the pen. The more nodes, the more hesitation has occurred. Heuristically, to choose one or two nodes per area is usually sufficient to obtain realistic pen-up trajectories. An example of a pen-up engram linking a disconnected stroke with a node area is shown at Figure 6.2. The letters with delayed strokes, due to a diacritical mark, e.g. the “i” or “t”, require a pen-up when they are written. After analyzing the parameterized human behavior in the available databases, the synthesizer writes the delayed stroke after the next pen-up which
6.2 Generation of fully synthetic signatures
81
Fig. 6.2 Left: Areas for pen-up engram definition. Center: pen-up engram linking two letters. The grid nodes selected are marked by green circles. Right: Text with diacritic marks which are written along with the following pen-up. Letters in continuous blue lines and pen-ups in dashed red lines. could be due to a non-connected letter or word ending. When several diacritical marks have to be written, they are written from left to right. An example is shown at Figure 6.2. Flourish engram Once the text engram is defined, the tessellation is spanned to include the flourish nodes. The flourish engram is defined as a sequence of grid nodes inside a generated envelope, which limits and shapes the spanning area. Consequently, the signature envelopes do not affect the generation of signatures without a flourish. The envelope is synthesized for each signer by means of an Active Shape Model (ASM) (Cootes et al., 1995). Keeping to a more general envelope model, the ASM has been trained with the MCYT-75 Off-line Signature DB (Fierrez-Aguilar et al., 2004; Ortega-Garcia et al., 2003) which is the database with the most signatures with flourishes and different text-flourish configurations. In section 2.2 we could find a more extensive explanation about building this ASM. The mass center of the ASM envelope is displaced to match the geometrical center of the text engram. Then it is scaled to fit the text to flourish width ratio and displaced to fix the flourish to text center ratio. The nodes of the flourish engram are then obtained by randomly selecting the nodes inside the envelope, with the following two conditions: 1) the lines that link the nodes are not allowed to intersect the signature envelope; and 2) the vertex angle of each node is less than 90º. In this way, the flourish corners are considered stroke limits. If the text and flourish are connected, the end of the text engram and the beginning of the flourish engram are linked.
82
Unified framework for fully synthesis of on-line and off-line signatures
Fig. 6.3 Activity of several arm muscles in the transition from text to flourish of a real user while signing
6.2.2
Motor control: signature trajectory
Once the signature engram is defined, an inverse model for motor control is applied to obtain a realistic human signature ballistic trajectory. To achieve this, the engram nodes are linked by 8-connected Bresenham’s lines and inertial moving average filters are applied to these lines. The way the filters are applied to the engram is worked out after recording and analyzing the electromiographic (EMG) signals of six volunteers while they were writing a signature. The normalized muscle activity RMS curves were obtained by using a similar procedure to that in (Farina and Merletti, 2000). For example, Figure 6.3 shows the RMS curves per muscle of one of the volunteers while signing. After undertaking a clustering study of muscle activity, based on k-means, it became clear that there are three basic ensembles of muscles, the activity of which depends on the kind of handwritten stroke. The first ensemble is active during the whole signing process, the second ensemble is more active during the handwriting of short strokes whereas the third ensemble is more active during the longer strokes. This conclusion leads us to a multilevel motor scheme which is modeled by motor inertial filters as follows: i) a so-called fine motor control filter is applied to the shorter strokes which are the slowest ones with lesser inertia, ii) a so-called gross motor control filter is applied to the longer strokes which are the fastest with greater inertia and iii) the whole signature is filtered by the so-called global motor control filter. This procedure is illustrated at Figure 6.4. The signature trajectory is worked out as follows: The fine motor control filter is applied to the line segments belonging to the shorter strokes and stops at every stroke limit. The gross motor control filter is applied to the rest of the engram and stops at each pen-up and
83
6.2 Generation of fully synthetic signatures
Fig. 6.4 Multi-level motor control model inspired by inverse internal models. Solid blue line: written signature, dashed red lines: pen-ups, green circles: stroke limits. pen-down. The result is filtered by the global motor control filter to obtain the ballistic trajectory, as shown at Figure 6.4. We used Kaiser filters with a symmetric finite impulse response ht [n] defined as:
t
h [n] =
� � q 2 2n −1 I πβ 1− ( N−1 ) 0 I0 (πβ )
0
0 ≤ n ≤ N −1 (6.1) otherwise
Where β is a shape factor chosen randomly between [0, 0.5] and N the filter length, which is related to the signing velocity: the higher the signature velocity, the longer is the filter N value. The signature velocity is obtained by randomly following its probability density function, modeled as a generalized extreme value (GEV) distribution (Kotz and Nadarajah, 2000). The values of the GEV parameters are estimated by maximizing their likelihood given the velocity of all the signatures. The velocity of each signature is calculated as the total length of the trajectory divided by the signing time. The worked out values for genuine signatures are {ξi , σi , µi } = {0.10, 2.20, 4.72} and for the forgeries {ξi , σi , µi } = {0.19, 1.74, 3.08}. As the GEV distributions run from −∞ to +∞, minimum and maximum values are established for these distributions: vmin = 1.50 cm/s and vmax = 10.00 cm/s for genuine signatures and vmin = 0.85 cm/s and vmax = 15.00 cm/s for forgeries. Thus, let vs be the randomly worked out signature velocity through the GEV distribution, the length for fine, gross and global inertia filters are obtained as N f = I f ×vs , Ng = Ig ×vs and Nw = Iw ×vs , I f and Ig respectively
84
Unified framework for fully synthesis of on-line and off-line signatures
being the distance between the grid nodes of the synthetic user, whereas Iw is the averaged distances between the flourish nodes. A drawback of this procedure is that the ballistic trajectory of straight strokes appears unnaturally written. This occurs mainly to the capital letters. This problem is alleviated by twisting the Bresenham’s line of longer straight strokes before filtering. The twisting consists in converting the straight lines to triangles. The triangle height is a constant for each writer in the heuristic range [0, d/10, d being the length of the straight stroke. An example of the results can be seen at Figure 6.4 for the capital letter “J”. After filtering, the static image of the signature is obtained by applying an ink deposition model (see Section 3.2.6) of a ballpoint pen to the trajectory (Ferrer et al., 2015, 2013b).
6.2.3
Signature dynamics
The dynamic information of the signature is obtained by lognormal sampling of the continuous trajectory. Each lognormal is characterized by its amplitude D, time of occurrence τ, the log time delays µ and the log-response time σ . The velocity profile of a stroke is then: v(t) = D1 Λ(t; τ1 , µ1 , σ12 ) − D2 Λ(t; τ2 , µ2 , σ22 )
(6.2)
where
Λ(t; τ, µ, σ 2 ) =
� � [ln(t−τ)−µ]2 √ 1 exp − t >τ 2σ 2 σ 2π(t−τ) 0
(6.3)
otherwise
Therefore, a means of generating realistic signature dynamic information is to sample the continuous signature trajectory in such a way that the reconstructed velocity profile closely matches a lognormal shape. This can be performed as follows: suppose that the temporal velocity of the stroke v(t) is described by just one lognormal (the agonist), since D2 ≈ D1 /10 (Plamondon, 2003) then: � � D [ln(t − τ) − µ]2 v(t) = √ exp − 2σ 2 σ 2π(t − τ) The distance at time t is given by the lognormal cumulative function: � � �� Z +∞ D ln(t − τ) − µ √ e(t) = vdt = 1 + erf 2 −∞ 2σ
(6.4)
(6.5)
6.2 Generation of fully synthetic signatures
85
Solving for t in the equation, the time in terms of the distance is given by: t(e) = exp
�√ � 2σ erf−1 (2e/D − 1) + µ
(6.6)
and the velocity in terms of distance can be worked out by substituting Eq. (6.6) into Eq. (6.4), thus obtaining: � √ � −1 D exp − 2σ erf (2e − 1) �√ � v(e) = √ σ 2πexp 2σ erf−1 (2e/D − 1) + µ
(6.7)
So the sampling procedure selects the pixels at e(nTs with Eq. (6.5), fs = 1/Ts being the sampling frequency. But Eq. (6.5) requires us to define the amplitude D, the log-time delay µ and the log-response time σ for each stroke. Firstly, these were obtained as random values inside the margins given at (Djioua and Plamondon, 2009) but the results were not perceptually realistic. Consequently, the skewness and kurtosis of all the individual lognormals were studied from the signatures of the aforementioned databases with ScriptStudio (O’Reilly and Plamondon, 2009). The results give an averaged skewness and kurtosis of 0.13 and 3.08 respectively which shows that the lognormals are generally located around the temporal center of the strokes because the kurtosis is close to 3. Moreover, a low positive skew to the left is observed since the skewness is near zero but positive. Additionally, for every stroke it is possible to calculate its length and time. The temporal duration of the whole signature can be calculated by dividing the signature length by the signature velocity, as worked out in section 6.2.3. The time taken for each stroke is obtained from the existence, as suggested by Neuroscience, of the so called Central Pattern Generator (CPG) (Gandadhar, 2006) which produces rhythmic patterned outputs without sensory feedback. Moreover, it has been suggested that the mammalian locomotor CPG comprises a “timer” which generates step cycles of varying duration and a pattern formation layer which selects and grades the activation of motor pools (Gandadhar, 2006). Therefore, if the stroke generation is simulated by the CPG step cycle, the duration of each stroke should be very similar. This has been verified using the MCYT330 corpus (Ortega-Garcia et al., 2003) signature database for which the dispersion of the temporal duration of strokes has been modeled as a GEV distribution with the parameters: {ξi , σi , µi ,tmin ,tmax } = {−0.21, 0.06, 0.29, 0.15, 0.50}. Consequently, the duration assigned to each stroke of the synthetic signature is worked out by dividing the whole signature duration by the number of strokes thus leading to the dispersion.
86
Unified framework for fully synthesis of on-line and off-line signatures
Lognormal sampling Once the stroke length ls is known and its time ts , its lognormal parameters can be obtained as follows. From Eq. (6.5) we deduce: � � �� D ln(ts − τ) √ ls = 1 + erf (6.8) 2 2σ As erf(3) = 1, a possible solution to Eq. (6.8) is: D = ls
(6.9)
√ µ = ln(ts − 3 2σ )
(6.10)
Furthermore, as the lognormals are centered in the middle of the stroke with a low 2 positive skew, their maximum or mode, defined by eµ−σ , is around ts /2 with a slight left skew. Therefore, it holds that: 2
kts = eµ−σ ,
0.4 < k < 0.5
(6.11)
Combining Eq. (6.10) and Eq. (6.11) we obtain: √ σ 2 + 3 2σ = ln(k) = 0
(6.12)
Thus, in the case of an isolated stroke of length ls and duration ts , the simplified approach lets us work out the lognormal parameters D as equal to ls (see Eq. (6.9)), σ as the positive solution of the simple second order Eq. (6.12), and µ by substituting σ in Eq. (6.10). This procedure is useful only for isolated strokes. In the case of a sequence of overlapping strokes, the parameters of each individual stroke are worked out separately by assuming that the overlapping doubles the length of each stroke. Then, from Eq. (6.7), the spatial velocity v(e) of each stroke is obtained and the signature velocity profile is calculated by summing the velocity of all the strokes, as in the case of the sigma lognormal model (O’Reilly and Plamondon, 2009) but in the spatial domain instead of the temporal. The synthetic signature trajectory is then sampled fromv(e) as follows. Let be xe and ye the coordinates of the 8-connected signature trajectory at a resolution of r dots per inch. The distance between samples in centimeters is worked out as: �q � 2 2 d(e) = 2.54 (xe − xe−1 ) + (ye − ye−1 ) /r (6.13)
6.2 Generation of fully synthetic signatures
87
Fig. 6.5 Synthetic dynamic version of the static signature of “Jane”. Consequently, the time the pen is over each signature spatial pixel is obtained as t(e) = d(e)/v(e). If t(e) > 1/ fm then it is set to t(e) = 1/ fm . Finally, the accumulated time along the signature trajectory is worked out and the trajectory is sampled by selecting the pixels for which the time is closer to multiples of 1/ fm , fm being the sample frequency. The accuracy of the signature trajectory sampling is estimated by comparing real and synthetic velocity profiles reconstructed from the signature trajectory. The SNR between both synthetic and real velocity profiles is 15.9 dB for the MCYT330 corpus (Ortega-Garcia et al., 2003). Summing up, from the synthetic signature trajectory which includes the stroke limits, we get each stroke length and temporal duration. Then, through Eq. (6.9), Eq. (6.10) and Eq. (6.12) we obtain the D, µ and σ lognormal parameters of each stroke and their spatial velocity profiles from Eq. (6.7) which are summed to build the whole signature spatial velocity profile. Knowing the velocity at each pixel, the time is also known, and the signature trajectory can be sampled. Figure 6.5 shows the realism of the synthetic dynamic information. We should mention that the values obtained for D, µ and σ lie within the parameters margins given at (Djioua and Plamondon, 2009).
88
Unified framework for fully synthesis of on-line and off-line signatures
Pen pressure modeling The pressure has been modeled as inversely proportional to the velocity, even though this is only partially true. Specifically, the pressure p(t), is obtained by inverting the normalized A-law compressed velocity vc(e) and translating it into the range of a WACOM commercial dynamic acquisition device which is [500 + U , 850 + U ], where U is a random variable with uniform distribution between [0, 150] worked out for each user. This procedure is formulated at Eq. (6.14). 0 p(t) = 2U
if VC−vc(e) VC
+ 500 + U
pen − ups
(6.14)
otherwise
where VC is the maximum of vc(e). Obviously, during the pen-ups, p(t) is set to zero. Following the WACOM pressure signal, the transition between pen-up/pen-down is found to be linear and 2 or 3 samples long. Figure 6.5 shows an example of a pressure profile.
6.3
Generation of duplicated signatures
The above procedures define the morphology, cognitive and motorial parameters for making the master signature of a synthetically defined identity. As an example, Figure 6.6 shows several fully synthetic signatures. The next step is to generate the intra-personal variability, i.e. by getting different samples each time the algorithm is executed. This section also addresses the generation of synthetic forgeries by mimicking the human procedure used for copying a signature. According to the generation methodology proposed in this chapter, a master signature is defined by the set of ϕ morphological, static and dynamic parameters defined in Sections 6.2, 6.2.1 and 6.2.2. The intra-personal variability is performed with so called variability variables vv that modify the signature parameters ϕ by changing randomly their value in the range [ϕ − ϕ × vv, ϕ + ϕ × vv] (Ferrer et al., 2015). A random set is applied for each user to keep the handwriting style consistent. As an example, Figure 6.7 shows several samples generated from master signatures.
6.4
Signature imitation
A forgery is the imitation of a person’s signature by a third party. A forgery generation method was proposed in (Ferrer et al., 2015) on the basis of increasing the intra-writer variability. This procedure usually works well in static signatures but the major drawback
89
6.4 Signature imitation
Fig. 6.6 Examples of dynamic signatures synthetically generated. Blue dots show pen-downs samples whereas red dots refer to pen-ups samples.
(a) Genuine
(b) Forgeries
Fig. 6.7 Examples of intra-personal variability: genuine samples (four columns on the left) and forgeries (four columns on the right)
90
Unified framework for fully synthesis of on-line and off-line signatures
Fig. 6.8 Left: Example of static signature trajectory (dotted black line) with the most relevant perceptual points marked by black dots, the perceptual points selected by the forger marked with green dots and the interpolated signature trajectory (blue continuous line). Middle: dynamic forgery (blue line with crosses showing the temporal samples) with pen-ups (dotted red line). Right: velocity profile of the forgery. of this procedure is that the imitated velocity profile is too similar to the original. It thus generates forgeries which are not credible. The procedure proposed in this work tries to emulate the actions of a human forger. Forgers start by examining the signature to be forged. It is supposed that the forger would pay more attention to the most relevant perceptual points of the signature trajectory. Such an idea is incorporated into the forgery generator which identifies the most relevant perceptual points before it interpolates them. These points have been worked out by the procedure proposed at (Brault and Plamondon, 1993) which is based on curvature. The result can be seen at Figure 6.8 as black dots on the signature trajectory. The longer the forger can spend deliberately examining the signature, the more perceptually relevant points he can identify to achieve a better imitation. This process is emulated by detecting as many relevant points as possible and randomly selecting between 70% and 90% of them. This allows us to obtain imitations of different qualities or accuracy. The selected perceptual points set up the stroke limits, thus changing the velocity profile of the genuine signer. The chosen perceptual points can be seen at Figure 6.8 marked with green dots. Although the forger tries to imitate the handwritten style, his cognitive spatial map is different from the genuine signer’s. This effect is duplicated by applying a sinusoidal transformation to the relevant perceptual points chosen. A similar transformation has been recently proposed in (Diaz et al., 2016; Diaz-Cabrera et al., 2014a) to duplicate signatures and has also been applied to handwritten CAPTCHA generation (Thomas et al., 2009). The sinusoidal transformation is applied as follows: Let x p and y p be the coordinates of the perceptual points, Lx the signature width and Ax and Px the amplitude and period of the x axis sinusoidal transformation respectively. Let Ly , Ay and Py be the corresponding variables for the y axis sinusoidal transformation. This transformation is defined as x′p = Ax sin(2πAx x p /Lx ) and x′p = Ay sin(2πAy y p /Ly ) where x′p and y′p are the new coordinates of the perceptual points. For each forged signature, new values of Lx , Ax , Px , Ly , Ay and Py are worked out within their respective margins, which are different for text and flourish.
6.5 Model validation
91
The trajectory of the imitated signature is calculated by interpolating the perceptually relevant points by a spline. The interpolation spline adjusts the chosen perceptual points plus 5 equidistant points between each pair. The pen-ups are added as mentioned in Section 6.2.1 but as the hesitation between strokes should be greater because of the uncertainty of the forger, we add more grid points in the source, transition and sink areas of the pen-up trajectory. The results can be seen at Figure 6.8. To sample the trajectory, the velocity is randomly obtained from the distribution given at Section 6.2.2 and the trajectory is lognormal sampled as described in Section 6.2.3. The results are also shown at Figure 6.8. In this case, the signature duration is increased from 3.08 s to 5.29 s and it can be seen that the velocity profile is more like that of an imitation. More examples of forgeries are shown at Figure 6.7.
6.5
Model validation
These experiments are aimed at assessing the ability of the synthesizer to produce a wide range of realistic signatures (see annex A for a detailed description). This is carried out by scoring its ability to generate synthetic datasets that approximate different real corpuses such as MCYT330 corpus (Ortega-Garcia et al., 2003), BiosecureID-Signature UAM subcorpus (Ortega-Garcia et al., 2010), NISDCC (Alewijnse et al., 2009; Blankers et al., 2009), SVC 2004 (Yeung et al., 2004), and the two SUSIG subcorpuses: Blind and Visual (Kholmatov and Yanikoglu, 2009). It is well known that these signature corpuses provide different performances since they are acquired with different devices, different protocols and in different geographical regions. Therefore, if for each of the real databases mentioned above, the synthesizer is able to generate a database that is similar to the corresponding real one, it would be proof of its capacity to produce a wide range of intra- and inter-personal variability. The closeness of two databases with the same morphology can be graded from the similarity between the DET curves obtained with synthetic and real databases. This we obtain through different Automatic Signature Verifiers (ASV) for both random and forgery scenarios with both static and dynamic versions. Specifically, we selected four classifiers, previously described in chapter A: two off-line (Geometric features + HMM. (Ferrer et al., 2005) and Texture-based + SVM. (Ferrer et al., 2012a)) and two on-line (DTW-based verifier (Diaz et al., 2015b; Fischer et al., 2015) and Manhattan distance based verifier (Sae-Bae and Memon, 2014)).
92
Unified framework for fully synthesis of on-line and off-line signatures
We chose these four ASVs on the basis of conceptually different features because they are expected to cover a wide range of signature properties and different variability of the signatures. Each classifier was tested against each dataset with the same configuration since our aim is not to obtain the best result with each dataset but to measure how the synthesizer deals with a wide range of human handwriting variability. Tuning up an ASV for optimum results means to focus on the more stable properties by trying to minimize the influence of the more variable ones. We have used a general configuration so as to consider the different variability sources in a balanced way. Additionally, all the verifiers are trained by following the same well-established experimental protocol as in (Ferrer et al., 2012a) in which the training set consists of 5 randomly selected genuine signatures. The remaining genuine signatures are used for testing the false rejection rate. The false acceptance rate for the random forgeries experiment has been obtained with the genuine test samples from all the remaining users whereas the false acceptance rate for the skilled forgeries experiment has been worked out with the forgery samples of each signer. All the experiments are repeated 10 times and the averaged results with their standard deviation are provided in terms of the Equal Error Rates (EERs) and DET curves.
6.5.1
Unified synthesizer set up
Setting up the synthesizer for generating databases that are similar to the real ones is conducted in the following steps. The parameters of the morphology of the real dataset are introduced into the synthesizer. Then we form the variability parameters for generating genuine static, forgery static, genuine dynamic and forgery dynamic signatures to reproduce as closely as possible the performance of the off-line random forgery, off-line skilled forgeries, on-line random forgeries and on-line skilled forgeries experiments consecutively. This procedure is iteratively repeated looking for the minimum square error between the eight EERs of the real and synthetic dataset. This procedure is based on the hypothesis that 1) the parameters used for generating the dynamics of the signature do not affect the performance of the static signature, but the opposite does not apply and 2) the parameters to generate genuine samples modify the performance of the skilled forgeries experiment, but not the opposite.
6.5 Model validation
93
Fig. 6.9 Visual Turing test Subset. For information, the synthetic signatures are marked with a cross.
6.5.2
Visual Turing test validation
A perceptual experiment were conducted to investigate the generator’s ability to produce humanlike signatures. In a similar way to (Ferrer et al., 2015; Galbally et al., 2012a; Lake et al., 2015), this is measured by showing non-forensic volunteers a set of real and synthetic images. The volunteers are not told whether the signature is real or synthetic. They are asked to score between 0 (very sure synthetic) and 10 (very sure human) the realism of the presented signature according to their impression, formed after a quick inspection of the signature. For this experiment, forty synthetic signatures were generated with real texts. They were combined with another 40 real signatures randomly selected from GPDS-881, MCYT-75. Real and synthetic signatures were randomly mixed. To avoid any background effects, the signatures were set against the same white background. In addition, the test was presented on printed sheets to avoid the use of computer facilities, e.g. the zoom, to help make the decision. A subset of this experiment is shown in Figure 6.9. The realism of the synthetic generator is measured by calculating two kinds of errors. We work out the False Synthetic Rate (FSR): a real signature is assigned as synthetic if the score is less than 5. We then work out the False Real Rate (FRR): a synthetic signature is assigned as real if its score is greater than 5. The final Average Classification Error (ACE) is calculated as ACE = (FSR + FRR)/2. The results of the survey of 80 volunteers are shown
94
Unified framework for fully synthesis of on-line and off-line signatures Table 6.1 Visual Experiment Results Error Rates (%)
Average scores
FSR
FRR
ACE
Real
Synthetic
43.02
45.10
44.06
5.38
4.50
Table 6.2 Performance (EER (%) and STD*) for random and skilled forgeries Random forgeries Skilled Forgeries Static Dynamic Static Dynamic Database experiments experiments experiments experiments HMM SVM DTW MAN HMM SVM DTW MAN Real MCYT330** 3.980.17 0.550.06 0.350.08 2.220.37 21.430.21 17.720.45 4.540.23 8.760.64 Synthetic MCYT330 5.910.42 1.500.16 0.410.05 2.450.27 27.120.48 16.680.64 4.650.23 2.890.24 Real BiosecureID 4.490.34 1.210.18 0.230.03 1.160.17 26.160.37 13.240.69 3.080.21 1.980.25 Synthetic BiosecureID 5.460.38 1.350.19 0.290.04 1.490.18 26.960.44 16.400.94 3.480.15 1.890.21 Real NISDCC 2.310.92 0.100.20 0.360.14 1.900.23 14.240.58 13.031.81 8.980.33 4.100.52 Synthetic NISDCC 3.850.39 0.670.20 0.470.13 1.380.31 22.560.58 19.940.58 5.000.31 3.210.27 Real SVC2004** 1.860.25 0.120.08 1.070.11 2.940.45 6.610.50 17.250.56 28.190.63 15.890.79 Synthetic SVC2004 2.430.65 0.020.03 0.800.14 0.710.21 12.180.54 16.300.67 23.990.63 8.300.62 Real SUSIG Blind** 1.720.36 0.550.06 3.190.35 2.220.37 14.030.45 17.720.45 23.650.56 8.760.64 Synthetic SUSIG Blind 2.400.35 0.160.07 3.310.22 0.850.15 24.540.37 11.800.96 13.960.44 5.900.55 Real SUSIG Visual** 2.420.31 0.590.06 2.120.11 3.440.34 14.660.69 19.560.46 32.780.44 8.480.50 Synthetic SUSIG Visual 3.860.40 0.670.13 3.040.10 1.840.15 25.661.06 19.130.59 17.110.37 9.030.31 *The main value corresponds to the averaged EER whereas the sub index appertains to the standard deviation **Static signatures generated from the dynamic signatures through the ink deposition model (Ferrer et al., 2013a)
in the first three columns of Table 6.1. The average score of real and synthetic signatures is also given at Table 6.1 along with the average time taken to complete the experiment.
6.5.3
Similarity between real and their synthetic databases
This section measures the similarity between the real datasets and their synthetic versions. Table 6.2 provides the EERs obtained with real and their corresponding synthetic datasets. It can be seen that the synthesizer is capable of generating a wide range of synthetic databases with different performances. Additionally, in the synthetic datasets, the fact that there are different relations between the EERs of the random and skilled forgery experiments tells us that it is possible to generate forgeries with different skill levels. The ability of changing the relation between the EERs of static and dynamic experiments shows the possibility of modulating the dynamic variability in different ways. Obviously, given the wide and unpredictable nature of the human behavior found in the five analyzed datasets, the match between real and synthetic datasets can be improved, e.g. in the SUSIG Visual database. The model proposed in this work focuses on the neuromotor characteristics of the signature while other factors related to operational conditions should be
6.6 Conclusion
95
included, e.g. acquisition sensor characteristics, different languages, mobile acquisition and so on. Similarities and differences between real and synthetic datasets are analyzed in Figure 6.10. Such figure shows the Detection Error Trade-off (DET) curves of all the experiments. It can be seen that there exist intersections between DET curves of real and synthetic datasets, which means that there is room for emulating the complete variability of real databases. As can be seen for the random forgery experiment, MCYT330 corpus, BiosecureID and NISDCC datasets are the best replicated, which correspond to Western datasets acquired with WACOM tablets. However, SVC2004, performed by Chinese people, and SUSIG databases, acquired with touch devices, are the worse matched. In the case of skilled forgeries, the MCYT330 corpus, BiosecureID and SVC2004 forgers are the best imitated. Concerning the classifiers, results suggest that the easiest datasets to emulate in the random forgeries’ experiment are the SVM and the DTW for off-line and on-line cases respectively. In the skilled forgery experiments we use the SVM and the Manhattan-based for off-line and on-line cases respectively. These results suggest, among others, the need for deeper studies in human handwriting variability in: 1) non-Western writers and 2) touch devices. Although a full model of a human variability is far away from the current technology, it is expected both such studies would provide a step forward in its understanding.
6.6
Conclusion
In this chapter it is proposed a novel and unified method for synthetic signature generation of both the static signature image and its dynamic sequences of synthetic identities using a unique signature synthesizer framework. Additionally, the proposed framework is able to synthesize realistic forgeries based on a human plan to imitate handwriting. Several synthetic datasets with different lexical and morphological properties and performances have been used to assess the ability of the synthesizer to handle a wide range of varied sources. All of them are freely available at www.gpds.ulpgc.es. The proposed algorithm has enormous potential since it provides a deeper analysis of the method of producing handwriting which is demanded by many experts such as neurologists, graphologists and forensic and computer scientists. For instance, in computer science and biometrics it make it easier to address topics such as aging, interoperability, multiscript, scalability and template protection, etc. at only minor computational cost, once the synthesizer setup is established.
96
Unified framework for fully synthesis of on-line and off-line signatures
Fig. 6.10 DET Curves for all the experiments. The solid lines represent the real databases whereas the dotted line refers to synthetic datasets. HMM classifier DET curves are depicted in blue, SVM in green, DTW in red and Manhattan in cyan colour
6.6 Conclusion
97
Finally, the lack of large real data sets is one of the key barriers for the use of deep learning algorithms (LeCun et al., 2015) on signature applications so synthetic databases will be useful resources for the research community. With this work, it is made publicly available several datasets which comprise more than 10.000 signatures that can be used to train either statistical learning approaches or new deep architectures.
Chapter 7 Conclusions and Future Works Some contributions have been given in order to generate synthetic handwritten signatures. To close this dissertation, this chapter is devoted to some conclusions and future lines of research work, some of them are currently being worked on.
7.1
Conclusions
Synthetic handwritten signature generation is presented in the literature under two modalities: i) generation of duplicated signatures (i.e. given a real specimen, algorithms generate an artificial signature with realistic intra-personal variability); and ii) generation of new identities (i.e. without any signatures but some rules, algorithms are supposed to generate signatures with realistic both inter and intra-personal variability). Recently, researchers have contributes to these two modalities with genuine proposals. As an advance to the prior art, this dissertation proposed several methods to generate synthetic signatures inspired in the motor equivalence theory. Briefly, this theory tries to explain at a cognitive level, the human processes to designed a handwritten signature and, at motor level, the execute of such a designed signature. To demonstrate the proposed contributions, two validation protocols are followed in the majority of cases. On the one hand a perceptual evaluation through designed visual Turing test. This validation allows to determine the perceptual confusion between real and synthetic signatures. This way, provided by the confusion was elevated, the generation process could conclude as acceptable. On the other hand, a performance-based evaluation has been always carried out. One of the motivation of this thesis is to improve the current technology, i.e. the state-of-the-art automatic signature verifiers. For this purpose, it has proven that synthetic signatures are able to improve the performance of the systems, in the case of duplicated
100
Conclusions and Future Works
signature contributions. In the case of fully synthetic signature generation, it has been proven the closeness performances between real and synthetic signatures. On the duplication signatures, contributions are given at Chapter 3, 4 and 5. This thesis has proposed solutions to On-2-Off, Off-2-Off and On-2-On modalities. On the fully synthetic signature generation, a unified framework to generate on-line and off-line signature simultaneously is proposed in Chapter 6. On the On-2-Off duplication modality, the seed of the algorithm consists in real on-line signature. In the literature researchers apply several techniques to distort the signature and eventually create an image-based signature. This duplication modality offer a number of possibilities to create image-based signatures due to the dynamic and temporal information is provided. The method showed in Chapter 3 is the first approximation of this thesis to create off-line duplicated signatures by using the motor equivalence theory. This way, the developed algorithm was designed under this perspectives. An additional novelty of this method was the virtual ink deposition model to highlight the realism of the synthetic off-line signatures from a perceptual point of view (Ferrer et al., 2013a,b). The method was validated improving the performance of a state-of-the-art automatic signature verifier, which suggest an approximation of the synthetic signatures to the real intra-personal variability. Eventually, the acceptation in the research community was evidenced after its communication in a specialized international conference (ICFHR-2014) where it was awarded with the Best Student paper award. On the Off-2-Off duplication modality, the seed of the algorithm consists in real off-line signature. Because of the fact that estimating the dynamic and duration of the executed signature is an open challenge in the research community nowadays, the possibilities to infer intra-personal variability are by far more reduced compare to On-2-Off duplication modality. However, beyond affine and geometrical image distortion as the literature suggested, in chapter 4 it is proposed an algorithm based again on motor equivalence theory. Despite the reduced distortion, the algorithm was tested from a performance-based validation with several off-line signature databases and state-of-the-art static automatic signature verifiers. Experimental results have proven the robustness of the cognitive duplication model. Once again, the scientific community has accepted this methodology, which has been published in the IEEE Transactions on Pattern Analysis Machine Intelligence journal (Diaz et al., 2016). On the On-2-On duplication modality, the seed of the algorithm is one real on-line signature. One of the motivation to duplicate signatures is to increase the training set providing extra intra-personal variability so as to reduce the error rates in the performance. However, without duplicates, the performance of on-line verifiers are generally the most competitive in automatic signature verification. Therefore, the margin of improvement is
7.1 Conclusions
101
reduced compared to off-line signature verification (Galbally et al., 2015). For this reason, Chapter 5 proposes two duplication methods based on kinematic Theory of rapid movements. The duplicates have been used to train systems under the limitation of only a single reference signature - which it is supposed to be one of the toughest cases. In addition to a perceptual validation, the error rates of three state-of-the-art systems were reduced by testing multiple on-line signature databases. An initial method was presented in one of the most specialized conference in document analysis (ICDAR-2015) and its acceptance was evidenced since it was awarded with the Best Student paper award (Diaz et al., 2015b). Note that all duplication method proposed in this dissertation need one real signature. It is an additional contribution of the proposed methods in favour of this Thesis against other proposals which require more than one specimen as seed. On the fully synthetic signature generation, an initial work is attributed to Popel (Popel, 2007), being the first complete theoretical and experimental work presented in (Galbally et al., 2012a,b). While their proposals were regarding to dynamic signature generation, static signature generation was attributed to (Ferrer et al., 2013a, 2015). A followed up advance in synthetic signature generation is due to Chapter 6. Once again, the algorithm to generate new identities is inspired in the motor equivalence theory. Probably the major novelty of this work is the unified framework to generate on-line and off-line signature simultaneously. Additionally, the proposed method highlights the flexibility to be adapted to signatures databases, which were compiled in different Western and non-Western countries. In addition to generate realistic signatures perceptually acceptable, the goal of this chapter was approach the performance of real signatures according to DET curves of real and synthetic databases. The latter databases are publicly available at www.gpds.ulpgc.es. This work was also accepted in the scientific literature according to the recent publication in the IEEE Transactions on Pattern Analysis Machine Intelligence journal (Ferrer et al., 2016). Finally, this thesis has evidenced the powerful of the algorithms to duplicates signatures when they are designed under motor equivalence theory perspectives. The scientific knowledge shared in the topic of this dissertation encourages to follow researching on novel methods to synthesize signatures. Although the current results offered by this technology are not still competitive in industrial applications, this Thesis suggests that the synthesis of signatures is a reasonable way to model the unpredictable and unknown real intra-personal variability.
102
Conclusions and Future Works
7.2
Future Works
A number of future research lines arise from the work carried out in this Thesis. We consider of special interest the following ones: • Automatic Signature Verification (ASV) systems are frequently focused on singlescript conditions, and as a result, using a wide variety of languages constitutes an additional complication to current systems. Although globally many countries have no such requirements in their daily technologies, in multilingual countries such as India, where many popular scripts exist, ASV systems are supposed to work under multi-script conditions. Specifically, in the case of India, Bengali and Devanagari are the most spoken scripts. Therefore, transferring the contents of this Thesis to multiscript conditions could demonstrate the robustness of our algorithms. Currently, this research line is being explored both for duplication modality and for the fully synthesis generation of signatures. The experienced gained in this dissertation encourage to adapt the algorithms, if it was necessary, under motor equivalence perspectives. • One modality of duplication has not been dealt in this dissertation (Off-2-On). This duplication modality demands to generate an on-line version from the real off-line signature. According to the state-of-the-art, there is limited information about processes to obtain efficiently an on-line synthetic version from a real off-line specimen, to the best of our knowledge. Initial actions are due to the segmentation of off-line signatures, mainly from noisy backgrounds; the crosses of the signature due to the flourishes, mainly in Western signatures; there is no reference to the dynamic of the signatures; during the labeling, some parts of the image-based signatures were incorrectly cropped; the writing order recovering (Cordella et al., 2010) and so on. Once these technological challenge were overcome and a pseudo dynamic version of the signature was obtained, it is expected a prominent improvement in the final performance compared with the original off-line systems’ performances. Thus, it is planned to investigate this research line in the following terms: 1) If off-line and on-line signatures’ features are different among them, why do we combine them in order to improve the performances of the ASVs systems? and; 2) Due to we do not register both signatures at the same time, having a specimen (off-line or on-line), how could we generate its counterpart in a synthetic way to combine them eventually? The principal idea of these questions relies on the fact that it is expected that the performance after combination was improved since the features and ASVs are completely different and decorrelated.
7.2 Future Works
103
• A strong future research plan in favour of motor equivalence theory relies on inverting the model proposed to generate full synthetic signatures. As such, obtaining the grid map that imitates the cognitive map and the smoothing filters that represent the motor inertia, can help to evaluate some learning problems for children or cognitive and motor degenerative problems such as Parkinson’s or Alzheimer’s diseases at early stages (Eichhorn et al., 1996; Forbes et al., 2004; O’Reilly and Plamondon, 2012). These inverse parameters can also be combined with the usual forensic science features (Bird et al., 2010) to evaluate the authenticity of handwritten signatures in contracts, testaments, corporate tax returns, etc. A similar approach can be applied to graphology. • The algorithms designed in this Thesis tried to solve different typical challenges in handwritten signatures. However, the motor equivalence theory, which has inspired this dissertation, introduces concepts well-known in neuroscience. Such concepts explain and applying theories based on human movements. Beyond signatures, human being carry out diverse daily actions which could be interpreted under this theory. For instance, beyond a behavioural trait like the handwritten, the voice is one human action which can be explained under this theory as well. For this reason, one research line can be orientated to model several human actions, such as the keystroking, the voice, the gait, the saccade movements, among others under an unify framework inspired by the motor equivalence theory. • Finally, the mathematical and scientific basis of this thesis could be exploited for commercial and businesses purposes. Similar to companies like Neuroscript1 , MyScript2 or ABBYY3 , among other, the contents of this Thesis could suppose a contribution to several disciplines sensitive with handwritten signatures. For instances, beyond computer science scientists, forensic document examiners could use the duplicate generation as additional support to their making decisions; since algorithm are designed under motor equivalence theory, some of the proposed techniques in synthesis can be also used as tools in education, to learn to write stroke by stroke, or in the design of specific test to rehabilitation or to exercise people who suffers any visuo-musculo-skeletal disorders. Most of these disciplines are subjected to the decision of a professional who can not be accessible in all cases and countries. So, one rewarding research line could be orientated to obtain objectives measurements useful to evaluate the quality of the handwritten. 1
www.neuroscript.net www.myscript.com 3 www.abbyy.com 2
Appendix A Performance metrics, Databases and Systems Performance metrics In this thesis, it is used the typical performance metrics to evaluate the signature-based biometric systems (Blumenstein et al., 2010). Performance metrics take into account two classical types of error rates: Type I error or FRR to measure the rejection of authentic signatures and type II or FAR, which evaluates the acceptance of a forgery. To assess the systems with a common metric, the results are given in terms of Equal Error Rate (EER) as well as Area Under Curve (AUC) since these represent the operative point when the error type I and II are coincident.
Databases In this thesis several publicly signature databases have been used to validate the hypothesis in different chapters. They are described in the following sections.
Off-line signature databases • GPDS-881 Off-line Signature DB (Blumenstein et al., 2010; Ferrer et al., 2012a). This database consists of 881 users with 24 genuine signatures acquired in a single session and 30 forged signatures. In total, the database provides 881 x 24 = 21144 and 881 x 30 = 26430 genuine and forgeries signatures respectively, all scanned at 600 dpi. This Spanish dataset is one of the largest off-line signature databases presented in the literature.
106
Performance metrics, Databases and Systems • GPDS-300 Off-line Signature DB (Blumenstein et al., 2010; Ferrer et al., 2012a). This dataset is identically organized as GPDS-881 Off-line Signature DB, but with the first 300 users. • MCYT-75 Off-line Signature DB (Fierrez-Aguilar et al., 2004; Ortega-Garcia et al., 2003). This dataset includes 75 signers collected at four different Spanish universities. The corpus includes 15 genuine and 15 deliberately forged signatures acquired in two sessions. All the signatures were acquired with the same inking pen and the same paper templates. The paper templates were scanned at 600 dpi with 256 grey levels.
On-line signature databases • SUSIG-Visual sub-corpus (Kholmatov and Yanikoglu, 2009) is considered for its wide acceptance in many research papers. This database contains 94 users with 20 genuine signatures, acquired in two sessions, and 10 skilled forgery signatures. This sub-corpus was collected with an LCD touch device. • SUSIG-Blind sub-corpus (Kholmatov and Yanikoglu, 2009) consists of 88 users with 8 or 10 genuine repetitions and 10 forged signatures per user. The volunteers could not see the signature trajectory as visual feedback during the acquisition process was denied. • SVC-Task1 sub-corpus (Yeung et al., 2004) includes both Chinese and English signatures, each captured by a WACOM tablet. This sub-corpus is composed of 40 users with 20 genuine and 20 forged signatures per user. Because only the dynamic trajectory is provided, this sub-corpus is not so popular among the scientific community. • SVC-Task2 sub-corpus (Yeung et al., 2004) is one of the most widely used corpuses because, apart from the sampled trajectory, this sub-corpus also provides the pressure and pen-orientation signals. It is also composed of 40 users with 20 genuine and 20 forged signatures. • MCYT-330 corpus (Ortega-Garcia et al., 2003) is the full MCYT database and was captured by a WACOM tablet. It contains 330 users with 25 genuine signatures acquired in two sessions and 25 skilled forgeries. • MCYT-100 sub-corpus (Ortega-Garcia et al., 2003) is a part of the MCYT-330 corpus and contains 100 users following the same organization.
107 • SG-NOTE database (Martinez-Diaz et al., 2014) is at present one of the few publicly available mobile signature databases. This corpus, captured with a Samsung Galaxy Note mobile phone, is composed of 25 users with 20 genuine signatures collected in two sessions.
Off and On-line signature databases simultaneously • BiosecureID-Signature UAM subcorpus (Ortega-Garcia et al., 2010). It comprises 132 users, with 16 genuine signatures (four per session) and 12 skilled forgeries (three per session) for every subject. Hence, the database contains the on-line and off-line data of 16 × 132 = 2112 genuine signatures and of 12 × 132 = 1584 skilled forgeries. Handwritten signatures were acquired with the Intuos3 A4/Inking pen tablet at 100 Hz placing a predefined paper template over the digitizing device. This way, both versions, dynamic and static, of the same samples were captured simultaneously. The static version was scanned at 600 dpi. • NISDCC database (Alewijnse et al., 2009; Blankers et al., 2009). Different signature databases have emerged during past ICDAR and ICFHR conferences. One part of this dataset was used for the Signature Competition during the ICDAR 2009. It was collected and processed by the Netherlands Forensic Institute. This corpus contains the off-line and on-line versions of the same signatures. In this work we have used the evaluation corpus which comprises 100 users, with 12 signatures per writer and 6 forgeries per signature. In total, such a corpus has 1953 signatures for both off-line and on-line datasets.
Automatic Signature Verifiers In this thesis several automatic signature verifiers have been used to validate the hypothesis in different chapters. They are described in the following sections:
Off-line automatic signature verifiers • Geometric features + HMM. (Ferrer et al., 2005). The signature is parameterized in Cartesian and polar coordinates. Both features are combined at score level. The Cartesian parameters consist of equidistant samples of the height and length of the signature envelope plus the number of times the vertical and horizontal lines cut the signature stroke. In polar coordinates the parameters are equidistant samples of the
108
Performance metrics, Databases and Systems envelope radius plus the stroke area in each sector. A multi observation discrete left to right HMM is chosen to model each signer’s features. The classification (evaluation), decoding, and training problems are solved with the Forward-Backward algorithm, the Viterbi algorithm, and the Baum-Welch algorithm. The initialization method is the equal-occupancy method. • Grid-based + BFS (Eskander et al., 2013). This system employs the Boosting Feature Selection (BFS) approach (Tieu and Viola, 2004) for building a strong classifier from a few weak classifiers such that the SV system is simple yet performs well. Each weak classifier consists of a simple decision stump that relies on a single grid-based feature. To alleviate the inter-personal similarities, a huge number of grid-based features, e.g. thousands of them, are extracted from the signature templates of all users. This initial high-dimensional representation is then transferred to a dissimilarity space, where distances between samples are considered as grid-based features, and they are used to train a Writer-Independent (WI) model that discriminates between inter-personal and intra-personal samples of the population. Finally, the target writerdependent (WD) classifier is designed for every specific user using his enrolling samples. This WD design step is executed in the reduced WI grid-based feature space, where it is possible to learn from a few enrolling samples in a lower dimensional space. • Texture-based + SVM. (Ferrer et al., 2012a). This system is based on texture features such as the local binary pattern (LBP) and local derivative pattern (LDP). The signature is transformed into the LBP and LDP images which are divided into 12 sectors. The histogram of each sector is worked out, concatenated and its dimension reduced with a Discrete Cosine Transform (DCT) thus obtaining two separated feature vectors according to LBP and LDP operators. The combination at score level is evaluated through a weighted sum. The classifier is based on a least squares support vector machine (LS-SVM). • Pose-orientated grid features + SVM (Zois et al., 2016). This is a recent published system which works with a grid-based template matching scheme for static signature verification. Briefly, the signatures are encoded according to their fine geometric structure by grid templates, appropriately partioned in subsets. Features represent the detection of ordered transitions using lattice shaped probing structures shaped on 5 × 5 pixel window binary masks. Finally, a support vector machine is used for the classification stage.
109
On-line automatic signature verifiers • DTW-based verifier (Diaz et al., 2015b; Fischer et al., 2015): Only the trajectory signals and their first and second derivatives were used to build the feature vector per component. The final feature matrix for a signature was obtained by concatenating all feature vectors and computing the z-score. A standard version of the DTW was configured to optimize the Euclidean distance with three local transitions. The search space was reduced by a Sakoe-Chiba band (Sakoe and Chiba, 1978) with a width of 10 %. The relationship of a questioned signature q to the signer model was then quantified in sR (q) as the minimum distance between this signature and the model: sR (q) = argmin[DTW(q, r)], where R includes all signatures in the training set. Then, r∈R
a two-stage score normalization was carried out to compute the final score. While the warping path length |p| of the minimum DTW distance was used to detect weak forgeries in a first stage, a weighted factor µR calculated by the average DTW distance among the signatures used to train, copes with more skilled forgeries in a second stage. • Manhattan distance based verifier (Sae-Bae and Memon, 2014): Since this histogram-based verifier is particularly convenient for handheld devices, at least according to the reported promising results with a proprietary mobile signature database, we have implemented a version following the configuration described in (Sae-Bae and Memon, 2014). We took into account the dynamic signatures under three considerations: i) resampling, ii) concatenation of the components and iii) addition of extra histogram features. To use a unique configuration of this verifier, all of its parameters were optimized for the SUSIG-Visual sub-corpus. The same verifier was used for the other databases without any modification. The thresholds in the algorithm were set to the following values: β = 0.1; εrel = 0.5; εabs = 0.5 and the weights of the histograms R and Φ − Φd(1,2) were increased 3 times with respect to the other histograms, following the same nomenclature as in (Sae-Bae and Memon, 2014). • HMM-based verifier (Fierrez et al., 2007): Using the same features as for the DTW-based verifier, we have implemented a Hidden Markov Model (HMM) verifier as proposed in (Fierrez et al., 2007). System parameters include the number of HMM states and the number of Gaussian mixtures per state. We considered α · LR HMM states in a linear topology where 0 < α < 1 and LR was the average number of sampling points of the enrolled reference signatures. Again, the system parameters were optimized on the SUSIG-Visual sub-corpus and were used for the rest of the databases without any modification. In particular, we set α = 0.04 and used 11 Gaussian mixtures for training with duplicated signatures. In order to validate the
110
Performance metrics, Databases and Systems correctness of our HMM implementation, we also tested the system on MCYT-100 using the first 10 genuine signatures of each user for training and achieved an equal error rate of 0.80 % for random forgeries and 3.76 % for skilled forgeries. These results were indeed very similar to the results reported in (Fierrez et al., 2007) for MCYT, namely 1.04 % for random forgeries and 3.36 % for skilled forgeries, which demonstrates the validity of our implementation.
Appendix B Summary in Spanish / Resumen en Español G ENERACIÓN DE F IRMAS S INTÉTICAS PARA LA V ERIFICACIÓN AUTOMÁTICA DE F IRMAS1 Introducción Antecedentes: La firma como un trazo biométrico conductual Aprender a escribir es complejo y por lo general se comienza con líneas y garabatos. Después de alcanzar unos tres años de edad, los niños empiezan a darse cuenta de que la escritura se compone de líneas, curvas y patrones repetidos. Un año más tarde, los niños empiezan a usar las letras, pero con su propio estilo. Por lo general, comienzan experimentando con las letras de sus propios nombres, ya que son las más familiares para ellos. De esta manera, los niños comienzan a conocer las formas y la secuencia de las letras, a pesar de no poseer un control motor exacto. Los niños suelen comenzar a practicar la escritura a mano usando hojas impresas. Estas ayudan a los niños a trazar las letras del alfabeto y a escribir los números. Estas hojas contienen líneas de escritura que les sirven de guías en cuanto a la altura, anchura y la longitud de cada letra en mayúsculas o minúsculas y de los números. Las líneas de guía ayudan a controlar las relaciones espaciales entre objetos, creando así la memoria espacial 1 In
order to meet the requirements established by the University of Las Palmas de Gran Canaria to obtain the doctoral degree, this annex comprises a summary in Spanish of the above contents.
112
Summary in Spanish / Resumen en Español
o mapa cognitivo. Una vez que se adquiere este conocimiento, es posible seleccionar una secuencia ordenada de puntos de destino para realizar la escritura de un modo más fluido. En esta etapa, la persona está lista para definir y practicar su firma. Vinculado al aprendizaje de escritura a mano, la firma manuscrita dependerá de las circunstancias del medio, la personalidad del firmante, la educación, el medio ambiente cultural, etc., más las habilidades cognitivas y motoras del firmante. Durante siglos, la firma manuscrita ha sido aceptada en todo el mundo con el propósito de autenticación de la identidad. Algunas aplicaciones clásicas incluyen la validación legal de los documentos como contratos, testamentos, declaraciones de impuestos corporativos, las transferencias financieras y así sucesivamente. Esto ha hecho que la firma se utilice como un rasgo biométrico en el contexto de sistemas y aplicaciones. El reconocimiento biométrico (Jain et al., 2016) está todavía en continuo crecimiento. En nuestra vida diaria, esta tecnología está tomando popularidad en el control de acceso, en la identificación de personas, las transacciones financieras, la salud, etc. A pesar de que el número de rasgos biométricos es limitado, esta tecnología es capaz de ofrecer una mayor seguridad y comodidad que los métodos tradicionales como aquellos basados en soportes físicos (por ejemplo, pasaportes o tarjetas de identificación) y aquellos basados en el conocimiento (por ejemplo, números PIN o contraseñas) para asegurar que la persona correcta está en el lugar correcto en este momento. Algunos ejemplos de rasgos biométricos son las huellas dactilares, la cara, el iris o la voz, siendo la firma una de las menos explotada debido al poco éxito en aplicaciones prácticas hasta ahora. Un sistema biométrico típico, basado en firmas se ilustra en la figura B.1. Una vez que el usuario (Y) deposita su firma, un sensor digitaliza la muestra. Más tarde, una matriz de características (X) se construye con la información extraída de la muestra adquirida. A continuación, los sistemas normalmente tienen dos etapas: la inscripción (XE ) y el reconocimiento (XR ). El primero construye una base de datos del sistema (D), donde los usuarios almacenan sus firmas de referencia, mientras que el segundo se utiliza para reconocer, identificar o verificar la identidad de un usuario, que suele presumir de ser uno de los usuarios previamente inscritos. A continuación, se obtiene una puntuación (S) de acuerdo con la pertenencia de su muestra con respecto a las firmas de referencia que reivindica. Por último, el sistema se supone que debe aceptar o rechazar la muestra cuestionada. Uno de los retos cruciales de un sistema biométrico basado en firmas es la variabilidad intra-personal, la cual es impredecible. Esto significa la similitud entre las firmas ejecutadas por el mismo firmante. A menudo, esta variabilidad se atribuye a las diversas fuentes de ruido (µ) que distorsionan la medida, y por tanto la matriz de características. De acuerdo con la figura 1.1, la variabilidad intra-personal, que afecta a la muestra medida (M) se podría
113
Fig. B.1 Visión general de un sistema biométrico típico basada en firmas. Figura parcialmente extraída de (Jain et al., 2016) caracterizar por: limitaciones del sensor como la resolución o la frecuencia de muestreo; efectos biológicos del envejecimiento o deterioro cognitivo-motor; interacción del usuario con el sensor; cambios en el entorno, como el ruido de fondo y; otros factores como consecuencia del estado de ánimo de los individuos, la prisa o la disposición a cooperar. Otro reto importante que enfrentan los sistemas biométricos basados en firmas es la variabilidad inter-personal, la cual es también impredecible. Esto significa la similitud entre las firmas ejecutadas por diferentes autores. En un sistema basado en la firma, la variabilidad inter-personal se atribuye principalmente a las formas de falsificar la identidad de los firmantes a través de dos tipos de falsificaciones2 • Falsificadores aleatorios: A ellos se les atribuye la situación en la que un impostor, sin conocimiento previo de una firma específica, trata de verificar la identidad de un firmante mediante el uso de su propia firma. La prueba de falsificaciones aleatorias es una prueba típica en el control de acceso y las transacciones comerciales. • Falsificadores cualificados: A ellos se les atribuye la situación en la que un impostor conoce la firma de un firmante y trata de reproducirla con una variabilidad intra-clase similar. Esta prueba es la más relevante en la verificación de firmas por su impacto en las aplicaciones forenses de detección de falsificadores. 2 En
la literatura existen diferentes maneras para mencionar a las falsificaciones (por ejemplo impostores de azar, falsificaciones deliberadas, impostores deliberados, falsificadores altamente cualificados, etc.). En aras de la simplicidad, en esta Tesis se han utilizado los términos falsificadores aleatorios y falsificadores cualificados.
114
Summary in Spanish / Resumen en Español
Por último, como ejemplo, la figura B.23 ilustra la complicación de distinguir visualmente firmas genuinas de firmas falsificadas.
3 Solución:
De izquierda a derecha y de arriba a abajo. Fila 1: falsa, genuina. Fila 2: falsa, genuina. Fila 3: genuina, falsa. Fila 4: genuina, falsa. Fila 5: falsa, falsa. Fila 6: genuina, genuina.
115
Fig. B.2 ¿Cuántos falsificadores podrías detectar? Figura extraída de (Morocho et al., 2016)
116
Summary in Spanish / Resumen en Español
Aspectos emergentes en la verificación automática de firmas La verificación automática de firmas (ASV) tiende a centrarse en la mejora de la precisión del reconocimiento, aunque temas como la interoperabilidad, las normas, la escalabilidad y la protección están también ganando atención en la comunidad científica. Protocolos y parámetros experimentales bien establecidos conducen a esta tecnología a una evaluación de estadísticamente más fiable. De hecho, varios estándares (ISO/IEC, 95 X), procedimientos (Mansfield and Wayman, 2002), bases de datos (p.e. (Ferrer et al., 2012a; Frias-Martinez et al., 2006; Kholmatov and Yanikoglu, 2009; Martinez-Diaz et al., 2014; Ortega-Garcia et al., 2003; Yeung et al., 2004)) y competiciones (p.e. (Blankers et al., 2009; Blumenstein et al., 2010; Liwicki et al., 2012, 2011, 2010; Malik et al., 2015; Yeung et al., 2004)) están continuamente desarrollándose. Además, en este contexto, dos tipos de firmas se utilizan en estos sistemas, ilustrados en la figura B.3: • Firmas off-line: Conocidas también como firmas estáticas, son los más frecuentes y tradicionales en todo el mundo. Este tipo de firmas se refiere a aquella que queda depositada en un papel tras haber firmado el individuo con un útil de escritura, típicamente, un bolígrafo. La información suele encontrarse en una imagen escaneada. • Firmas on-line: También conocidas como firmas dinámicas. Su principal característica es que contienen el orden temporal y dinámico en el que el firmante ejecutó la firma. Permiten procesar una representación efectiva del orden de ejecución de las muestras. Para registrar este tipo de firmas, se requiere un dispositivo parecido a una tableta WACOM. Probablemente, tener este dispositivo disponible en cualquier lugar es la principal limitación de este tipo de firmas. Esfuerzos de investigación en la verificación de firmas han generado una compilación de publicaciones y estudios amplios (Diaz-Cabrera et al., 2014c; Fairhurst, 1997; Fierrez and Ortega-Garcia, 2008; Hafemann et al., 2015; Impedovo et al., 2012; Leclerc and Plamondon, 1994; Plamondon and Lorette, 1989; Plamondon and Srihari, 2000) publicados en la literatura durante las décadas anteriores. Algunas de las nuevas tendencias que los investigadores están desarrollando pueden ser clasificadas en los siguientes cinco puntos. • Deriva temporal en el reconocimiento automático de la firma: La firma, como rasgo biométrico conductual, es sensible a las variaciones a largo plazo que pueden estar relacionados con adquisiciones en varias sesiones (Galbally
117
(a) Firma real on-line
(b) Firma real off-line
Fig. B.3 Diferencias visuales de la misma firma real en on-line y en off-line. Figura extraída de (Galbally et al., 2015) et al., 2013), el envejecimiento (Erbilek and Fairhurst, 2012) o las degeneraciones neuromotoras (O’Reilly and Plamondon, 2012), entre otros. El principal efecto del envejecimiento en las aplicaciones de procesamiento de la firma es la degradación de la variabilidad intra-clase. • Identificación del falsificador: La mayoría de los sistemas automáticos de reconocimiento de firma tratan de responder a esta pregunta: ¿Está esta firma hecha por un escritor genuino? En el caso de una firma falsificada, surge una segunda pregunta relevante para Expertos forenses de escritura a mano: ¿Quién ha falsificado la firma? La identificación de los falsificadores es una tarea diaria para el análisis forense cualificado. Sin embargo, en la comunidad científica pocos trabajos se han generado en esta dirección (Ferrer et al., 2012b). • Reconocimiento de firma encubierta: Una firma encubierta se refiere a la firma genuina realizada por el firmante bajo una cierta amenaza (p.e. cuando tiene una pistola en la cabeza) (Bird et al., 2010; Liwicki et al., 2012; Malik et al., 2013b). Cuando esta firma es analizada por un experto forense, el análisis se realiza bajo el supuesto de la hipótesis fiscal (una determinada firma fue hecha por uno de los presuntos firmantes) y el de la defensa (una cierta firma fue realizada por otro firmante diferente). Por lo general, los resultados son dados
118
Summary in Spanish / Resumen en Español en términos de razón de verosimilitud (LR). Esto conlleva a que en las hipótesis de defensa hay dos escenarios posibles: i) la firma fue hecha por un escritor diferente; ii) la firma fue hecha por su propietario original, pero de manera encubierta. • Verificación de firmas en entornos Multi-script4 Las firmas suelen estar compuestas por letras mayúsculas y/o rúbricas o florituras. A pesar de la gran cantidad de trabajos que tratan el reconocimiento de texto basado en la escritura y el reconocimiento de firma estática, la mayoría de ellos estudian el problema aislado (Pal et al., 2011). Algunas preguntas abiertas relacionadas con escenarios de escrituras múltiples son: ¿Cuál es la influencia de unir varios scripts en la tasa de reconocimiento (Das et al., 2016)? ¿El rendimiento de un sistema propuesto para la escritura de A será el mismo para el de la escritura B? Por ejemplo, en (Pal et al., 2012) las escrituras Bengalí, Devanagari y Western se evaluaron mediante el uso de sistemas de reconocimiento de firma, concluyendo con que los errores más frecuentes se producen en la clasificación errónea de firmas Bengalí y Devanagari. • Generación sintética de firmas: Debido a que este tema ha motivado esta Tesis, este punto se explicará en detalle en el siguiente apartado.
4 El
conjunto de caracteres (p.e. letras o símbolos) utilizados para la escritura de una lengua particular es conocido como script
119
Revisión de trabajos sobre generación sintética de firmas Sintetizar un rasgo biométrico es una oportunidad para profundizar y aprender los procesos biológicos que caracterizan las muestras. Esto es un paso crucial para proponer sistemas automáticos con la capacidad de modelar las señales o imágenes medidas. De hecho, modelos y métodos para generar muestras biométricas han sido recientemente propuestos, tales como la huella dactilar (Maltoni et al., 2009), cara (Thian et al., 2003), iris (Zuo et al., 2007), voz (Dutoit, 2001) o escritura (Lin and Wan, 2007). En el contexto de firmas manuscritas, de entre todas las posibles ventajas de sintetizarlas, algunas de las más relevantes podrían resumirse como: i) La producción de firmas no requiere de ningún esfuerzo una vez los algoritmos hayan sido desarrollados, ii) no existe limitación de tamaño en términos de firmas por individuos ya que las muestras son generadas por un ordenador, iii) no intervienen los aspectos legales con lo cual no se compromete compartir los datos a terceros (Rejman-Greene, 2005), iv) se eliminan los errores humanos de etiquetado y organización de las bases de datos, v) permiten llevar a cabo evaluaciones estadísticas relevantes del rendimiento de los sistemas, vi) se puede simular el envejecimiento en la firma o los diferentes niveles de madurez, vii) se pueden simular firmas afectadas por enfermedades neurodegenerativas u otra enfermedad cognitiva y, por lo tanto, viii) surge una tremenda oportunidad de analizar el deterioro y la pérdida de función de los órganos responsables en la producción de la escritura. En línea con la síntesis de firmas, la tendencia parece estar focalizada o en la generación de duplicados de firmas o en la generación completa de individuos sintéticos.
Generación de duplicados de firmas La generación de duplicados de firmas se refiere al modelado de la variabilidad intra-personal. Es decir, a las diferencias entre diferentes repeticiones de firmas realizadas por el mismo firmante. Su modelado permite aumentar la distinción entre la estrecha frontera de una firma genuina y una falsificada. La generación de duplicados de firmas con apariencia realista ayuda a un mejor entendimiento de la ejecución de firmas desde el punto de vista neurocientífico. En la literatura, muchas propuestas están orientadas a modelar la variabilidad intrapersonal para duplicar firmas estáticas o dinámicas, (p.e. (de Oliveira et al., 1997; Fang et al., 2002; Ferrer et al., 2013b; Frias-Martinez et al., 2006; Galbally et al., 2009; Guest et al., 2014; Huang and Yan, 1997; Munich and Perona, 2003; Rabasse et al., 2007, 2008)). En este contexto, duplicar una firma significa generar artificialmente nuevas firmas a partir de una (o varias) firmas reales genuinas. Entre todas sus ventajas, el duplicado de firmas puede
120
Summary in Spanish / Resumen en Español
mejorar el entrenamiento de los sistemas de verificación automática, aumentar el número de firmas en una base de datos, ajustar el rendimiento de los verificadores con un menor número de firmas reales de referencia, mejorar los rendimientos iniciales de un verificador, entender como el escritor ejecutó su firma y por lo tanto, explorar algún desorden neuromuscular visto durante la escritura. De acuerdo a la literatura, los métodos de duplicación de firmas podrían clasificarse en cuatro partes. 1. Generación de firmas dinámicas (on-line) a partir de firmas dinámicas reales (On-2-On) La mayoría de los avances recientes en el modelado de la variabilidad intra-personal se centran en las firmas dinámicas. Por ejemplo, en (Rabasse et al., 2007) se estudia que la eficiencia de los sistemas con firmas duplicadas se puede comparar con la eficiencia de dichos sistemas usando sólo firmas reales. También podemos encontrar que para generar firmas duplicadas se puede aplicar deformaciones aleatorias y geométricas. En concreto, en (Galbally et al., 2009) se estudia cómo estas deformaciones mejoran la eficiencia de un clasificador HMM. En (Song and Sun, 2014) se propone un método alternativo donde los autores aumentan el conjunto de entrenamiento a través de firmas duplicadas. El método se basa en una selección clonal de las firmas de referencia sin modificar ni la diversidad del conjunto global ni la distribución de características. Por otra parte, el conjunto de duplicados puede ser usado para testear los sistemas de reconocimiento biométrico de firmas, como se estudia en (Munich and Perona, 2003). 2. Generación de firmas estáticas (off-line) a partir de firmas dinámicas reales (On2-Off) Hay otras propuestas en la literatura centrada en la generación de imágenes de firmas a partir de las firmas dinámicas (Ferrer et al., 2013b; Guest et al., 2014; Rabasse et al., 2008). La tendencia común es aplicar diferentes métodos de distorsión a la firma on-line ya que estas contienen la cinemática y el orden temporal en el que fueron registradas. Una vez que se obtiene una nueva trayectoria, las muestras de las nuevas firmas duplicadas se interpolan con el fin de crear nuevas imágenes. Luego, un clasificador automático de firmas on-line es típicamente utilizado para evaluar la mejora del rendimiento. Paralelamente a este enfoque, otro método de generación de imágenes mejoradas de firmas sintéticas se ha formulado con el fin de utilizar una arquitectura novedosa que mejora el rendimiento de los verificadores dinámicos (Galbally et al., 2015).
121 3. Generación de firmas estáticas (off-line) a partir de firmas estáticas reales (Off2-Off) En la revisión de trabajos anteriores, hemos encontrado propuestas para duplicar firmas off-line a partir de firmas off-line reales. Un ejemplo se estudia en (FriasMartinez et al., 2006), donde una base de datos de firmas off-line compuesta de 6 muestras genuinas por usuario y 38 firmantes se amplía mediante la aplicación de transformaciones afines a las firmas originales. Ya que la bases de datos contenía sólo firmas genuinas, este estudio se centró sólo en el reconocimiento de firmas, no en la verificación. Aunque los autores ampliaron el conjunto de entrenamiento, las mejoras en el proceso de duplicados no fueron estudiadas. Tampoco se hizo referencia al procedimiento cognitivo de generación de firmas. Un objetivo similar se estudió en (de Oliveira et al., 1997), donde el procedimiento de duplicación se llevó a cabo a través de procedimientos afines y técnicas de convolución de parámetros obtenidos a través de polinomios y representación de señales. En (Fang et al., 2002), dos firmas estáticas fueron comparadas con el fin de estimar el área en común y generar duplicados dentro de dicha área espacial. Los resultados sugieren la ventaja de usar muestras duplicadas para reducir las tasas de error. Siguiendo un procedimiento de distorsión afín para aumentar el conjunto de referencia, en (Huang and Yan, 1997) la verificación de firmas off-line es de nuevo mejorada. 4. Generación de firmas dinámicas (on-line) a partir de firmas estáticas reales (Off2-On) La literatura científica todavía no ha examinado en profundidad el reto de recuperar la información dinámica de una firma estática. Dicho procedimiento puede ser explicado en tres etapas: i) recuperación del orden de escritura a partir de una representación del esqueleto de la firma, ii) segmentación de la firma en strokes5 y iii) información dinámica a partir de la sinergia entre los diferentes strokes producidos durante la escritura a mano. Sin embargo, algunos esfuerzos en la literatura han tratado de abordar la conversión Off-2-On. Sin embargo, en la literatura hay algunos enfoques para reconstruir las firmas, como el uso real de información en dinámica (por ejemplo (Nel et al., 2005)), el estudio de algunas reglas heurísticas (por ejemplo (Lee and Pan, 1992)), el uso de modelos universales de escritura para modelar el orden en el que la escritura 5 En
aras de clarificar conceptos, stroke se utiliza en esta tesis para describir un comando neuromuscular que ejecuta un movimiento elemental, el cual puede ser observado en el perfil de velocidad como entre dos mínimos. Del mismo modo, el término componente es utilizado para describir un trazo realizado sin levantar el bolígrafo. Por tanto, dicha componente estará compuesta de varios strokes (Plamondon and Maarse, 1989)
122
Summary in Spanish / Resumen en Español fue realizada (Lau, 2005),la estimación de los strokes que componen una firma (por ejemplo (Lau et al., 2002)), etc. A pesar de la novedad de estos enfoques, de un modo similar a On-2-On, Off-2-Off y On-2-Off, en la verificación de firmas dinámicas en la modalidad Off-2-On, el objetivo sigue siendo lograr un rendimiento comparable al de una firma real on-line. Contrario a la escritura a mano, las firmas a menudo están compuestas por un número de trazos que se solapan a trazos escritos anteriormente. Este efecto crea zonas ambiguas de detección obteniendo ni el orden de escritura real ni la verdadera segmentación de strokes en la mayoría de los casos. Sin embargo, algunas de las técnicas y enfoques estudiados en (Nguyen and Blumenstein, 2010) merecerían ser tenidos en cuenta para un proceso Off-2-On.
Con el fin de organizar la literatura sobre generación de duplicados de firma, la Tabla B.1 resumen esquemáticamente el estado del arte actual. Un ejemplo visual sobre generación artificial de variabilidad intra-personal es ilustrado en la figura B.4.
Generación completa de firmas sintéticas En la generación de la firma totalmente sintética, los algoritmos empiezan sin ninguna firma real como referencia. En esta modalidad, a menudo los algoritmos definen una nueva identidad en primer lugar. A continuación, los algoritmos deben ser capaces de generar posibles firmas ejecutadas por una identidad virtual. Con este propósito, los algoritmos necesitan ser adaptados para poder simular condiciones reales de disimilitud entre dos ejemplares ejecutados por el mismo firmante. Por otro lado, un uso de estas bases de datos sintéticas es probar los sistemas con el fin de crear puntos de referencia comunes con resultados estadísticamente significativos. A estos efectos, la generación de falsificación sintética de firmas también ha de tenerse en cuenta en los generadores de firma sintéticos. Además, la generación de la firma también depende de la escritura que estamos tratando de reproducir. De esta manera, es probable que algunas reglas y lógicas deban de ser modificadas con el fin de simular efectos realistas típicos de cada escritura, con especial atención a las peculiaridades de cada lengua. Por ejemplo, las firmas occidentales están compuestas típicamente por texto y rúbricas; las firmas chinas o japonesas están diseñadas con símbolos y así sucesivamente. Uno de los primeros trabajos sobre la generación de firmas sintética es atribuido a la escritura occidental. Específicamente, en (Popel, 2007) se describe un modelo para generar firmas dinámicas basadas en características visuales extraídas del dominio temporal. En este
123
Fig. B.4 Generación artificial de variabilidad intra-personal. La primera subfigura muestra dos firmas reales (en rojo y en azul), las cuales fueron usadas para generar artificialmente el resto de firmas (en gris). Algunas fuentes de variabilidad intra-personal artificial podrían ser atribuidas a: 1) letras conectadas o no conectadas; 2) lazos abiertos o cerrados; 3) variabilidad en las formas de los lazos (más ovalados o más redondeados); 4) variabilidad en el largo de los strokes. La figura es parcialmente extraída de (Rabasse et al., 2008)
124
Summary in Spanish / Resumen en Español
Table B.1 Trabajos relacionados con la generación de duplicados de firmas Conversión Autores Métodos Semilla1 Objetivo On-2-On Munich et al., Transformaciones >1 Evaluación estadística 2003 (Munich afines o geométricas firma significativa and Perona, 2003) On-2-On Rabasse et al., Transformaciones 2 firmas Obtener rendimientos 2007 (Rabasse afines o geométricas reales et al., 2007) On-2-On Galbally et al., Transformaciones 1 firma Mejora la eficiencia del 2009 (Galbally afines o geométricas sistema et al., 2009) On-2-On Song et al., Algoritmo de selección >1 Mejora la eficiencia del 2014 (Song and de clones firma sistema Sun, 2014) On-2-Off Rabasse et al., Transformaciones 2 firmas Obtener rendimientos 2008 (Rabasse afines o geométricas reales et al., 2008) On-2-Off Guest et al., Métodos de interpo- 1 firma Obtener rendimientos 2014 (Guest et al., lación reales 2014) On-2-Off Galbally et al., Modelo de deposición 1 firma Obtener rendimientos 2015 (Galbally de tinta reales et al., 2015) Off-2-Off Oliveira et al., Procedimientos de 1 Sign. Aumentar la base de 1997 (de Oliveira convolución de señales datos et al., 1997) polinomiales Off-2-Off Huang et al., Transformaciones 1 firma Mejora la eficiencia del 1997 (Huang and afines o geométricas sistema Yan, 1997) Off-2-Off Fang et al., Métodos elásticos de 2 firmas Mejora la eficiencia del 2002 (Fang et al., comparación sistema 2002) Off-2-Off Frias et al., Transformaciones 1 firma Aumentar la base de 2006 (Frias- afines o geométricas datos Martinez et al., 2006) Off-2-On No resuelto Semilla se refiere al número de firmas necesarias para llevar a cabo la conversión
125 Table B.2 Trabajos relacionados con la generación completa de firmas sintéticas Modalidad On-line
On-line
Autores Popel, 2007 (Popel, 2007) Galbally et al., 2012 (Galbally et al., 2012a,b)
Métodos Lengua Características vi- Rúbricas suales extraídas del dominio del tiempo Análisis espectral y Rúbricas teoría cinemática de los movimientos rápidos
Tipo de firmas Genuinas
Genuinas
Fig. B.5 Representación visual de firmas sintéticas, siendo las firmas reales resaltadas en gris. Subconjunto extraído de (Galbally et al., 2012a,b) caso, se generaron rúbricas, cuyo estilo es cercano a la de la escritura occidental. Tras una validación visual, no se clarifican resultados cuantitativos. En Galbally et al. (Galbally et al., 2012a,b) se propone la generación total de firmas basadas en rúbricas. El trabajo se llevó a cabo a través de dos algoritmos basados en el análisis espectral y en la teoría cinemática de los movimientos humanos rápidos. Aparte de la validación visual, las evaluaciones cuantitativas se llevaron a cabo principalmente en términos de rendimiento comparativo con bases de datos reales. Una visión general de firmas sintéticas se ilustra en la figura B.5. También algunas características cuantitativas se dan en la Tabla B.2.
126
Summary in Spanish / Resumen en Español
Objetivos Esta disertación defiende la hipótesis siguiente: La generación de firmas sintéticas para fines biométricos pueden ser modelada a través de algoritmos inspirados en la teoría motor equivalente. Esto es desarrollado a través de dos tipos de generación: 1) Generación de nuevas identidades que modelan la variabilidad intra-personal y 2) Generación de duplicados de firmas a partir de una muestra para modelar la variabilidad intra-personal. El objetivo de esta tesis es el diseño de algoritmos para generar tanto firmas sintéticas (modelado inter-personal) como firmas duplicadas (modelado intra-personal) bajo la inspiración de la teoría motora equivalente. A diferencia de los modelos propuestos en la literatura, los modelos defendidos en esta tesis permiten dividir el complejo proceso de escritura en las diferentes etapas basadas en aspectos cognitivos y neuromotores. Además de permitir comprender mejor el funcionamiento humano de generación de escritura debido a que los modelos propuestos buscan imitar los procesos biológicos en un modo cercano a la realidad, éstos modelos permiten mayor flexibilidad para adaptarse a las diferentes morfologías, léxico y demás peculiaridades de la escritura real. Para evaluar la cercanía de las firmas sintéticas con respecto a las firmas reales, se han realizado dos validaciones: una orientada a la percepción de la máquina y otra a la percepción humana: • Percepción de la máquina: Las firmas sintéticas son usadas en los sistemas de verificación de firmas del estado del arte para analizar si estos sistemas “ven” de manera igual las firmas sintéticas y las firmas reales. • Percepción humana: Diferentes pruebas a través de test de Turing visuales son realizados para analizar la confusión, si hubiese, entre las firmas reales y las firmas sintéticas. Obviamente, el hecho de que esta Tesis se ha desarrollado utilizando conceptos de neurociencia, no significa que se reclama ninguna fidelidad a los procesos cognitivos y neuromotores que subyacen en la producción real de la firma. Específicamente, los objetivos de esta tesis pueden enumerarse en los siguientes subobjetivos:
127 1. Identificar el léxico y morfología de las firmas manuscritas occidentales. Este objetivo consiste en estudiar diferentes características de las firmas manuscritas que permitan su modelado posterior. Es decir, se pretende estudiar diferentes parámetros como son: letras conectadas o no, inclinación de la firma, número de palabras y/o letras en una firma, complejidad de las rúbricas según el número de esquinas, etc. Este objetivo es crucial para una buena síntesis de firmas que pretende lograr firmas con apariencia real. 2. Estudiar métodos de generación de firmas estáticas a partir de las firmas dinámicas reales (On-2-Off) Este objetivo consiste en diseñar un algoritmo inspirado en la teoría motor equivalente que reciba como input una firma dinámica. Tras una serie de distorsiones a las coordenadas verticales y horizontales de cada componente se propone diseñar una versión estática de la firma a partir de un modelo de deposición de tinta. Además de la percepción realista de las imágenes de las firmas, este objetivo será evaluado mejorando los rendimientos los sistemas de verificación de firma real al aumentar el conjunto de referencia con firmas duplicadas. 3. Estudiar métodos de generación de firmas estáticas a partir de las firmas estáticas reales (Off-2-Off) Este objetivo consiste en aumentar un conjunto de firmas de referencia a través del diseño de un algoritmo que duplique la imagen de una firma. Con lo cual, el algoritmo inicialmente tomará una imagen de una firma y comenzará un proceso de distorsión bajo las perspectivas del modelo motor equivalente que permitan generar otra posible firma realizada por el mismo escritor. Diferentes bases de datos y diferentes sistemas probarán la eficiencia de este generador. 4. Estudiar métodos de generación de firmas dinámicas a partir de las firmas dinámicas reales (On-2-Off) Este objetivo consiste en generar firmas dinámicas a partir de firmas dinámicas reales. El diseño del algoritmo que satisface este objetivo se llevará a cabo a través de la teoría cinemática de los movimientos rápidos de la mano fundamentalmente. Debido a que las firmas dinámicas alcanzan errores mucho más competitivos que las firmas estáticas, este objetivo será estudiado analizando la capacidad de la eficiencia de varias bases de datos y sistemas de verificación de firmas usando una sola firma de entrenamiento.
128
Summary in Spanish / Resumen en Español
5. Estudiar métodos de síntesis completa de firmas manuscritas dinámicas y estáticas simultáneamente. Este objetivo consiste en diseñar un algoritmo que permita la generación de firmas estáticas y dinámicas al mismo tiempo. Además, el algoritmo tendrá en cuenta las distribuciones estadísticas de los aspectos morfológicos y del léxico de las firmas como conocimiento inicial. Posteriormente, el algoritmo generará una versión estática en primer lugar y luego una versión pseudodinámica bajo las propiedades lognormales de los movimientos rápidos de la mano. Las validaciones de este objetivo serán llevadas a cabo a través de test de Turing visuales y de la verificación de firmas usando múltiples bases de datos.
129
Planteamiento y Metodología Observaciones en la teoría motor equivalente La mayoría de los métodos comentados en la sección anterior para sintetizar y duplicar firmas usan deformaciones geométricas y afines en su mayoría. La capacidad de estas deformaciones han sido exitosamente probadas. Sin embargo, en esta tesis se hace la siguiente pregunta: Debido a que la ejecución de una firma implica activar un sistema humano complejo, ¿Seremos capaces de proponer sistemas suficientemente robustos para sintetizar y duplicar firmas diseñando algoritmos bajo las observaciones en la teoría motor equivalente? Es bien conocido que el procedimiento de realizar una firma implica a un sistema motor complejo de alta complejidad para generar la trayectoria de la firma a través de movimientos aprendidos y bien entrenados. Este procedimiento podría ser descrito por la teoría motor equivalente la cual define la habilidad personal de realizar el mismo movimiento a través de diferentes efectores o extremidades. La teoría motor equivalente fue formulada alrededor del pasado siglo por Lashley (Lashley, 1930), luego por Hebb (Hebb, 1949) y más tarde por Bernstein (Bernstein, 1967). Brevemente, esta teoría estudia la actividad del sistema nervioso central (CNS), la cual controla la postura, el movimiento y está enfocada en las propiedades cinemáticas desde un punto de vista esquelético muscular. La teoría motor equivalente (Marcelli et al., 2013; Wing, 2000) sugiere que el cerebro almacena movimientos, dirigidos a realizar una tarea individual en dos modos: • Modo 1: independiente del efector usado: De un modo abstracto, esta modalidad se refiere a la posición espacial de los puntos que definen los strokes que componen una trayectoria determinada. Estos puntos se conocen como el plan de trayectoria y representan la posición espacial relativa de todos los strokes. La corteza parietal en general es sugerida en (Marcelli et al., 2013) como la región del cerebro más importante para la representación de la acción del plan de trayectoria. Siendo el ganglio basal implicado en el aprendizaje de los puntos objetivos de la trayectoria. • Modo 2: Dependiente del efector usado: Este modo surge como consecuencia de una sucesión de comandos motores dirigidos a obtener una contracción muscular particular así como de una articulación de los movimientos. Es supuesto que la corteza motora interactúa con el cerebelo con el
130
Summary in Spanish / Resumen en Español
Fig. B.6 Descripción del sistema motor equivalente. Figura obtenida de Marcelli et al., 2013 (Marcelli et al., 2013) fin de seleccionar los puntos objetivos de la trayectoria y el conjunto de comandos motores para ejecutar un movimiento. Un esquema de este procedimiento es ilustrado en la figura B.6. Aunque tanto el efector independiente como el efector dependiente suelen ser bastante estables, hay un cierto grado de variabilidad entre ellos. A menudo son sensibles a entradas externas y estados psicológicos disonantes. De hecho, bajo presión, por ejemplo, un individuo necesita recordar su firma antes de firmar, produciendo un resultado con una alta variabilidad (variabilidad intra-personal) y, a veces, con apariencia poco natural. Distorsiones similares en la variabilidad intra-personal pueden suceder debido a enfermedades psiquiátricas y al efecto del envejecimiento. Esto produce que los músculos que intervienen en la producción de la trayectoria cambien, además de otros efectos como son la posición del sujeto que escribe, el estado anímico o de salud, etc, afectando, por tanto, a la variabilidad de la firma. Por otro lado, existe una correlación entre ambos efectores. Por ejemplo, algunas partes de la firma que necesitan mayor detalle suelen estar atribuidas a una rejilla densa, la cual conlleva a una velocidad del aparato motor más reducida para poder completar la trayectoria deseada. Por esta razón, la información dinámica podría ser usada también para ajustar la inercia del aparato motor y debería estar disponible para validar el uso de los modelos que se proponen. En (Kawato, 1999) se sugiere que los movimientos rápidos y coordinados no pueden ser ejecutados de manera individual bajo un control de retorno (feedback) solamente, debido
131 a que ese feedback biológico es lento y no llega a tiempo de controlar el movimiento. Por ello, en (Kawato, 1999) se propone que el cerebro necesita adquirir un modelo inverso que controle el aprendizaje motor. Focalizándose en el modelo inverso interno de la cápsula interna (limbo post.) creado por el cerebelo, en (Kawato, 1999) se calculan los comandos motores los cuales compensan la dinámica del brazo. Por lo tanto, en las etapas iniciales del desarrollo humano, la acción de escribir demanda una alta atención, se ejecuta lentamente y no es particularmente definida correctamente. Sin embargo, después de practicar mucho tiempo, los movimientos comienzan a ser rápidos, suaves, automáticos y se realizan sin esfuerzo, usando mínimos requerimientos cognitivos. Esto sugiere que el modelo interno podría ser replicado a través de filtros cinemáticos. Aplicando el modelo motor equivalente a la escritura, el plan de acción podría ser representado en términos de strokes, los cuales son codificados en términos de su posición relativa y dirección espacial. Una vez el movimiento ha sido planeado, el control motor da salida a los comandos específicos de los músculos que intervienen en la producción de la escritura. Una de las grandes utilidades de esta teoría es que provee un esquema que permite diseñar algoritmos para sintetizar y duplicar firmas inspiradas en la teoría motor equivalente. En resumen, diferentes modelos son propuestos en esta tesis con el fin de tender un puente entre los métodos heurísticos usados en la literatura y los métodos centrados en la apariencia realista para generar y modelar tanto la variabilidad inter- como intra-personal.
Métricas utilizadas En esta tesis se utilizan las típicas métricas usadas para evaluar el rendimiento de los sistemas biométricos basados en firmas (Blumenstein et al., 2010). Estas mediciones de rendimiento tienen en cuenta dos tipos clásicos de tasas de error: error de tipo I o FRR para medir el falso rechazo de las firmas auténticas y el error de tipo II o FAR, que evalúa la falsa aceptación de una firma. Como métrica común, los resultados se dan en términos de Tasa de Igual Error (EER) y en área bajo la curva (AUC), ya que éstas representan el punto operativo cuando el tipo de error I y II son coincidentes.
Bases de datos En esta tesis se han usado las siguientes bases de datos para validar los modelos presentados. Éstas se describen a continuación:
132
Summary in Spanish / Resumen en Español
Bases de datos de firma Off-line • GPDS-881 Off-line Signature DB (Blumenstein et al., 2010; Ferrer et al., 2012a). Esta base de datos consiste en 881 usuarios con 24 firmas genuinas y 30 firmas falsas por usuario. En total la base de datos contiene 881 x 24 = 21144 y 881 x 30 = 26430 firmas genuinas y falsificaciones respectivamente, escaneadas a 600 dpi. • GPDS-300 Off-line Signature DB (Blumenstein et al., 2010; Ferrer et al., 2012a). Esta base de datos es idéntica a la GPDS-881 Off-line Signature DB, pero con sólo los 300 primeros usuarios. • MCYT-75 Off-line Signature DB (Fierrez-Aguilar et al., 2004; Ortega-Garcia et al., 2003). Esta base de datos incluye 75 firmantes con 15 firmas genuinas y 15 falsas adquiridas en dos sesiones. Todas las firmas fueron depositadas usando el mismo bolígrafo. Luego las hojas fueron escaneadas a 600 dpi con 256 niveles de gris. Bases de datos de firma On-line • SUSIG-Visual sub-corpus (Kholmatov and Yanikoglu, 2009) Esta base de datos es considerada en muchos artículos científicos. Esta base de datos contiene 94 usuarios con 20 firmas genuinas y 10 firmas falsas por usuario. Esta base de datos fue adquirida usando un dispositivo LCD. • SUSIG-Blind sub-corpus (Kholmatov and Yanikoglu, 2009) Esta base de datos consiste en 88 usuarios con 8 ó 10 firmas genuinas y 10 falsificaciones. Los voluntarios no podían ver la trayectoria de la firma que realizaban durante el proceso de adquisición de la firma. • SVC-Task1 sub-corpus (Yeung et al., 2004) Esta base de datos incluye tanto firmas en escritura china como inglesas, capturadas con una WACOM tablet. Este subcorpus está compuesto de 40 usuarios con 20 firmas genuinas y 20 falsificaciones. Este sub-corpus no es tan popular como el próximo debido a que sólo la dinámica de la firma es incluida. • SVC-Task2 sub-corpus (Yeung et al., 2004)
133 Esta base de datos es una de los más usados debido a que se registró la presión y la orientación del bolígrafo. Está compuesto por 40 usuarios con 20 firmas genuinas y 20 falsificaciones. • MCYT-330 corpus (Ortega-Garcia et al., 2003) Esta base de datos es la base de datos completa MCYT, la cual fue capturada usando una WACOM tablet. Contiene 330 usuarios con 20 firmas genuinas y 25 falsificaciones. • MCYT-100 sub-corpus (Ortega-Garcia et al., 2003) Esta base de datos es una parte de la base de datos MCYT330 and contiene 100 usuarios y se organiza igual que la anterior. • SG-NOTE database (Martinez-Diaz et al., 2014) Esta es una de las pocas bases de datos públicas de firmas capturadas con un dispositivo móvil. Esta base de datos fue capturada usando un Samsung Galaxy Note, está compuesta de 25 usuarios con 20 firmas genuinas. Off and On-line signature databases simultaneously • BiosecureID-Signature UAM subcorpus (Ortega-Garcia et al., 2010). Se compone de 132 usuarios, con 16 firmas genuinas y 12 falsificaciones. La base de datos contiene la misma firma en versión on-line y off-line. Se usó una Intuos3 A4/Inking pen tablet a 100 Hz y un papel sobre el dispositivo, que luego se escaneó a 600 dpi. • NISDCC database (Alewijnse et al., 2009; Blankers et al., 2009). Una parte de esta base de datos, procesada por el Netherlands Forensic Institute, fue usada durante la competición de firmas de ICDAR 2009. La base de datos contiene la versión on-line y off-line de 100 usuarios con 12 firmas genuinas y 6 falsificaciones por firma. En total, el corpus contiene 1953 firmas.
Sistemas de verificación de firmas automáticos Los sistemas de verificación de firmas automáticos usados en esta tesis se describen a continuación:
134
Summary in Spanish / Resumen en Español
Sistemas Off-line • Características geométricas + HMM. (Ferrer et al., 2005). La firma primero se parametriza en coordenadas polares y cartesianas. Luego ambas características se combinan a nivel de scores. Como clasificador, un Hidden Markov Model (HMM) es usado. • Características Grid + BFS (Eskander et al., 2013). Este sistema usa la técnica de Boosting Feature Selection (BFS) (Tieu and Viola, 2004) para crear un clasificador robusto a partir de clasificadores débiles pero útiles. El sistema extrae de la firma un gran número de características grid que luego son usadas en el entrenamiento. • Características de Textura + SVM. (Ferrer et al., 2012a). El sistema usa características tales como el local binary pattern (LBP) y el local derivative pattern (LDP). Luego ambas características son usadas en la fase de clasificación, la cual se realiza a través de una SVM. El resultado final es una combinación a nivel de score. • Características grid + SVM (Zois et al., 2016). Este sistema usa el esqueleto de la firma para calcular la matriz de características. La fase de clasificación se lleva a cabo usando una SVM. Sistemas On-line • Basado en DTW (Diaz et al., 2015b; Fischer et al., 2015). El vector de características se componen de las señales de trayectoria primera y segunda derivada. La relación de pertenencia de una firma con respecto a las firmas de referencias se calcula usando la mínima distancia. Además, se realiza una doble etapa normalizando los scores para dar más robustez al sistema. • Basado en la distancia Manhattan (Sae-Bae and Memon, 2014). Este verificador tiene en cuenta la distribución de la primera y segunda derivada de la trayectoria así como la presión. Una vez construido el vector de características, el clasificador usa la distancia de Manhattan para su decisión final. • Basado en HMM (Fierrez et al., 2007).
135 Usando las mismas características que en el verificador basado en DTW, se ha implementado un clasificador similar al propuesto en (Fierrez et al., 2007). Se consideró α · LR HMM estados en una topología linear donde 0 < α < 1 and LR fue el promedio de los números de muestras de conjunto de firmas de referencia.
136
Summary in Spanish / Resumen en Español Table B.3 Aportaciones Originales de la tesis
Aportaciones Originales Tipo de artículo Estudio de la morfología y 1 Revista JCR léxico de las firmas Duplicados off-line a partir 4 Congresos internacionales† de firmas reales on-line
Cita (Diaz-Cabrera et al., 2015) (Diaz-Cabrera et al., 2014a,b; Ferrer et al., 2013b; Galbally et al., 2015) (Diaz et al., 2016)
Duplicados off-line a partir 1 Revista JCR de firmas reales off-line Duplicados on-line a partir 1 Congresos internacional† (Diaz et al., 2015b) de firmas reales on-line Generador de firmas sintéti- 2 Revistas JCR + 1 Congreso (Ferrer et al., 2016, cas on-line y off-line si- internacional 2013a, 2015) multáneamente † 1 Premio al mejor artículo presentado por un estudiante en conferencia internacional.
Aportaciones Originales Las Aportaciones Originales de esta tesis se engloban en 5 apartados: 1. Aportaciones Originales en cuanto al estudio de la morfología y léxico de las firmas; 2. Aportaciones Originales en cuanto a métodos de duplicados de firmas para crear firmas sintéticas off-line a partir de firma on-line real; 3. Aportaciones Originales en cuanto a métodos de duplicación de imágenes de firmas a partir de imágenes de firmas reales; 4. Aportaciones Originales en cuanto a métodos de duplicación de firmas dinámicas a partir de firmas dinámicas reales y; 5. Aportaciones Originales en cuanto a un método que genera firmas on-line y off-line al mismo tiempo. Las aportaciones en la literatura científica de estos apartados se resumen en la tabla B.3.
Estudio de la morfología y léxico de la firma El léxico y la morfología de las firmas depende estrechamente del firmante, de su comportamiento y de cómo aprendió a firmar. En las firmas occidentales algunas características particulares pueden ser usadas para definir la morfología y el léxico, por ejemplo, las firmas con una o dos rúbricas; los diferentes números de palabras distribuidas en una, dos o incluso tres líneas; características internas como la inclinación; letras de distintos tamaños con un tamaño constante con respecto al resto de letras, una firma compuesta sólo por letras mayús-
137
Fig. B.7 Ejemplo de características morfológicas y léxicas de un conjunto de firmas.
138
Summary in Spanish / Resumen en Español
culas, etc. La figura B.7 muestra algunas de estas características particulares observadas en las firmas. Este apartado es fundamental en esta tesis ya que el resto de los capítulos utilizarán parte de las distribuciones morfológicas y léxicas obtenidas aquí. Tales distribuciones ayudarán a sintetizar la firma. De hecho, cuantos más parámetros tengamos en cuenta, mayor conocimiento podemos tener de las firmas y, por tanto, mejor podremos avanzar hacia una comprensión más profunda de las características comunes y divergentes de las firmas. Las características identificadas fueron modeladas de acuerdo a bases de datos de varios países europeos para tener en cuenta los diferentes estilos de firma occidentales. En concreto se utilizó la GPDS-881 (Blumenstein et al., 2010; Ferrer et al., 2012a), MCYT-75 (FierrezAguilar et al., 2004; Ortega-Garcia et al., 2003), NISDCC database (Alewijnse et al., 2009; Blankers et al., 2009), SUSIG-Visual y SUSIG-Blind sub-corpus (Kholmatov and Yanikoglu, 2009), SVC-Task1 y SVC-Task2 (Yeung et al., 2004). Para modelar la morfología y el léxico se usó la función Generalized Extreme Value (GEV), cuya función de densidad de probabilidad f (x; µ, σ , ξ ) se define como: f (x; µ, σ , ξ ) =
1 t(x)ξ +1 e−t(x) σ
(B.1)
donde 1 + ( x−µ )ξ �−1/ξ σ t(x) = e−(x−µ)/σ
if ξ ̸= 0
(B.2)
if ξ = 0
con x limitada por µ + σ /ξ si ξ > 0 y si ξ < 0. Los símbolos µ, σ y ξ representan la localización, escala y forma de la distribución respectivamente. En esta aportación original de la tesis se obtuvo de modo analítico los parámetros de cada función independiente que modelaba una característica propia del léxico y la morfología de las firmas. La tabla B.4 muestra la media y la varianza de cada función, el valor máximo probable de las funciones, la asimetría y kurtorsis, que informan principalmente la forma de la función, los valores mínimos y máximos de la GEV y, por último, la estimación del error cuadrático medio que mide la media de los errores entre los valores reales que se presentan en un histograma y la función que aproxima dicho histograma. Los parámetros obtenidos pueden ser presumiblemente útiles para hacer frente a la normalidad de las firmas en general. Ciertamente, el comportamiento humano es bastante difícil de medir en este campo, como en otros. Sin embargo, este análisis estadístico intenta acercar el conocimiento del comportamiento de la morfología y léxico de las firmas de una población.
Letters line 1. DB1-DB2 Letters line 1. DB3-DB4 Letters line 2-1. DB1 Letters line 2-2. DB1 Slant All DBs Skew All DBs Corners (Fm) DB1-DB3 Corners (Fm) DB4 Corners (Fs) DB1 Corners (Fs) DB2 Corners (Fs) DB3 Text width All DBs Flo. width DB1-DB3 Width ratio DB1-DB3 Center ratio DB1-DB3
Shape ξ -0.30 -0.21 0.13 -0.34 -0.31 -0.09 -0.08 -0.09 0.50 -0.06 -0.33 -0.01 0.01 -0.02 -0.17
Scale σ 2.47 1.69 1.53 2.15 14.20 7.78 1.54 0.81 1.20 0.71 0.55 8.84 10.13 0.27 0.14
Local. µ 5.22 4.72 5.77 4.09 75.74 3.81 3.60 1.93 1.83 2.21 2.02 20.75 27.03 0.67 0.90
Mean 6.07 5.40 6.88 4.77 80.47 7.69 4.37 2.32 3.68 2.57 2.20 25.75 33.01 0.82 0.96
Variance 6.01 3.12 5.75 4.34 194.70 81.75 3.24 0.87 ∞ 0.71 0.28 124.64 174.96 0.11 0.02
Pr. max 0.16 0.22 0.24 0.18 0.03 0.05 0.24 0.46 0.34 0.52 0.72 0.04 0.04 1.38 2.73
Skew. -0.06 0.21 2.22 -0.19 -0.11 0.70 0.73 0.67 75.70 0.80 -0.16 1.06 1.22 1.06 0.37
Kurt. 2.71 2.84 13.65 2.75 2.72 3.75 3.81 3.65 39520.80 4.04 2.73 5.09 5.86 4.95 3.03
min. 1 1 4 1 12.31 -20.12 1 1 1 1 1 1.52 12.21 0.13 0.50
max. 12 10 12 9 120.12 40.32 1 4 7 5 3 80.23 78.12 2.30 1.50
Table B.4 Resultados analíticos con los parámetros de las distribuciones Generalized Extreme Value (GEV). MSE 4.12e-03 3.76e-03 6.78e-03 5.75e-03 4.84e-04 1.01e-03 3.29e-03 3.48e-02 1.55e-02 1.38e-02 4.10e-03 3.36e-04 4.21e-04 2.24e-02 6.99e-02
139
140
Summary in Spanish / Resumen en Español
Por último, algunas de estas distribuciones se utilizarán en las siguientes aportaciones originales de esta tesis con el fin de modelar la normalidad de las firmas. Esta aportación es aportación importante debido a que las distribuciones se usarán para generar firmas sintéticas con apariencia realista.
Duplicados off-line a partir de firmas reales on-line En esta aportación original se presenta un método para duplicar firmas off-line mediante el uso de firmas reales on-line. En la literatura, hay varios trabajos que utilizan firmas dinámicas como semilla 6 . Con lo cual, después de ciertas distorsiones aplicadas a estas firmas dinámicas, se termina creando una versión de firma off-line. Debido a la firma on-line contiene la información temporal de la trayectoria, las transiciones entre pen-down7 y pen-ups8 y otras propiedades dinámicas asociadas, el método propuesto considera toda esta información para generar esqueleto de duplicados a través de firmas 8 conectadas. Una novedad adicional de esta aportación original es la conversión realista de las firmas 8 conectados a firmas estáticas. Nótese que el modelo propuesto ha sido diseñado bajo inspiración del modelo de equivalencia motora de la firma. Por ello, teniendo en cuenta estos puntos de vista, el método intenta replicar una variabilidad intra-personal realista. Como tal, para evaluar si el modelo es capaz de generar variabilidad intra-personal, al igual que en (Galbally et al., 2009; Rabasse et al., 2008), las firmas duplicadas se utilizarán para aumentar la secuencia de entrenamiento de un ASV. Los rangos de las mejoras en el rendimiento final se analizan para estudiar los efectos beneficiosos de esta contribución sobre un ASV. En la figura B.8 podemos apreciar un esquema sobre el funcionamiento del algoritmo diseñado. Este consiste en los siguientes pasos: Segmentación de las componentes Debido a que la firma estática no contiene la información de los pen-ups, cada pen-down o componente es separada en una primera etapa del algoritmo. 6 El término semilla es usado en el contexto de duplicados de firmas para saber el número de firmas necesarias para duplicar, es decir, para obtener otra con una variabilidad intra-personal lo más realista posible. 7 Trayectoria del elemento de escritura sobre el papel que se realiza sin levantar el elemento de escritura del papel. En esta tesis se denomina también con el término componente 8 Trayectoria aérea pero cercana al papel del elemento de escritura.
141
Fig. B.8 Esquema del método propuesto basado en aspectos cognitivos para duplicar firmas. Selección de puntos perceptuales El modelo motor equivalente que describe en modo teórico cómo se ejecuta la escritura, divide una parte cognitiva y otra motora. En la parte cognitiva reside el plan de trayectoria donde se almacenan los puntos por los cuales un individuo desea trazar la trayectoria de la firma. Se estudia que esos puntos planeados no son parte de la trayectoria final. En esta aportación estos puntos no son tenidos en cuenta. Por el contrario, los puntos que son tenidos en cuenta son aquellos puntos perceptualmente relevantes de la trayectoria de la firma semilla. Para ello se han tenido en cuenta los puntos de las curvas osculantes (Trott, 2004) de la trayectoria.
142
Summary in Spanish / Resumen en Español
Fig. B.9 Componente reconstruida usando el filtro Savitsky-Golay con la interpolación de los puntos perceptualmente relevantes. Variabilidad intra-componente Esta etapa tiene en cuenta la variabilidad de las componentes individuales (intra-componente). La variabilidad cognitiva se ha tenido en cuenta modificando los puntos perceptualmente relevantes usando una transformación sinusoidal de dichos puntos en las repeticiones de las diferentes firmas duplicadas. Variabilidad inter-componente Esta etapa tiene en cuenta la variabilidad entre las componentes (inter-componente). En este caso cada componente duplicada es desplazada vertical y horizontalmente. El efecto es que dos componentes que en la firma original se tocaban pueden no tocarse en la duplicada, y viceversa. Reconstrucción de la trayectoria balística La reconstrucción balística se realiza a través del filtro Savitsky-Golay (Schafer, 2011). Este filtro es elegido por su capacidad de producir trayectorias humanas realistas (Ferrer et al., 2013a) interpolando los puntos perceptualmente relevantes. La figura B.9 muestra un efecto de este filtro. Modelo de deposición de la tinta El modelo de deposición de tinta se centra en cada píxel de la trayectoria 8-conectada o esqueleto donde deposita una elipse. Esta elipse consiste en la base de una función
143
(a) Trazo real
(b) Trazo sintético
Fig. B.10 Modelo de deposición de la tinta
144
Summary in Spanish / Resumen en Español
Fig. B.11 Esquema general del duplicador de firmas off-line. Gaussiana 2D. El resultado final de este modelo simula un trazo realista de escrita off-line. La figura B.10 muestra el resultado visual final de este modelo. Finalmente los duplicados son añadidos al entrenamiento en una prueba de verificación automática de firmas usando un verificador del estado del arte. Los resultados han corroborado que el entrenamiento con pocas firmas puede verse muy beneficiado si usa duplicados de firmas aumentando artificialmente el número de muestras.
Duplicados off-line a partir de firmas reales off-line Otra aportación original es realizada con el fin de modelar la variabilidad intra-personal de firmas off-line. De hecho, el modelar esta variabilidad intra-personal, es un desafío abierto que ha captado la atención de los investigadores en el reconocimiento de patrones y la inteligencia artificial. Este modelado se realiza a través de la generación de muestras duplicadas con aspecto realista a partir de una firma off-line real. El diseño del algoritmo de generación de firmas (duplicador) se ha realizado inspirado en la teoría de equivalencia motora. En esta aportación original, el duplicador de firmas off-line para el modelado de la variabilidad intra-personal es evaluado por incrementando una secuencia de entrenamiento de firmas reales usando firmas duplicadas. Con el fin de obtener una evaluación más robusta, el duplicador se ha probado con cuatro verificadores distintos y dos bases de datos de firmas públicas. En la figura B.11 se ilustra un esquema de los diferentes pasos del duplicador, los cuales se comentan resumidamente a continuación:
145 Segmentación de firmas Una vez la firma escrita en papel es digitalizada, el proceso de segmentación elimina el fondo de la imagen escaneada, eliminando cuidadosamente el ruido de los bordes de los trazos y recortando el marco de la imagen. Variabilidad intra-componente Esta etapa del duplicador modifica la imagen de la firma globalmente y se basa en una distorsión síncrona que alarga o encoge de manera variable cada trazo de forma similar a la humana. Esta deformación síncrona puede conseguirse aplicando diferentes deformaciones en la imagen, por ejemplo trasformaciones cuadráticas, difeomorfismo, etc. En este caso se han usado las transformaciones sinusoidales, aplicando la siguiente ecuación:
xs = x + Ax sin (ωx x + ϕx ) ys = y + Ay sin (ωy y + ϕy )
(B.3)
Siendo x e y las coordenadas de la imagen original, xs e ys las coordenadas de la imagen resultante, Ax , Ay , ωx , ωy , ϕx , ϕy los parámetros de la transformación sinusoidal que controlan la variabilidad intra-componente. Los rangos de dichas componentes se modelan heurísticamente aproximando resultados realistas. Etiquetado de las componentes En este caso se buscan aquellos trazos que no están conectados y se separan. La imagen se preprocesa con al menos alguna operación morfológica que facilite separarla en trazos. La búsqueda de posibles conexiones se hace en las 8 direcciones de cada pixel de la imagen. Variabilidad entre-componentes Esta variabilidad se consigue perturbando la posición de las componentes detectadas. Simula la variabilidad que aparece en la posición inicial de un trazo. Debido a ello, al menos una función de probabilidad usada en el modelado de fenómenos físicos, como la distribución de Valores Extremos Generalizados (GEV), entre otras, sería requerida para aplicar desplazamientos aleatorios en la dirección vertical y horizontal.
146
Summary in Spanish / Resumen en Español
Inclinación de la firma Esta característica es común en las diferentes repeticiones de la firma. Se imita principalmente la pose del firmante respecto al papel. El grado de inclinación es modelado también por otra función de probabilidad. A modo de ejemplo, en la figura B.13 se ilustra una firma real y sus duplicados. Por otro lado, en la figura B.12 se ilustra múltiples firmas reales y sus duplicados. Nótese que cada duplicado necesita de una sola firma como semilla. Los experimentos realizados han validado la solidez del duplicador con respecto a cada base de datos usada donde, a coste cero el duplicador supera en todos los casos los resultados de verificación sin firmas duplicadas. En las figuras B.14 y B.15 podemos apreciar las curvas ROC para las dos bases de datos usadas: GPDS-300 y MCYT-75. Estas figuras representan la eficiencia de cuatro sistemas entrenados con cinco firmas reales y 0, 1, 5, 10, 20 firmas duplicadas por cada firma real. Estos resultados sugieren que a mayor número de duplicados, mayor eficiencia de los sistemas. Por otro lado, como tendencia general, los resultados experimentales conducen a la conclusión de que 20 muestras duplicadas tienen un efecto similar, en términos de rendimiento promedio, a tres firmas reales. Como caso particular, en la prueba de falsificación con firmas genuinas de otros firmantes, el uso de duplicados reportó resultados equivalentes al usar cinco firmas reales adicionales en el entrenamiento de los sistemas.
Duplicados on-line a partir de firmas reales on-line Similar a la aportación anterior, en este caso se propone modelar la variabilidad intra-personal de firmas on-line (dinámicas). Para ello, el duplicador es totalmente rediseñado con el fin de atender a la tipología de este tipo de firmas, la cual es totalmente diferente de las firmas off-line. Por ejemplo, mientras en las firmas off-line se trabaja típicamente con algoritmos basados en la visión por computador, en firmas on-line los algoritmos procesan señales con secuencias temporales. Eventualmente, estas señales pueden se convertidas a imágenes y trabajar con ambas tipologías al mismo tiempo (Galbally et al., 2015). Modelo sigma-lognormal Una de las principales ventajas del modelo sigma-lognormal normal es su capacidad para la descomposición del movimiento neuromuscular en trazos elementales y la recuperación del plan de acción inicial. Esto nos permite generar nuevas trayectorias manteniendo la variabilidad intra-personales a nivel de stroke, en lugar de alterar la trayectoria observada.
147
Fig. B.12 Ejemplo de múltiples firmas a partir de una firma real. La primera columna muestra la firma original y el resto de columnas los duplicados. Algunos detalles de la variabilidad conseguida se muestran a través de círculos grises.
148
Summary in Spanish / Resumen en Español
Fig. B.13 Firma real y duplicados sintéticos
149
Fig. B.14 Curvas ROC entrenando con 5 firmas reales y cuatro sistemas usando la GPDS-300.
Fig. B.15 Curvas ROC entrenando con 5 firmas reales y cuatro sistemas usando la MCYT-75.
150
Summary in Spanish / Resumen en Español
Fig. B.16 Modificación del plan de acción a través de una translación del punto (1) al punto (2). Brevemente, la trayectoria de la firma es descompuesta por stroke. Luego, cada stroke es representado por seis parámetros, tal como se muestra en la siguiente ecuación: Pi = (Di ,t0i , µi , σi , θsi , θei )
(B.4)
Una explicación de este modelo se detalla aquí (O’Reilly and Plamondon, 2009)9 . A partir de este modelo, en esta tesis como aportación original se proponen dos métodos para la duplicación de la firma de referencia: un método de distorsión de los parámetros Sigma-Lognormal (stroke-wise) y un método de distorsión del plan de acción (target-wise). En cada método, se modifican los parámetros analíticos de la firma. Método stroke-wise Este método consiste en duplicar las firmas a través de la modificación aleatoria de los parámetros analíticos de cada stroke. Es decir, la modificación individual de cada stroke permite generar una nueva muestra que es usada en el entrenamiento. Método target-wise Este método consiste en mover los puntos del plan de acción a través de desplazamientos sinusoidales. La figura B.16 ilustra el movimiento de uno de los puntos del plan de acción. 9 Nótese
que el uso de este modelo no es una aportación original de esta tesis.
151 Evaluación La evaluación de estos duplicados se realiza por dos vías. La primera vía es un test visual de Turing y la segunda es similar a la aportación original anterior, es decir, se evalúa la capacidad de modelar efectivamente la variabilidad intra-personal añadiendo firmas duplicadas al entrenamiento de los sistemas. En el test visual de Turing se ha medido la confusión al mostrarle a los voluntarios 100 pares de firmas. Una firma era hecha por un humano y la otra la debían de adivinar ellos. La confusión fue medida a partir de los siguientes errores. • False Stroke-Wise Rate (FSWR): Se denomina al error de clasificar como real una firma duplicada diseñada por el método stroke-wise. • False Target-Wise Rate (FTWR): Se denomina al error de clasificar como real una firma duplicada diseñada por el método target-wise. • False Real Rate (FRR): El error medio entre FSWR y FTWR.
Fig. B.17 Subconjunto de firmas usadas en el test visual de Turing. Cuando no hay asterisco se muestran las firmas realizas por humanos, * significa firmas duplicadas con el método stroke-wise y ** significa duplicadas con el método target-wise.
152
Summary in Spanish / Resumen en Español Table B.5 Resultados del experimento de Turing visual FSWR
FTWR
FRR
FDR
ACE
50.78 %
52.33 %
51.56 %
51.59 %
51.57 %
• False Duplicated Rate (FDR): El error cometido cuando una firma duplicada es juzgada como real. • Average Classification Error (ACE): Una medida global la cual contempla la media entre FRR y FDR. Estos errores se recogen en la tabla B.5. Se concluye con que las firmas duplicadas son capaces de generar confusión desde un punto de vista perceptual ya que los resultados rondan en torno al 50 %, que es el valor de máxima confusión. Por otro lado, se evalúa introducir duplicados realizados con ambos métodos en tres verificadores diferentes y usando seis bases de datos distintas. En este caso se evalúa la capacidad de un sistema de verificación basado en una sola firma de referencia. En términos generales, los resultados experimentales realzan la robustez del sistema de verificación de firmas usando una firma sola de referencia con ambos métodos de duplicación. La tendencia común que se observa en todos los casos es que usando firmas duplicadas se puede mejorar los resultados de base (baseline). Además, se puede decir que con ambos métodos (SW y TW) se logran unos resultados similares. Por ello, es complejo decidir cual de los dos métodos es más conveniente. Adicionalmente, la figura B.18 ilustra las curvas ROC para las pruebas de falsificadores aleatorios y de falsificadores cualificados. Estos resultados concluyen con que ambos métodos de duplicación imitan en un modo razonable la variabilidad intra-personal de las firmas dinámicas de diferentes bases de datos. Se destaca finalmente, que la mayor mejora se logra con el sistema basado en DTW.
Generador de firmas sintéticas on-line y off-line simultáneamente A diferencia de las aportaciones originales anteriores, esta aportación consiste en un motor único que genera firmas sintéticas on-line y off-line sin ninguna semilla. El modelo de generación de firmas tiene en cuenta el modelo motor equivalente en las distintas partes del proceso. Además, una aportación original adicional es la generación de falsificaciones de firmas. En esta aportación se discute la viabilidad de introducir tanto variabilidad intrapersonal como variabilidad inter-personal a diferentes sistemas biométricos.
153
(a) Prueba de falsificadores aleatorios
(b) Prueba de falsificadores cualificados
Fig. B.18 Curvas ROC para las pruebas de falsificadores aleatorios y cualificados, respectivamente, usando tres verificadores y seis bases de datos. Los sistemas A, B y C corresponden con los clasificadores basados en DTW, Manhattan y HMM, respectivamente.
154
Summary in Spanish / Resumen en Español
Fig. B.19 Diagrama de bloques del generador de firmas on-line y off-line simultáneamente. Las líneas azules muestran los pen-downs y las rojas los pen-ups. Los puntos sobre las líneas azules simulan a los puntos registrados por una tableta durante la escritura. El procedimiento propuesto se ilustra en la figura B.19, se puede resumir de la siguiente manera: 1. Definición de la morfología y el léxico de la firma sintética. Para ello se usa muchas de las distribuciones comentadas en la primera aportación original de esta tesis. 2. Definición de una rejilla por usuario, basado en un mapa cognitivo artificial. 3. Representación del engrama 10 del nombre y la rúbrica como una secuencia de nodos de la red y señalando sus límites de inicio y fin, incluyendo el engrama relativo a los pen-ups. La figura B.20 ilustra una secuencia de engrama para un mejor entendimiento del uso de este concepto en esta tesis. 4. Diseño de la trayectoria de la firma aplicando un filtrado a los puntos del engrama del firmante. 10 Un
engrama puede definirse como una estructura de interconexión neuronal estable.
155
Fig. B.20 Engrama de la letra “a” en una rejilla hexagonal (izquierda). Engrama de la palabra “hello” (derecha). Los límites de los strokes son marcados con bordes más gruesos.
156
Summary in Spanish / Resumen en Español
Fig. B.21 Versión sintética dinámica de una firma 8 conectada. 5. Generación de la firma dinámica por muestreo lognormal de la trayectoria. La figura B.21 ilustra el resultado dinámico final de una firma sintética que inicialmente era estática 8 conectada. 6. Generación de múltiples muestras y falsificaciones que imitan el funcionamiento de las bases de datos reales. Finalmente, la figura B.22 y la figura B.23 muestran respectivamente diversas firmas sintéticas y firmas sintéticas que podría haber realizado un usuario genuino así como falsificaciones sintéticas.
157
Fig. B.22 Ejemplos visuales de firmas dinámicas sintéticas. Los puntos azules representan los pen-downs (o componentes) y los rojos los pen-ups (o trayectorias aéreas).
(a) Genuinas
(b) Falsificaciones
Fig. B.23 Ejemplo de firmas genuinas y falsificaciones sintéticas
158
Summary in Spanish / Resumen en Español
Finalmente, se realizaron dos test para evaluar la capacidad de sintetizar las firmas. Por un lado se realizó un test de Turing visual donde los voluntarios tuvieron que decir si una firma la realizó la máquina o una persona. La confusión fue cercana al 50 % con lo cual se validó la capacidad de generar firmas con apariencia humana. Por otro lado se evaluó la capacidad de que las firmas pudieran generar resultados similares a las firmas reales desde el punto de vista de dos sistemas de verificación estáticos y dos sistemas de verificación dinámicos. La figura B.24 muestra las curvas DET usando múltiples bases de datos y múltiples sistemas (ASVs). Una vez más, se concluyó con que el motor de generación de firmas on-line y off-line es capaz de hacer ver a la máquina que las firmas son reales.
159
Fig. B.24 Curvas DET de todos los experimentos. Las líneas continuas representan las bases de datos reales mientras que las discontinuas las sintéticas. El sistema basado en HMM Ferrer et al. (2005) se muestra en azul, en SVM Ferrer et al. (2012a) en verde, en DTW (Diaz et al., 2015b; Fischer et al., 2015) en rojo y en Manhattan (Sae-Bae and Memon, 2014) en celeste.
160
Summary in Spanish / Resumen en Español
Conclusiones Obtenidas Algunas contribuciones de esta tesis han pretendido completar la generación sintética de firmas. Para cerrar esta disertación, a continuación se exponen algunas conclusiones y líneas futuras de investigación, algunas de ellas están siendo trabajadas actualmente. La generación sintética de la firma manuscrita se presenta en la literatura bajo dos modalidades: i) Generación de firmas duplicadas (es decir, a partir de una firma real, los algoritmos generan una firma realista artificial con variabilidad intra-personal); y ii) generación de nuevas identidades (es decir, sin conocimiento previo de una firma en concreto, pero usando algunas reglas y distribuciones estadísticas, se espera que los algoritmos generen firmas realistas con variabilidad tanto intra- como inter-personal). Recientemente, los investigadores han contribuido a estas dos modalidades con propuestas genuinas. Como un avance a las técnicas anteriores, esta tesis doctoral ha propuesto varios métodos para generar firmas sintéticas inspirados en la teoría de equivalencia motora. En pocas palabras, esta teoría trata de explicar a nivel cognitivo los procesos humanos para diseñar una firma manuscrita y, a nivel de motor, los procesos de ejecución de dicha firma diseñada. Para demostrar las contribuciones propuestas, dos protocolos de validación se han seguido en la mayoría de los casos. Por un lado a través de una evaluación perceptual con de Turing visual. Esta validación permite determinar la confusión perceptual entre firmas reales y sintéticas. De esta manera, si el grado de confusión fuese elevado, podría decirse que el proceso de generación es aceptable. Por otra parte, una evaluación basada en el rendimiento de los sistemas también ha sido tenida en cuenta. Uno de los motivos de esta tesis es mejorar la tecnología actual, es decir, los sistemas de verificación automática de firmas del estado del arte. Por lo tanto, en esta tesis se ha demostrado que las firmas sintéticas son capaces de mejorar el rendimiento de los sistemas actuales, en el caso de las contribuciones sobre duplicados de firma. En el caso de generación de firmas completamente sintéticas, se ha demostrado que los verificadores son capaces de ver de modo similar las firmas reales y las sintéticas. En esta tesis se ha propuesto soluciones a las modalidades de duplicados On-2-Off, Off-2-Off y On-2-On. En la generación de la firma totalmente sintético, se ha propuesto un marco unificado para generar firmas dinámicas y estáticas simultáneamente. En la modalidad de duplicación On-2-Off, la entrada del algoritmo consiste una firma on-line. Esta modalidad ha sido previamente estudiada en la literatura aplicando varias técnicas para distorsionar la firma y, finalmente, crear una imagen de firma. Esta modalidad de duplicación ofrece muchas más posibilidades de generar variabilidad intra-personal debido a que se parte de una firma on-line, la cual posee información dinámica y temporal. En esta
161 tesis se crean duplicados de firmas off-line a partir de firmas reales usando ideas inspiradas en la teoría de la equivalencia motora. Otra novedad de este método fue el modelo de deposición de tinta virtual para resaltar el realismo de las firmas sintéticas desde un punto de vista perceptual (Ferrer et al., 2013a,b). El método fue validado mejorando el rendimiento de un verificador automático de firma estática del estado del arte, sugiriendo una aproximación válida a la variabilidad intra-personal real. Este trabajo es respaldado con su aceptación en la comunidad científica tras su comunicación en una conferencia internacional especializada (ICFHR-2014). El trabajo fue galardonado con el premio al mejor artículo presentado por un estudiante (Diaz-Cabrera et al., 2014a). En la modalidad de duplicación Off-2-Off, la entrada al algoritmo consiste en la imagen de una firma. Debido al hecho de que estimar la dinámica y la duración de la firma ejecutada es un desafío abierto en la comunidad científica hoy en día, las posibilidades para inferir la variabilidad intra-personales son mucho más ventajosos en la modalidad On-2-Off frente a la Off-2-Off. Sin embargo, más allá de la distorsiones afines y geométricas de la imagen sugeridas en la literatura, en esta tesis se propone un algoritmo basado en la teoría de la equivalencia motora. El algoritmo fue probado con dos bases de datos de firmas estáticas públicas y múltiples verificadores del estado del arte. Los resultados experimentales han demostrado la solidez del modelo duplicación cognitiva. Una vez más, la comunidad científica ha aceptado esta metodología, la cual ha sido publicada recientemente en la IEEE Transactions on Pattern Analysis Machine Intelligence journal (Diaz et al., 2016). En la modalidad de duplicación On-2-On, la entrada al algoritmo es una firma real dinámica. Uno de los motivos para duplicar las firmas es aumentar el conjunto de entrenamiento y, por lo tanto, proporcionar variabilidad intra-personal adicional con el fin de reducir las tasas de error de los sistemas. Sin embargo, sin duplicados, el rendimiento de los verificadores dinámicos son generalmente los más competitivos en la verificación automática de firma. Por lo tanto, el margen de mejora es reducido en comparación con los verificadores estáticos (Galbally et al., 2015). Por esta razón, en esta tesis se proponen dos métodos de duplicación basados en la teoría cinemática de los movimientos rápidos. Los duplicados se han utilizado para formar sistemas de verificación de firmas usando sólo una firma real de referencia - que se supone que es uno de los casos más difíciles. Además de una validación perceptual favorable, las tasas de error de tres sistemas del estado del arte se redujeron cuando múltiples bases de datos públicas de firma on-line fueron usadas. Un método inicial fue presentado en una de las conferencias más especializado en el análisis de documentos (ICDAR-2015) y su aceptación se evidenció con el premio al mejor artículo presentado por un estudiante (Diaz et al., 2015b).
162
Summary in Spanish / Resumen en Español
Se ha de tener en cuenta que todos los método de duplicación propuestos en esta tesis doctoral necesita una sola firma. Una contribución adicional a favor de esta tesis es que todos los métodos propuestos necesitan solo una firma para generar otras, a diferencia de muchas de las propuestas vistas en la literatura, las cuales requieren más de una muestra. En cuanto a la generación de firmas totalmente sintéticas, un trabajo inicial se le atribuye a (Popel, 2007), siendo el primer trabajo teórico y experimental completo presentado en (Galbally et al., 2012a,b). Mientras que sus propuestas abordaban la generación de firma dinámica, un primer trabajo sobre generación de firmas estáticas se evidenció en (Ferrer et al., 2013a, 2015). Un avance científico en la generación de firmas sintéticas es abordado en esta tesis. Una vez más, el algoritmo para generar nuevas identidades se inspira en la teoría de equivalencia motora. Probablemente la principal novedad de este trabajo es la creación de un motor unificado que genera firmas dinámicas y estáticas al mismo tiempo. Además, el método propuesto pone de manifiesto la flexibilidad de adaptarse a múltiples bases de datos de firmas, las cuales fueron compiladas en diferentes países occidentales y no occidentales. Además de generar firmas realistas perceptualmente aceptable, el objetivo de este trabajo es también que los sistemas de verificación vean de igual modo la firma sintética como la firma real a través de la comparación de las curvas DET. Estas bases de datos sintéticas están disposición del público en www.gpds.ulpgc.es. Este trabajo también fue aceptado en la literatura científica de acuerdo con la reciente publicación en la IEEE Transactions on Pattern Analysis Machine Intelligence journal (Ferrer et al., 2016). Por último, esta tesis ha evidenciado la potencia de los algoritmos de duplicación de firmas cuando se diseñan bajo el punto de vista de la teoría de equivalencia motora. El conocimiento científico compartido en el tema de la tesis doctoral, anima a seguir investigando en nuevos métodos para sintetizar firmas. Aunque los resultados actuales que ofrece esta tecnología no siguen siendo competitivos en aplicaciones industriales, esta tesis sugiere que la síntesis de firmas es una forma razonable para modelar la variabilidad intra-personal real, la cual sigue siendo impredecible y desconocida.
References Alewijnse, L., van den Heuvel, C., Stoel, R., and Franke, K. (2009). Analysis of signature complexity. In Proceedings of the 14th Biennial Conference of the International Graphonomics Society: Advances in Graphonomics, pages 6–9. (Cited on pages 20, 91, 107, 133, and 138.) Bernstein, N. A. (1967). The Co-Ordination and Regulation of Movements. Oxford, U.K.: Pergamon. (Cited on pages 13 and 129.) Bird, C., Found, B., Ballantyne, K., and Rogers, D. (2010). Forensic handwriting examiners’ opinions on the process of production of disguised and simulated signatures. Forensic Science International, 195(1 - 3):103 – 107. (Cited on pages 6, 103, and 117.) Bishop, C. M. (2006). Pattern Recognition and Machine Learning (Information Science and Statistics). Springer-Verlag New York, Inc., Secaucus, NJ, USA. (Cited on page 21.) Blankers, V., Heuvel, C., Franke, K., and Vuurpijl, L. (2009). ICDAR 2009 signature verification competition. In 10th International Conference on Document Analysis and Recognition (ICDAR), pages 1403–1407. (Cited on pages 4, 20, 91, 107, 116, 133, and 138.) Blumenstein, M., Ferrer, M., and Vargas, J. (2010). The 4nsigcomp2010 off-line signature verification competition: Scenario 2. In International Conference on Frontiers in Handwriting Recognition, (ICFHR), pages 721–726. (Cited on pages 4, 20, 105, 106, 116, 131, 132, and 138.) Brault, J. and Plamondon, R. (1993). Segmenting handwritten signatures at their perceptually important points. IEEE Transactions on Pattern Analysis and Machine Intelligence, 15(9):953–957. (Cited on pages 39 and 90.) Cootes, T., Taylor, C., Cooper, D., and Graham, J. (1995). Active shape models-their training and application. Computer Vision and Image Understanding, 61(1):38 – 59. (Cited on pages 21 and 81.) Cordella, L., De Stefano, C., Marcelli, A., and Santoro, A. (2010). Writing order recovery from off-line handwriting by graph traversal. In 20th International Conference on Pattern Recognition (ICPR), pages 1896–1899. (Cited on page 102.) Das, A., Ferrer, M. A., Pal, U., Pal, S., Diaz, M., and Blumenstein, M. (2016). Multi-script vs single-script scenarios in automatic off-line signature verification. IET Biometrics, In press. (Cited on pages 6, 18, and 118.)
164
References
de Oliveira, C., A Kaestner, C., Bortolozzi, F., and Sabourin, R. (1997). Advances in Document Image Analysis: First Brazilian Symposium, BSDIA’97 Curitiba, Brazil, November 2–5, 1997 Proceedings, chapter Generation of signatures by deformations, pages 283–298. Springer Berlin Heidelberg, Berlin, Heidelberg. (Cited on pages 8, 9, 11, 119, 121, and 124.) Diaz, M. and Ferrer, M. A. (2016). Procedimiento para evaluar la autoría común de un conjunto de firmas manuscritas estáticas dubitadas. P201600236, Submitted Spanish patent. (Cited on page 18.) Diaz, M., Ferrer, M. A., Eskander, G. S., and Sabourin, R. (2016). Generation of duplicated off-line signature images for verification systems. IEEE Transactions on Pattern Analysis and Machine Intelligence, PP(99):1–1. (Cited on pages 18, 90, 100, 136, and 161.) Diaz, M., Ferrer, M. A., Pirlo, G., Giannico, G., and Impedovo, D. (2015a). Off-line signature stability by optical flow: Feasibility study of predicting the verifier performance. In 49th IEEE International Carnahan Conference on Security Technology, pages 341–345. (Cited on page 18.) Diaz, M., Fischer, A., Plamondon, R., and Ferrer, M. A. (2015b). Towards an automatic on-line signature verifier using only one reference per signer. In Proc. IAPR International Conference on Document Analysis and Recognition (ICDAR), pages 631–635. (Cited on pages iii, 18, 61, 67, 91, 101, 109, 134, 136, 159, and 161.) Diaz-Cabrera, M., Ferrer, M., and Morales, A. (2014a). Cognitive inspired model to generate duplicated static signature images. In International Conference on Frontiers in Handwriting Recognition (ICFHR), pages 61–66. (Cited on pages iii, 18, 50, 66, 90, 136, and 161.) Diaz-Cabrera, M., Ferrer, M. A., and Morales, A. (2015). Modeling the lexical morphology of western handwritten signatures. PLoS ONE, 10(4):e0123254. (Cited on pages 17, 69, 79, and 136.) Diaz-Cabrera, M., Gomez-Barrero, M., Morales, A., and Ferrer, M. A. (2014b). Generation of enhanced synthetic off-line signatures based on real on-line data. In14th International Conference on Frontiers in Handwriting Recognition (ICFHR), pages 482–487. (Cited on pages 18 and 136.) Diaz-Cabrera, M., Morales, A., and Ferrer, M. A. (2014c). Emerging issues for static handwritten signature biometric. In Advances in Digital Handwritten Signature Processing. A Human Artefact for e-Society, pages 111–122. (Cited on pages 5, 17, and 116.) Djeziri, S., Guerfali, W., Plamondon, R., and Robert, J. (2002). Learning handwriting with pen-based systems: computational issues. Pattern Recognition, 35(5):1049 – 1057. (Cited on page 61.) Djioua, M. and Plamondon, R. (2009). A new algorithm and system for the characterization of handwriting strokes with delta-lognormal parameters. IEEE Transactions on Pattern Analysis and Machine Intelligence, 31(11):2060–2072. (Cited on pages 67, 85, and 87.)
References
165
Drempt, N., McCluskey, A., and Lannin, N. A. (2011). A review of factors that influence adult handwriting performance. Australian Occupational Therapy Journal, 58:321 – 328. (Cited on page 5.) Dutoit, T. (2001). An Introduction to Text-to-Speech Synthesis. Kluwer Academic Publishers, Norwell, MA, USA. (Cited on pages 7 and 119.) Eichhorn, T. E., Gasser, T., Mai, N., Marquardt, C., Arnold, G., Schwarz, J., and Oertel, W. (1996). Computational analysis of open loop handwriting movements in parkinson’s disease: A rapid method to detect dopamimetic effects. Movement disorders, 11(3):289 – 297. (Cited on page 103.) Erbilek, M. and Fairhurst, M. (2012). Framework for managing ageing effects in signature biometrics. IET Biometrics, 1(2):136–147. (Cited on pages 5 and 117.) Eskander, G. S., Sabourin, R., and Granger, E. (2013). Hybrid writer-independent–writerdependent offline signature verification system. IET Biometrics, 2(4):169–181. (Cited on pages 52, 108, and 134.) Fairhurst, M. (1997). Signature verification revisited: Promoting practical exploitation of biometric technology. Electronics and Communication Engineering Journal, 9(6):273–280. (Cited on pages 5 and 116.) Fang, B., Leung, C. H., Tang, Y. Y., Kwok, P. C. K., Tse, K. W., and Wong, Y. K. (2002). Offline signature verification with generated training samples. IEE Proceedings - Vision, Image and Signal Processing, 149(2):85–90. (Cited on pages 8, 9, 11, 119, 121, and 124.) Farina, D. and Merletti, R. (2000). Comparison of algorithms for estimation of EMG variables during voluntary isometric contractions. Journal of Electromyography and Kinesiology, 10(5):337 – 349. (Cited on page 82.) Faundez-Zanuy, M., Sesa-Nogueras, E., and Roure-Alcobé, J. (2012). On the relevance of age in handwritten biometric recognition. In International Carnahan Conference on Security Technology (ICCST), pages 105–109. (Cited on page 5.) Ferrer, M., Alonso, J., and Travieso, C. (2005). Offline geometric parameters for automatic signature verification using fixed-point arithmetic. IEEE Transactions on Pattern Analysis and Machine Intelligence, 27(6):993–997. (Cited on pages 52, 91, 107, 134, and 159.) Ferrer, M., Diaz, M., Carmona-Duarte, C., and Morales, A. (2016). A behavioral handwriting model for static and dynamic signature synthesis. IEEE Transactions on Pattern Analysis and Machine Intelligence, In press:1–14. (Cited on pages 18, 101, 136, and 162.) Ferrer, M., Diaz-Cabrera, M., and Morales, A. (2013a). Synthetic off-line signature image generation. In International Conference on Biometrics (ICB), pages 1–7. (Cited on pages 18, 40, 94, 100, 101, 136, 142, 161, and 162.) Ferrer, M., Diaz-Cabrera, M., and Morales, A. (2015). Static signature synthesis: A neuromotor inspired approach for biometrics. IEEE Transactions on Pattern Analysis and Machine Intelligence, 37(3):667–680. (Cited on pages 18, 71, 79, 84, 88, 93, 101, 136, and 162.)
166
References
Ferrer, M., Vargas, J., Morales, A., and Ordonez, A. (2012a). Robustness of offline signature verification based on gray level features. IEEE Transactions on Information Forensics and Security, 7(3):966–977. (Cited on pages 4, 20, 44, 48, 52, 91, 92, 105, 106, 108, 116, 132, 134, 138, and 159.) Ferrer, M. A., Diaz-Cabrera, M., Morales, A., Galbally, J., and Gomez-Barrero, M. (2013b). Realistic synthetic off-line signature generation based on synthetic on-line data. In Proc. IEEE International Carnahan Conference on Security Technology, ICCST, pages 116–121. (Cited on pages 8, 18, 84, 100, 119, 120, 136, and 161.) Ferrer, M. A., Morales, A., Vargas, J. F., Lemos, I., and Quintero, M. (2012b). Is it possible to automatically identify who has forged my signature? approaching to the identification of a static signature forger. In 10th IAPR International Workshop on Document Analysis Systems (DAS), pages 175–179. (Cited on pages 5 and 117.) Fierrez, J. and Ortega-Garcia, J. (2008). On-line signature verification, pages 189–209. Springer. (Cited on pages 5 and 116.) Fierrez, J., Ortega-Garcia, J., Ramos, D., and Gonzalez-Rodriguez, J. (2007). Hmm-based online signature verification: feature extraction and signature modeling. Pattern Recognition Letters, 28(16):2325–2334. (Cited on pages 68, 109, 110, 134, and 135.) Fierrez-Aguilar, J., Alonso-Hermira, N., Moreno-Marquez, G., and Ortega-Garcia, J. (2004). An off-line signature verification system based on fusion of local and global information. In Proc. European Conference on Computer Vision, Workshop on Biometric Authentication, BIOAW, volume 3087 of LNCS, pages 295–306. Springer. (Cited on pages 20, 81, 106, 132, and 138.) Fischer, A., Diaz, M., Plamondon, R., and Ferrer, M. A. (2015). Robust score normalization for dtw-based on-line signature verification. In International Conference on Document Anal. and Recognition (ICDAR), pages 241–245. (Cited on pages 18, 67, 91, 109, 134, and 159.) Fischer, A. and Plamondon, R. (2015). A dissimilarity measure for on-line signature verification based on the sigma-lognormal model. In Biennial Conference of the International Graphonomics Society, pages 83–86. (Cited on page 61.) Forbes, K. E., Shanks, M. F., and Venneri, A. (2004). The evolution of dysgraphia in alzheimer’s disease. Brain Research Bulletin, 63(1):19 – 24. (Cited on page 103.) Franke, K. and Rose, S. (2004). Ink-deposition model: the relation of writing and ink deposition processes. In Ninth International Workshop on Frontiers in Handwriting Recognition (IWFHR), pages 173 – 178. (Cited on page 43.) Frias-Martinez, E., Sanchez, A., and Velez, J. (2006). Support vector machines versus multilayer perceptrons for efficient off-line signature recognition. Engineering Applications of Artificial Intelligence, 19(6):693 – 704. (Cited on pages 4, 8, 11, 116, 119, 121, and 124.) Galbally, J., Diaz-Cabrera, M., Ferrer, M. A., Gomez-Barrero, M., Morales, A., and Fierrez, J. (2015). On-line signature recognition through the combination of real dynamic data and synthetically generated static data. Pattern Recognition, 48(9):2921 – 2934. (Cited on pages 4, 8, 11, 18, 101, 117, 120, 124, 136, 146, and 161.)
References
167
Galbally, J., Fierrez, J., Martinez-Diaz, M., and Ortega-Garcia, J. (2009). Improving the enrollment in dynamic signature verfication with synthetic samples. In 10th International Conference on Document Analysis and Recognition (ICDAR) , pages 1295–1299. (Cited on pages 8, 11, 37, 119, 120, 124, and 140.) Galbally, J., Fierrez, J., Ortega-Garcia, J., and Plamondon, R. (2012a). Synthetic on-line signature generation. Part II: Experimental validation. Pattern Recognition, 45:2622–2632. (Cited on pages 12, 61, 71, 93, 101, 125, and 162.) Galbally, J., Martinez-Diaz, M., and Fierrez, J. (2013). Aging in biometrics: An experimental analysis on on-line signature. PLOS ONE, 8(7):e69897. (Cited on pages 5 and 116.) Galbally, J., Plamondon, R., Fierrez, J., and Martinez-Diaz, M. (2011). Quality analysis of dynamic signature based on the sigma-lognormal model. In International Conference on Document Anal. and Recognition (ICDAR), pages 633–637. (Cited on page 61.) Galbally, J., Plamondon, R., Fierrez, J., and Ortega-Garcia, J. (2012b). Synthetic on-line signature generation. Part I: Methodology and algorithms. Pattern Recognition, 45:2610– 2621. (Cited on pages 12, 61, 65, 101, 125, and 162.) Gandadhar, G. (2006). A Neuromotor Model of Handwriting Generation: Highlighting the role of Basal Ganglia. PhD thesis, Department of Electrical Engineering, Indian Institute of Technology, Madras. (Cited on page 85.) Gomez-Barrero, M., Galbally, J., Fierrez, J., Ortega-Garcia, J., and Plamondon, R. (2015). Enhanced on-line signature verification based on skilled forgery detection using sigmalognormal features. In Conference on Biometrics (ICB), pages 501–506. (Cited on page 61.) Gomez-Barrero, M., Galbally, J., Plamondon, R., Fierrez, J., and Ortega-Garcia, J. (2013). Variations of handwritten signatures with time: A sigma-lognormal analysis. In Conference on Biometrics (ICB), pages 1–6. (Cited on page 61.) Guest, R., Hurtado, O., and Henniger, O. (2014). Assessment of methods for image recreation from signature time-series data. IET Biometrics, 3(3):159–166. (Cited on pages 8, 11, 119, 120, and 124.) Hafemann, L. G., Sabourin, R., and Oliveira, L. S. (2015). Offline handwritten signature verification - literature review. CoRR, abs/1507.07909. (Cited on pages 5 and 116.) Hafting, T., Fyhn, M., Molden, S., Moser, M.-B., and Moser, E. I. (2005). Microstructure of a spatial map in the entorhinal cortex. Nature, 436(7052):801–806. (Cited on page 15.) Haralick, R. M. and Shapiro, L. G. (1992). Computer and Robot Vision. Addison-Wesley Longman Publishing Co., Inc., Boston, MA, USA, 1st edition. (Cited on page 49.) Hebb, D. O. (1949). The Organization of Behavior: A Neuropsychological Theory. New York: Wiley and Sons. (Cited on pages 13 and 129.) Huang, K. and Yan, H. (1997). Off-line signature verification based on geometric feature extraction and neural network classification. Pattern Recognition, 30(1):9 – 17. (Cited on pages 8, 9, 11, 119, 121, and 124.)
168
References
Impedovo, D., Pirlo, G., and Plamondon, R. (2012). Handwritten signature verification: New advancements and open issues. In International Conference on Frontiers in Handwriting Recognition, (ICFHR), pages 367–372. (Cited on pages 5 and 116.) ISO/IEC (19795-X). Biometric testing and reporting defined by SC67 WG4. (Cited on pages 4 and 116.) Jain, A. K., Nandakumar, K., and Ross, A. (2016). 50 years of biometric research: Accomplishments, challenges, and opportunities. Pattern Recognition Letters, 79:80 – 105. (Cited on pages 2, 112, and 113.) Kawato, M. (1999). Internal models for motor control and trajectory planning. Current Opinion in Neurobiology, 9(6):718 – 727. (Cited on pages 14, 130, and 131.) Kholmatov, A. and Yanikoglu, B. (2009). SUSIG: an on-line signature database, associated protocols and benchmark results. Pattern Analysis and Applications, 12(3):227–236. (Cited on pages 4, 20, 67, 91, 106, 116, 132, and 138.) Kotz, S. and Nadarajah, S. (2000). Extreme Value Distributions: Theory and Applications. London: Imperial College Press. (Cited on pages 22, 51, and 83.) Lake, B. M., Salakhutdinov, R., and Tenenbaum, J. B. (2015). Human-level concept learning through probabilistic program induction. Science, 350(6266):1332–1338. (Cited on pages 71 and 93.) Lashley, K. S. (1930). Basic neural mechanisms in behavior. Psychological Review, 37(1):1– 24. (Cited on pages 13 and 129.) Lau, K. K. (2005). A new statistical stroke recovery method and measurement for signature verification. PhD thesis, Hong Kong Baptist University (People’s Republic of China). (Cited on pages 9 and 122.) Lau, K. K., Yuen, P. C., and Tang, Y. Y. (2002). Stroke extraction and stroke sequence estimation on signatures. In 16th International Conference on Pattern Recognition (ICPR), volume 3, pages 119–122 vol.3. (Cited on pages 9 and 122.) Leclerc, F. and Plamondon, R. (1994). Automatic signature verification: The state of the art—1989–1993. International Journal of Pattern Recognition and Artificial Intelligence, 8(03):643–660. (Cited on pages 5 and 116.) LeCun, Y., Bengio, Y., and Hinton, G. (2015). Deep learning. Nature, 521(7553):436–44. (Cited on page 97.) Lee, S. and Pan, J. C. (1992). Offline tracing and representation of signatures. IEEE Transactions on Systems, Man, and Cybernetics, 22(4):755–771. (Cited on pages 9 and 121.) Lin, Z. and Wan, L. (2007). Style-preserving english handwriting synthesis. Pattern Recognition, 40(7):2097 – 2109. (Cited on pages 7 and 119.)
References
169
Liwicki, M., Malik, M. I., Alewijnse, L., v. d. Heuvel, E., and Found, B. (2012). Icfhr 2012 competition on automatic forensic signature verification (4NsigComp 2012). In International Conference on Frontiers in Handwriting Recognition (ICFHR), pages 823– 828. (Cited on pages 4, 6, 116, and 117.) Liwicki, M., Malik, M. I., v. d. Heuvel, C. E., Chen, X., Berger, C., Stoel, R., Blumenstein, M., and Found, B. (2011). Signature verification competition for online and offline skilled forgeries (sigcomp2011). In International Conference on Document Analysis and Recognition (ICDAR), pages 1480–1484. (Cited on pages 4 and 116.) Liwicki, M., v. d. Heuvel, C. E., Found, B., and Malik, M. I. (2010). Forensic signature verification competition 4nsigcomp2010 - detection of simulated and disguised signatures. In International Conference on Frontiers in Handwriting Recognition (ICFHR), pages 715–720. (Cited on pages 4 and 116.) Malik, M. I., Ahmed, S., Liwicki, M., and Dengel, A. (2013a). Freak for real time forensic signature verification. In 12th International Conference on Document Analysis and Recognition, pages 971–975. (Cited on page 6.) Malik, M. I., Ahmed, S., Marcelli, A., Pal, U., Blumenstein, M., Alewijns, L., and Liwicki, M. (2015). ICDAR2015 competition on signature verification and writer identification for on- and off-line skilled forgeries (sigwicomp2015). In International Conference on Document Analysis and Recognition (ICDAR), pages 1186–1190. (Cited on pages 4 and 116.) Malik, M. I., Liwicki, M., and Dengel, A. (2013b). Part-based automatic system in comparison to human experts for forensic signature verification. In 12th International Conference on Document Analysis and Recognition (ICDAR), pages 872–876. (Cited on pages 6 and 117.) Maltoni, D., Maio, D., Jain, A. K., and Prabhakar, S. (2009). Handbook of Fingerprint Recognition. Springer London. (Cited on pages 7 and 119.) Mansfield, A. and Wayman, J. (2002). Best Practices in Testing and Reporting Performance of Biometric Devices: Version 2.01. NPL report. Centre for Mathematics and Scientific Computing, National Physical Laboratory. (Cited on pages 4 and 116.) Marcelli, A., Parziale, A., and Senatore, R. (2013). Some observations on handwriting from a motor learning perspective. In 2nd Workshop on Automated Forensic Handwriting Analysis (AFHA), pages 6–10. (Cited on pages 13, 14, 77, 129, and 130.) Marsaglia, G., Tsang, W., and Wang, J. (2003). Evaluating kolmogorov’s distribution. Journal of Statistical Software, 8(18):1–4. (Cited on page 22.) Martinez-Diaz, M., Fierrez, J., Krish, R. P., and Galbally, J. (2014). Mobile signature verification: Feature robustness and performance comparison. IET Biometrics, 3(4):267– 277. (Cited on pages 4, 67, 75, 107, 116, and 133.) Morocho, D., Morales, A., Fierrez, J., and Tolosana, R. (2016). Signature recognition: establishing human baseline performance via crowdsourcing. In 4th International Conference on Biometrics and Forensics (IWBF), pages 1–6. (Cited on pages 3 and 115.)
170
References
Munich, M. and Perona, P. (2003). Visual identification by signature tracking. IEEE Trans. on Pattern Analysis and Machine Intelligence, 25(2):200–217. (Cited on pages 8, 11, 119, 120, and 124.) Nel, E. M., du Preez, J. A., and Herbst, B. M. (2005). Estimating the pen trajectories of static signatures using hidden markov models. IEEE Transactions on Pattern Analysis and Machine Intelligence, 27(11):1733–1746. (Cited on pages 9 and 121.) Nguyen, V. and Blumenstein, M. (2010). Techniques for static handwriting trajectory recovery: A survey. In Proceedings of the 9th IAPR International Workshop on Document Analysis Systems, pages 463–470. (Cited on pages 10 and 122.) O’Reilly, C. and Plamondon, R. (2009). Development of a sigma-lognormal representation for on-line signatures. Pattern Recognition, 42(12):3324–3337. (Cited on pages 61, 63, 64, 85, 86, and 150.) O’Reilly, C. and Plamondon, R. (2011). Impact of the principal stroke risk factors on human movements. Human Movement Science, 30(4):792 – 806. (Cited on page 61.) O’Reilly, C. and Plamondon, R. (2012). Design of a neuromuscular disorders diagnostic system using human movement analysis. In 11th International Conference on Information Science, Signal Processing and their Applications (ISSPA), pages 787–792. (Cited on pages 5, 103, and 117.) Ortega-Garcia, J., Fierrez, J., Alonso-Fernandez, F., Galbally, J., Freire, M., GonzalezRodriguez, J., C.Garcia-Mateo, J.-L.Alba-Castro, E.Gonzalez-Agulla, E.Otero-Muras, S.Garcia-Salicetti, L.Allano, B.Ly-Van, B.Dorizzi, J.Kittler, T.Bourlai, N.Poh, F.Deravi, M.Ng, M.Fairhurst, J.Hennebert, A.Humm, M.Tistarelli, L.Brodo, J.Richiardi, A.Drygajlo, H.Ganster, F.M.Sukno, S.-K.Pavani, A.Frangi, L.Akarun, and A.Savran (2010). The multi-scenario multi-environment biosecure multimodal database (bmdb). IEEE Trans. on Pattern Analysis and Machine Intelligence, 32(6):1097–1111. (Cited on pages 91, 107, and 133.) Ortega-Garcia, J., Fierrez-Aguilar, J., Simon, D., Gonzalez, J., Faundez, M., Espinosa, V., Satue, A., Hernaez, I., Igarza, J. J., Vivaracho, C., Escudero, D., and Moro, Q. I. (2003). MCYT baseline corpus: A bimodal biometric database. IEE Proceedings Vision, Image and Signal Processing, 150(6):395–401. (Cited on pages 4, 20, 44, 52, 67, 81, 85, 87, 91, 106, 116, 132, 133, and 138.) Otsu, N. (1979). A threshold selection method from gray-level histograms. IEEE Transactions on Systems, Man and Cybernetics, 9(1):62–66. (Cited on page 48.) Pal, S., Alireza, A., Pal, U., and Blumenstein, M. (2012). Multi-script off-line signature identification. In International Conference on Hybrid Intelligent Systems (HIS), pages 236–240. (Cited on pages 6 and 118.) Pal, S., Blumenstein, M., and Pal, U. (2011). Non-english and non-latin signature verification systems a survey. In AFHA, pages 1–5. (Cited on pages 6 and 118.) Pirlo, G., Cuccovillo, V., Diaz-Cabrera, M., Impedovo, D., and Mignone, P. (2015a). Multidomain verification of dynamic signatures using local stability analysis. IEEE Transactions on Human-Machine Systems, 45(6):805–810. (Cited on page 18.)
References
171
Pirlo, G., Diaz, M., Ferrer, M. A., Impedovo, D., Occhionero, F., and Zurlo, U. (2015b). Early diagnosis of neurodegenerative diseases by handwritten signature analysis. In 1st International Workshop on Image-based Smart City Applications (ISCA): A Workshop of International Conference on Image Analysis and Processing (ICIAP), pages 290 – 297. (Cited on page 18.) Plamondon, R. (1995a). A kinematic theory of rapid human movements: Part I: Movement representation and generation. Biological cybernetics, 72(4):295–307. (Cited on pages 29 and 61.) Plamondon, R. (1995b). A kinematic theory of rapid human movements: Part II: Movement time and control. Biological Cybernetics,, 72(4):309–320. (Cited on pages 29 and 61.) Plamondon, R. (1998). A kinematic theory of rapid human movements. Part III: Kinematic outcomes. Biological Cybernetics, 78(2):133 – 145. (Cited on page 29.) Plamondon, R. (2003). A kinematic theory of rapid human movements. Part IV: A formal mathematical proof and new insights. Biological Cybernetics, 89(2):126 – 138. (Cited on pages 29 and 84.) Plamondon, R. and Djioua, M. (2006). A multi-level representation paradigm for handwriting stroke generation. Human Movement Science, 25(4–5):586 – 607. (Cited on pages 39, 61, and 63.) Plamondon, R. and Lorette, G. (1989). Automatic signature verification and writer identification - the state of the art. Pattern Recognition, 22(2):107 – 131. (Cited on pages 5 and 116.) Plamondon, R. and Maarse, F. J. (1989). An evaluation of motor models of handwriting. IEEE Transactions on Systems, Man, and Cybernetics, 19(5):1060–1072. (Cited on pages 9 and 121.) Plamondon, R., O’Reilly, C., Galbally, J., Almaksour, A., and Anquetil, E. (2014). Recent developments in the study of rapid human movements with the kinematic theory: Applications to handwriting and signature synthesis. Pattern Recognition Letters, 35:225–235. (Cited on pages 61 and 63.) Plamondon, R. and Srihari, S. N. (2000). On-line and off-line handwriting recognition: A comprehensive survey. IEEE Transactions on Pattern Analysis and Machine Intelligence, 22(1):63–84. (Cited on pages 5, 66, and 116.) Popel, D. V. (2007). Signature analysis, verification and synthesis in pervasive environments, volume 67, chapter In Synthesis and Analysis in Biometrics, pages 31 – 64. World Scientific. (Cited on pages 10, 12, 101, 122, 125, and 162.) Rabasse, C., Guest, R., and Fairhurst, M. (2007). A method for the synthesis of dynamic biometric signature data. In Ninth International Conference on Document Analysis and Recognition (ICDAR), volume 1, pages 168–172. (Cited on pages 8, 11, 119, 120, and 124.)
172
References
Rabasse, C., Guest, R., and Fairhurst, M. (2008). A new method for the synthesis of signature data with natural variability. IEEE Transactions on Systems, Man, and Cybernetics, Part B: Cybernetics, 38(3):691–699. (Cited on pages 8, 10, 11, 37, 119, 120, 123, 124, and 140.) Rejman-Greene, M. (2005). Biometric Systems: Technology, Design and Performance Evaluation, chapter Privacy Issues in the Application of Biometrics: a European Perspective, pages 335–359. Springer London, London. (Cited on pages 7 and 119.) Sae-Bae, N. and Memon, N. (2014). Online signature verification on mobile devices. IEEE Trans. on Information Forensics and Security, 9(6):933–947. (Cited on pages 67, 91, 109, 134, and 159.) Sakoe, H. and Chiba, S. (1978). Dynamic programming algorithm optimization for spoken word recognition. IEEE Trans. on Acoustics, Speech and Signal Processing, 26(1):43–49. (Cited on page 109.) Schafer, R. (2011). What is a savitzky-golay filter? [lecture notes]. Signal Processing Magazine, IEEE, 28(4):111–117. (Cited on pages 40 and 142.) Song, M. and Sun, Z. (2014). An immune clonal selection algorithm for synthetic signature generation. Mathematical Problems in Engineering, 2014:1–12. (Cited on pages 8, 11, 120, and 124.) Thian, N. P. H., Marcel, S., and Bengio, S. (2003). Improving face authentication using virtual samples. In International Conference on Acoustics, Speech, and Signal Processing (ICASSP)., volume 3, pages III–233–6 vol.3. (Cited on pages 7 and 119.) Thomas, A. O., Rusu, A., and Govindaraju, V. (2009). Synthetic handwritten {CAPTCHAs}. Pattern Recognition, 42(12):3365 – 3373. (Cited on page 90.) Tieu, K. and Viola, P. (2004). Boosting image retrieval. International Journal of Computer Vision, 56(1-2):17–36. (Cited on pages 108 and 134.) Trott, M. (2004). The Mathematica GuideBook for Graphics. New York: Springer-Verlag. (Cited on pages 39 and 141.) Wing, A. M. (2000). Motor control: mechanisms of motor equivalence in handwriting. Current Biology, 10:245 – 248. (Cited on pages 13, 77, and 129.) Yeung, D.-Y., Chang, H., Xiong, Y., George, S., Kashi, R., Matsumoto, T., and Rigoll, G. (2004). SVC2004: First international signature verification competition. In Biometric Authentication, volume 3072 of LNCS, pages 16–22. Springer. (Cited on pages 4, 20, 67, 91, 106, 116, 132, and 138.) Zois, E. N., Alewijnse, L., and Economou, G. (2016). Offline signature verification and quality characterization using poset-oriented grid features. Pattern Recognition, 54:162 – 177. (Cited on pages 52, 108, and 134.) Zuo, J., Schmid, N. A., and Chen, X. (2007). On generation and analysis of synthetic iris images. IEEE Transactions on Information Forensics and Security, 2(1):77–90. (Cited on pages 7 and 119.)