System Area Network Mapping Alan M. Mainwaring Brent N. Chun
Saul Schleimer Daniel S. Wilkerson
Computer Science Division University of California at Berkeley Berkeley, CA 94720
Department of Mathematics University of California at Berkeley Berkeley, CA 94720
[email protected] [email protected]
[email protected] [email protected]
Abstract: This paper presents a network mapping algorithm and proves its correctness assuming a traffic-free network. Respecting well-defined parameters, the algorithm produces a graph isomorphic to N - F, where N is the network of switches and hosts and F is the set of switches connected by a switch-bridge to the set of hosts H. We show its performance on a Myrinet system-area network with a fat-tree-like topology. It can map 36 nodes, 13 switches and 64 links in 248 ms and 100 nodes, 40 switches, and 193 links in 981 ms. From such maps, the system computes mutually deadlock-free routes and distributes them to all network interfaces. Switched, multi-gigabyte per second, system area networks are the enabling building-blocks for networks of workstations. Because of their core role, these networks should be dynamically reconfigurable, automatically adapting to the addition or removal of hosts, switches and links.
The challenge is two-fold: (1) to map networks concurrently with the execution of applications, and (2) to accomplish this without losing the high-performance communication enabled from direct, protected application access to the network hardware. As a step towards this goal, we designed a mapping algorithm and proved its correctness assuming a quiescent network. We implemented the algorithm in a network of 100 UltraSPARC workstations with a Myrinet [3] network. The system periodically discovers the network topology and uses it to compute and to distribute a set of mutually-deadlock free routes to all network interfaces.
1
Introduction
System area networks [1] move switched, low-latency, high-speed networks away from the backplanes and cabinets of massively parallel processors into the traditional territory of local area networks. These networks commonly use source-based message routing through anonymous switches. In this regime, their topologies may no longer be the static, well-defined, and well-understood [2] graphs such as hypercubes, meshes, etc., and instead may be arbitrary graphs that change over time. Therefore, systems must periodically discover their topologies rather than assuming one a priori. Lacking an out-of-band mechanism for directly querying switches for their identities, systems must use in-band messaging to disambiguate switch identities when discovering the network topology. From the resulting maps, systems can compute mutually deadlock-free routes without relying upon properties of traditional multicomputer networks, e.g., static topologies, that may now be transient.
Alan Mainwaring is supported by a National Semiconductor Corporation graduate research fellowship. Brent Chun is supported by a National Science Foundation graduate research fellowship. Saul Schleimer is supported by a Department of Mathematics fellowship. This research is also supported in part by ARPA grant F30602-95C-0014, the California State Micro Program, and Professor David Culler’s NSF Presidential Faculty Fellowship CCR-9253705. Computational and experimental infrastructure resources are supported in part by NSF Infrastructure Grant CDA-8722788.
The contributions of this paper are the description of a network mapping algorithm that derives a network map from a set of probes in sections 2 and 3, empirical performance results and characterizations in a network of interest to us in sections 4 and 5, and a discussion of open issues and future topics in this area in sections 6 and 7.
1.1
Myrinet system area networks
The Berkeley Network of Workstations [4] (NOW) uses Myrinet network switches and network interface cards. The network consists of 8-port cross-bar switches that use source-based, oblivious cut-through routing. Messages have a header flit, routing flits, a data payload, an 8-bit CRC, and a tail flit. Upon the arrival of a message, a switch uses the next routing flit to direct the message to the specified output port. Switches use relative port addressing, i.e., each routing flit specifies an output port using a turn that is relative to the input port. Should a message block and wait for an output port, the rest of the message may remain in the network, occupying switch and link resources. Switches automatically detect and break message deadlock in 50 ms. The worse case switch latency with no output port contention is 550 ns and each link supports 1.28 Gb/s data rates. Switches can be connected to other switches or to hosts in an arbitrary fashion. The switches use cut-through routing and there exists 108 bytes of per-port buffering. At one extreme with these switches, a message can form a circuit from the source to destination. At the other, under a heavy load of small messages, the network can behave more like a packet-switched one. As we show, cut-through routing through switches with even modest per-port buffering complicates the proof of our mapping algorithm. The Myrinet switch architecture enables low-cost and high-performance implementations because of its functional simplicity. For example, from the above description of message routing, each switch performs little interpretation for each message. The benefits of the simplicity are obvious - low-cost, low-latency and high-bandwidth - but the drawbacks are subtle. For example, Myrinet lacks a mechanism to query a switch directly either with in- or out-of-band messages to obtain a unique id number for it.
To appear in the proceedings of the 9th Annual Symposium on Parallel Algorithms and Architectures (SPAA’97)
1.2
Mapping the Berkeley NOW
One can envision the Berkeley NOW’s network as a collection of hosts surrounding and attached to its system area network cloud. The hosts may send special in-band probe messages into this opaque cloud: some of them detect switches or hosts while others simply disappear. By sampling the cloud with enough probe messages, the algorithm derives its topology. The next sections presents an algorithm to do this. This algorithm is trivially correct assuming packet routing but non-trivial for cut-through and circuit switched routing. Informally, consider this approach for network mapping with packet routing. Suppose a designated root host sends enough probe messages to generate a tree of all possible paths from it to all hosts directly attached to the network. Where two distinct paths to the same host exist, multiple tree nodes will correspond to the same actual node is the network. The challenge is to identify all such replicated nodes. Instead of actually generating a tree of all possible paths, the root host systematically explores the network in a breadth-first-like manner, increasing the distance (i.e., the number of turns in the route) of each probe message that it sends. When it explores frontier switches, it may discover two hosts attached to a switch. When two graph nodes representing switches are found to be connected to the same host, we know they represent the same physical switch because every host has a single network connection. The two graph nodes can be oriented with respect to each other and merged. Normalizing their orientations is necessary because probes may have entered the switch from different directions. When corresponding switch ports are aligned and the information from one of the graph nodes is merged into the other, further replicates can be created and detected. For example, merging can cause individual switch ports to become connected to multiple nodes. This configuration is impossible because an actual switch port has a single cable connecting it to one other switch port or host. Thus, multiple links incident to a switch port identify additional replicates. The exploration and merging continues until the algorithm has no switches remaining to explore and has no replicated nodes waiting to be merged. With packet routing, all paths from the root to all hosts are covered. Other forms of routing complicate the proof of the algorithm because probe messages might deadlock on themselves or prevent us from fully exploring all output ports of a switch because the probe message itself is occupying some of them. This “stepping on one’s tail” phenomena makes mapping non-packet-switched networks a challenging and interesting problem. The set of all probe paths generated by probing the network with packet routing is a superset of the sets generated with circuit or cut-through routing. For example, it might be impossible to establish circuits along some of the paths traversed using packet switching. Still, the algorithm can derive maps given such subsets of all possible probe paths.
2
Formal model of the system
the wires of N to be bi-directed. We assume that N is connected and has at least one switch and two hosts. Let D be its diameter.
2.2
Sending messages
The network uses cut-through routing through switches with relative and non-modularly computed port addressing. The routing address of a message is a string a1...ak from the alphabet {-7, ..., +7}. Call the host sending the message h0. Let (n1, p1) be the immediately adjacent switch port. Let p1’ = p1 + a1, where the addition is not performed modulo the switch degree (8). Assume for the moment that p1’ is in {0, ..., +7}, i.e., it is a legal port number. We have now computed one step of the message path from (h0, 0) to (n1, p1’), i.e., taken an a1-turn through the switch n1. In general, let (ni+1’, pi+1) be the neighbor of (ni, pi + ai) in N, when such a neighbor exists. That is, the subsequent characters of the message determine the next turn to take out of a switch relative to the port taken by the path on the way in. There is no means of addressing an absolute output port. The sequence h0, n1, n2, ... nk+1 is the message path. When all routing characters are exhausted, the message path terminates at the host nk+1that receives the message. A routing address fails to define a message path in the graph only in these four cases. •
ILLEGAL TURN: If pi’ is not in {0...7}, we have made a turn resulting in an illegal port.
•
NO SUCH WIRE: If ni has no wire at port pi + ai.
•
HIT A HOST TOO SOON: If a message arrives at a host and it still contains routing flits, i.e., ni is a host for some i ≤ k .
•
STRANDED IN NETWORK: If the message path does not end at a host, i.e., nk+1 is a switch.
Only one worm may use a given edge at a time. The hardware or firmware destroys messages that attempt illegal paths. If an output port is occupied, a worm waits for the port for a period of time set is switch ROMs (currently 55 ms) after which the switch forces a special “forward reset message” out the blocked output port. This message clears the path in front of it until finding the head of the blocking worm (the tail is destroyed by hardware). A worm on a message path which uses the same edge in the same direction will block at that edge if its tail has not yet passed that edge. The differences here can depend on several hardware factors, such as even modest amounts of buffering in switches.
2.3
Probing to discover network topology
A distinguished mapper host runs a mapper daemon. This program probes the network and from the responses builds a model tree M of the actual network N. We distinguish between the two graphs and their components using the terms, model and actual. There are two types of probes, a switch-probe and a host-probe:
This section presents a system model to facilitate the presentation of the mapping algorithm and its proof of correctness. The core model components are hosts, switches, ports, and wires. Then sourcebased, cut-though routing with relatively-addressed switches, and the types and behaviors of probe messages are defined.
•
SWITCH-PROBE: To test if a switch port is connected to another switch, the mapper sends a message with routing flits encoding turns a1...ak 0 -ak...-a1. If the mapper receives this “loopback message,” it knows an output port of a switch khops away is connected to another switch.
2.1
•
HOST-PROBE: To test if a switch port is connected to a host, the mapper sends a message with routing flits encoding the turns a1...ak. If the mapper receives a reply from this host to this message, it knows that this host is connected to an output port of a switch k-hops away. Hosts are uniquely identified.
System components
The network consists of two types of nodes: hosts, H, and switches, S (disjoint from H). The network N is a finite multi-graph on H ∪ S. We refer to the edges as wires. Each end of every wire is labeled with a port number, such that no two wire-ends incident on the same node share a port number. Denote uniquely a wire-end by its (node, port) pair, e.g., (n0, p0). A switch has eight allowable port-numbers: {0, ..., 7} and a host has one port, 0. In some contexts, we consider
Let a probe be a pair of the two above tests, using the above strings based on the same a1...ak ( a i ≠ 0 ). Depending on the results, we say the probe response is “switch”, a unique host-name, or the
To appear in the proceedings of the 9th Annual Symposium on Parallel Algorithms and Architectures (SPAA’97)
symbol “nothing.” If the probe finds a host the mapper obtains an unambiguous name for it, but if it finds a switch, the identity of the switch remains ambiguous.
cent switch-vertex. Initially, the frontier queue contains exactly this switch-vertex.
Probing computes a mapping from probe strings to responses, which we denote R: {-7, ..., -1, +1, ..., +7}* → H ∪ {“switch”, “nothing”}. Any non-null response to a probe is due to the fact that the probe path terminated in an actual node (switch or host) v. We say that the model vertex v corresponds to this actual node v. This is a well-defined correspondence function, from model vertices to actual nodes.
while( ( v ← frontier.nextElement ) ≠ null and ( v.probeString.length ≤ SearchDepth ) ) for i in {-7, ..., -1, 1, ..., 7} newProbeString ← v.probeString + i whatKind ← R(newProbeString) if ( whatKind ≠ nothing ) v.neighbors[i] ← new edgeAndVertex (newProbeString, whatKind, v) add new vertex to frontier endif endfor endwhile
2.3.1
Two models of probe failures
Note that even when the probe path exists in the network there may be no response, due to possible worm collisions or other errors, e.g., message corruption. Worm collisions are the major complication in the proof of correctness (Recall the assumption that the network is quiescent during mapping and thus worms can only deadlock on themselves.) Depending upon hardware considerations, the following two models may apply: (1) messages are circuit routed and therefore host-probes reusing edges in the same direction fail and switch-probes reusing an edge in either direction fail because they must return, or (2) messages are cut-through routed and therefore probes reusing an edge may or may not fail. Other errors such as message corruption are not addressed in the model.
3
The Mapping Algorithm
This section presents a simplified version of the mapping algorithm. In Section 3.2 we prove it correct. In Section 3.3 we apply a series of modifications and demonstrate the correctness after each change. The mapper host sends probes of increasing length into the actual network, exploring it in a BFS-like manner. The inability to identify switches means the exploration is not actually a BFS because probes revisit nodes from different directions. For each non-null response to a probe a1... ak, the algorithm builds a new model vertex v in the model graph M. The resulting tree M is a subtree of the natural tree on the probe string space. Because the model graph in general contains replicates of actual network nodes, the algorithm must detect them in order to produce an accurate copy of the network. For example, two model vertices are recognized as replicates if they purport to be connected to the same host. This is because each host is connected to a single switch by a single link (by system construction). In essence, this describes the first step of Lemma 3 below. Merging information from the two vertex objects may result in some switch ports claiming to be connected to multiple other switches or hosts. This identifies more replicates, and Section 3.2 and especially Section 3.2.6 show that this deductive process ultimately identifies all replicates. Identity information from separate regions of the model graph propagates and enables the identification of more replicates. As a proof technique, after deducing that two vertices are replicates our simplified algorithm labels them the same, as opposed to merging the objects themselves. Subsequent modifications in Section 3.3 change labeling into merging while preserving correctness.
3.1
Algorithm pseudo-code
After presenting the pseudo code, subsequent subsections cover details of the core data structures, operations upon them, and algorithmic parameters. INITIALIZATION The model graph M is initialized with two vertices: the root hostvertex, h0, corresponding to the actual mapper host, h0, and its adja-
EXPLORE
MERGE repeat boolean anyDeductions? ← false For all pairs of vertices v1, v2 such that v1.label = v2.label For each port number i in {-7, ..., 7} if (v1.neighbors[i].label ≠ v2.neighbors[i].label) mergeLabels(v1.neighbors[i], v2.neighbors[i], i) anyDeductions? ← true endif endfor endfor until( anyDeductions? = true ) PRUNE repeat boolean anyDeleted? ← false For each vertex v if ( ( v.kind = switch ) ∧ ( degree(v) = 1 ) ) v.delete anyDeleted? ← true endif endfor until( anyDeleted? = false )
3.1.1
Data structures
The pseudo-code object representing a vertex v in M has the following fields. Vertices have labels to indicate if they have been determined to be replicates. They also record adjacent neighbors. •
probeString - records the successful probe string a1... ak that lead to the creation of v.
•
kind - records the type of node, “switch” or “host”. The response "nothing" never creates a vertex in M.
•
label - when a host-vertex is created, its label is set to the host-name, which is the probe string response, R(a1...ak). When a switch-vertex is created, it gets a fresh label.
•
neighbors - an array of edge objects. We say v1.neighbors[i] connects to v2 if the edge object at v.neighbors[i] has v1 and v2 as its endpoints. Initially an edge’s index in this array is the turn that discovered it, which we call the relative port number.
edge is an object containing a reference to the vertex at each end of it, and the associated indices (relative port numbers) pointing back to it in these two adjacent vertices. The constructor new edgeAndVertex(newProbeString, kind, v) creates an edge object e connected to v in the obvious way and to a new vertex object
To appear in the proceedings of the 9th Annual Symposium on Parallel Algorithms and Architectures (SPAA’97)
created with fields probeString = newProbeString, kind = “switch” or “host” (given by whatKind), parent = v and label = kind (if kind is a host-name) or a fresh label (if kind = "switch").
bridge as a bridge separating a collection of switches not connect to any hosts on one side with a reasonable network on the other side.)
At all times, two vertices with the same label correspond to the same actual node in N, and the mergeLabels routine maintains this property. It is discussed in detail in Section 3.1.2.
3.2
frontier is a FIFO queue is used in the standard manner of a BFS search to hold created but unexplored vertices. SearchDepth limits probe string lengths (see Section 3.1.4. for a specific value).
3.1.2
The mergeLabels operation
We describe the mergeLabels procedure without giving pseudocode. This procedure merges the labels of two vertices, and re-indexes their neighbors arrays. We show below in Lemma 2 that this procedure will give only replicate vertices the same label, and changes the indices to have equal indexing offsets (defined below). mergeLabels takes as input two vertices v1 and v2 that are labeled the same, and an index i. Initially, v1 and v2, through relative port i, connect to u1 on port j and u2 on port k, respectively. For every w in M with the same label as u2, mergeLabels changes w’s label to that of u1. The indexing of w’s neighbors array is shifted by j-k. Finally, mergeLabels fixes the relative port numbers in all of the affected edge objects.
3.1.3
Indexing offset of the neighbors array
When two replicate vertices are encountered during merging (below), we would like to match up their neighbors. This is non-trivial because the indexing of the neighbors array of v is an artifact of the relative turns of the probe path to v. Suppose that in M, v is connected to some vertex u through port j. In the actual graph N, v is connected to u through some absolute port number i. In Lemma 2 we will see that i - j is invariant under choice of neighbor u even after some merging. Indexing offsets are simply a tool for the proof. Thus Definition 1: The indexing offset of v is i - j.
3.1.4
Bounding the exploration depth
The algorithm has a bounded search depth. We use Q+D+1, where Q is defined below and D is the network diameter. A bridge in a graph is an edge the removal of which increases the number of connected components. A switch-bridge is a bridge with switches at both ends. Definition 2: For a node v in N let Q(v) be the length of the shortest path from h0 (the mapper) to v and then on to any host that does not repeat an edge in either direction, except that the first and last may be the same. (The path may cross a bridge, but not a switch-bridge.) Note that Q(v) may not exist for some v. Let F = {v such that Q(v) is not defined}. Call N - F the core of the graph. Definition 3: Let Q = max 〈Q(v) | v ∈ N – F〉 . The next lemma shows that v in F are not too useful for routing. Lemma 1: F = the set of all nodes that are separated by a switchbridge from H. Proof. This is a consequence of the Max-Flow, Min-Cut theorem, theorems 27.7 and 27.11 in [6]. Let v be a source of flow 2, and attach a sink to all hosts (we assumed there are at least two). Give all edges capacity 1.■ Notice that if a switch in F is used on a routing path, that path has a loop at the switch-bridge, and the loop can be pruned. Such paths with loops have questionable utility. (One can think of this switch-
Proof of correctness
The following is a sketch of the proof. First we show that each node in N - F is represented at least once in M. It suffices to show that all replicates are merged, guaranteeing that each node is represented at most once. Replicates will be merged if they have “parallel” paths (corresponding to the same actual path in N) to replicate host-vertices. With packet routing, these parallel paths always exist and we will see that this finishes the proof. With circuit routing however, the parallel paths are not guaranteed to exist, and this is the major complication of the proof. Specifically consider a path p from v in M to a host-vertex h. Let v’ be a replicate of v. If we can start at v’ and go along the path “parallel” to p, sort of “pasting” p on to v’, we should arrive at h’ (a replicate of h). We cannot assume that this succeeds because the implied probe path may “step on its tail.” The existence of this collision however guarantees the existence of other side-paths to h in M. because we have found more copies of h, we have more information to work with. It will take an inductive examination of these side-paths to see that these replicates are discovered. The case of cut-through routing is similar. Some probes may succeed where previously they failed due to self-deadlock. This gives us a possibly larger M than above. Assuming additionally that F is empty, we ensure that these extra replicates are found.
3.2.1
Conventions and definitions
We formalize notions of “correspondence”, “parallel” and “replicate”. We will continue to use the adjective "actual" to refer to N and its components, which we call nodes and wires. We use the adjective "model" to refer to M and its components, which we call vertices and edges. A letter such as v or e or p will denote a vertex or edge or path in M. Primed versions (e.g., v’) of the same letter will always denote replicate or parallel vertices or edges or paths respectively. (See below.) Overline versions (e.g. v) of the same letter will always indicate corresponding actual elements in N. Definition 4: Define the correspondence map C:VM →VN by C(v) = v iff v in VN is the actual network node that caused v in VM to be created. Similarly, define C:EM → EN by C(e) = e if e was created in response to a probe that crossed e. Definition 5: If C(v) = C(v’) for v, v’ in VM, we say v and v’ are replicates. Definition 6: If C(e) = C(e’) for e, e’ in EM, we say e and e’ are parallel. Two paths e1... ek and e1’... ek’ in M are parallel iff ei is parallel to ei’ for each i. Clearly if two paths in M are parallel, the points along the paths are respectively replicates and the path lengths are the same.
3.2.2
Main theorem
We begin with a short argument for the case of packet routing. Recall that M is the model graph constructed by the algorithm. Because we merge labels instead of merging nodes, M is actually a tree. Let L be the label equivalence relation on vertices (given by v1.label = v2.label). Let M / L (M mod L) be the graph that one obtains by identifying the nodes of M that have the same label. Let us begin by demonstrating that the algorithm, slightly modified, is correct for packet routing. That is, M / L is isomorphic to
To appear in the proceedings of the 9th Annual Symposium on Parallel Algorithms and Architectures (SPAA’97)
N. In packet routing messages can reuse edges arbitrarily. Assume search depth 2D+1, That permits probe paths long enough to reach any switch and then continue on to a host. Consider all replicates corresponding to v in N. Each has a path to a host or edge. The shortest such path has a parallel copy at each replicate. To finish, using Lemma 3 below, note that the labeler detects these paths. Theorem 1: In the first collision model (circuit routing) M / L is isomorphic to N - F. In the second collision model (cut-through) when F is empty, M / L is isomorphic to N. The following argument proves the first sentence in detail. At the end we extend the argument to the second sentence. The breadth-first exploration stage goes to a depth ≥ D + 1 . There is at least one simple path from the mapper host to any node of depth at most D. Thus each node and wire in N is represented at least once in M.
Proof by induction on k. The base case for k = 0 is trivial. Let x0 be the indexing offset for v0, and let x1 be the indexing offset for v1. Now consider the first edge in the path p. It takes the (vertex, port) (v0, j0) to some (v1, j1). By construction of the paths above, v1 corresponds to the actual node v1 in N and the edge ((v, j0), (v1 , j1)) corresponds to the actual wire ((v0, j0+x0), (v1, j1+x0)) in p. Similarly for v0’ and the first edge of p’. Now, v1 and v1’ both have parallel paths of length k-1 to vk and vk’ respectively. (Just remove the first edges of p and p’). By the induction hypothesis, v1.label = v1’.label at the end of round t + k - 1 of the procedure. The next round will notice that v1 and v1’ both connect through port j1 to the two nodes v0 and v0’ respectively and will label them the same.■
3.2.5
Copying and pasting parallel paths
All that remains to be shown is that when the labeler and pruner have stopped, two nodes are labeled the same iff they correspond to the same actual vertex. This takes until the end of Section 3.2.
We now begin to show all replicates get labeled the same. We do this by extending our diagram of M, which represents the parts of M that we know must exist.
3.2.3
Consider some v in N - F. Since we explored to depth at least Q, for at least one of the replicates, v, there is a switch-bridge-simple path through v to a host, h: .
The labeler is correct
We show that the Merge section (including the mergeLabels subroutine) always makes correct labeling deductions and re-indexings. This lemma shows only that the algorithm “merges” replicates but not that it “merges” all replicates. Lemma 2. If u1.label = u2.label then C(u1) = C(u2) and u1 and u2 have the same indexing offset. Proof by induction on the number of calls to mergeLabels. For the basis case, the mapper gives all vertices different labels initially, unless they are hosts. Hosts have unique id’s, and host-vertices will be labeled the same iff they correspond to the same host. A host has only one port, so all replicates of a host-vertex in M have its one switch-vertex neighbor attached at neighbors[0]. There is no index re-normalization issue. Consider the deduction that the mapper makes to conclude that two switch-vertices u1 and u2 get the same label. By the induction hypothesis, the two vertices v1 and v2 with the same label before the deduction correspond to the same vertex and have the same indexing offset. The vertices v1 and v2 are labeled the same. Initially, v1 and v2, through relative port i, connect to u1 on port j and u2 on port k, respectively. Because any port has at most one wire, v1.neighbors[i] and v2.neighbors[i] must be connected to vertices that are replicates. Shifting the indices of u2 so that u2.neighbors[j] (rather than u2.neighbors[k]) now connects to v2. This causes u1 and u2 to have the same indexing offset. Recall that all nodes with the label u2.label and all relevant edge object vertex references are re-indexed for consistency.■
3.2.4
Using parallel paths
We show that vertices that have parallel paths to the same host eventually are labeled the same. Recall that vertices on parallel paths are replicates. This lemma shows that the labeler can deduce this. Below, by a round of the labeler, we mean one completion of the outer repeat loop. Lemma 3. Suppose there are parallel paths p and p’ of length k from vertices v0 and v0’ to vertices vk and vk’. If vk and vk’ have the same label at round t of the labeling algorithm then v0 and v0’ have the same label at round t + k. In particular, notice that if C(vk) is a host, we may let t = 0.
Consider any other replicate, v’, within distance D+1 from h0. (We examine those further away at the end of the proof.) Consider the probe path to v that resulted in v’ being created. One way that the mapper can (attempt) to extend this probe path is to (attempt) to probe further down the actual path < v, h>. If such an extension succeeds, in our diagram of M, there are additional edges, which we now know exist. We call this “copying” the path from v to h and “pasting” it at v’. It must be emphasized that we are not extending M, which is built by the algorithm - we are extending our diagram of M, which represents the parts of M which we know must exist. If the paste succeeds, there are parallel paths from v to h and from v’ to some new h’, and by Lemma 3 the labeler will eventually label v and v’ the same. This paste may not succeed, however, and a more complicated construction is necessary.
3.2.6
An inductive construction
The fact that v and v’ are replicates gives us structural information about N and thus M. Using multiple pastes we now construct additional sections of our diagram of M. This will allow us to show the existence of replicate vertices/edges on the paths from the mapper to v and v’ respectively. Consider the actual path in N corresponding to path . Call this the green path. Similarly, call the actual path in N corresponding to path the purple path and the actual path in N corresponding to path the red path. Any model edge in M which is parallel to a colored actual edge has the same color. Edges may have more than one color. Recall that the length of (purple ∪ red) = Q(v) ≤ Q. We say we traverse the purple and red paths upward from h0 to v to h, and upward along the green path from h0 to v’. Since probe paths only block when they attempt to reuse an edge, by the intersection of two paths, we will mean edge intersection. Definition 7: Let a purple-green chunk be a maximal sequence of purple and green edges that are contiguous on both the purple and green paths. Define a red-green chunk similarly. Note that purple-green chunks may abut at a node on, say, the purple path, while remaining distinct chunks. Notice that red and pur-
To appear in the proceedings of the 9th Annual Symposium on Parallel Algorithms and Architectures (SPAA’97)
ple never intersect, unless h = h0. (In this case the first edge of purple equals the last edge of red. See the anomaly in the definition of Q.) h
The length of the path from h0 to v to h is Q(v) ≤ Q. Thus, as noted in the section above, the red and purple together have length at most Q. The green has length at most D+1. Our exploration depth is at least the sum of these two. By Lemma 3 the labeler will label g and g’ the same, and v” and v’, the same.
(1)
h d
(2) h’
v
v’
v’’
h’’
g’
d
g
h’
d’ v
purple green red
v’’
h’’
d’’
g0
g’ g
h0
d’
Figure 1 First step of the inductive construction. The figure shows: (1) the copying of and its pasting at d’ that creates (2) the copying of and its pasting at g and the copying and pasting this also at g
v’
d’’
purple green red
g0 h0
In M now, let g0 be the first purple-green chunk found going upward on purple from h0. It starts right at h0, since the first purple edge and green edge are parallel.
Figure 2 The new green path. The induction step proceeds by using this new green path in place of the old.
Let g be the next purple-green chunk found going upward on (purple) from g0. Let g’ be the parallel copy of g on the green path. Let d be the highest red-green chunk on the red path. (The first one found coming down from h. In the case that h = h0, we do not count as an intersection the last edge of red = first edge of purple, since this is not a collision according to our routing model.) Let d’ be the parallel copy of d on the green path.
Let the new green path (in M) be . (It is just the green path with purple replacing green .) If we replace the green path with the new green path (see Figure 2), we can repeat the above construction. At each stage the intersection of purple and green is growing. The induction terminates when they are equal. All v”s constructed are labeled the same as v’. The last v” is v. Thus, eventually, v and v’ are labeled the same.
(1) Copy the red path section and paste it on at d’ (creating h’ thereby).
3.2.7
(2) Copy the green path section and paste it on at g1 (creating d" thereby). Copy the red path section and paste it on at d" (creating h" thereby). Finally, copy and paste it on at g, (creating v” thereby). This may fit partially on top of the previous green pasting.
If at this point we mod out by the labeling relation (M / L), the resulting graph will contain an isomorphic copy of the core.
Notice that going up the purple path on g may correspond to going up or down the green path on g’. These pastings are made to fit in the obvious way. Thus, traversing the newly constructed may or may not cross a parallel copy of g or d. (3) Examination of the current diagram now reveals that g and g’ both have parallel paths to replicates of a host-vertex, h" and h’ respectively. Similarly, v” and v’ also have parallel paths to h” and h’. We must show that all of the pasting constructions mentioned above actually exist in M. For each construction, when the green section and red sections are pasted on, we need to know that the relevant sections of purple and green are edge-disjoint, and the relevant sections of red and green are edge-disjoint. This follows directly from the definitions of g and d.
Implications of the construction
Now we will consider the case where v’ is further than D+1 from the mapper. We have not yet proved that v’ has been labeled correctly. However, since v’ has not been pruned in the model tree M some descendent h1 of v’ is a host. Thus, the path between these is parallel to a path in the core (N - F). The labeler will find this and eventually label v and v’ the same. Now consider the second sentence of the theorem. Paths (sometimes) succeeding where they previously failed produces an M that is a “super-tree” of the one considered above. We must only ensure that if extra replicates, v’, are produced, they are also merged back into the core. The demonstration of this is similar to the above paragraph. It should be noted that this demonstration uses the emptiness of F. (Above F was eliminated by the pruning stage. Now we must assume it is empty, since it is not guaranteed to be eliminated.) ■ We may reduce Q+D+1 to Q+D by noticing that the red and green paths must overlap on the first edge. We do not know if a better construction would give us a better upper bound on the necessary exploration depth of this algorithm.
To appear in the proceedings of the 9th Annual Symposium on Parallel Algorithms and Architectures (SPAA’97)
3.3 Towards the actual algorithm Now we modify the algorithm to converge to the actual one, noticing that with each modification it remains correct. 1. Move the entire labeling section of code into the while loop of the exploration section, at the bottom of the loop. Notice that the condition needed to be able to apply the inner relabeling deduction rule is a local condition: that the two vertices have the same label. Once this local condition holds for two vertices, more steps of the exploration or labeling process never invalidate it. Thus extra labeling deductions are always valid. 2. We say the labeling process has stabilized when no more labeling deductions can be made from the current information. Once the labeling process has stabilized, and a round produces no more label merging, the addition of a new vertex with a fresh label produces no additional label-merging at all. Thus, after the addition of a new switch, we can omit the labeling process, as new switches have fresh labels. Further, in the labeling process, we need not consider pairs of vertices as candidates for label-merging when neither have changed their labels since the last time the labeling process stabilized. Thus we now only consider pairs where at least one element is a newly added host-vertex or a switch-vertex that had its label changed since the last stabilization of the labeling process. We now stop using the concept of labels. Now, instead of merging their labels, we merge two vertices into one vertex object. The merge takes the union of the neighbors array information. So v.neighbors[i] may no longer be a single edge, but a list of edges connecting to many vertices. All of these should be merged into one vertex. This is what remains of the what was previously the labeling deduction. We may thus make a more efficient merging process using a mergelist of vertices. When the labeling process has stabilized, the mergelist is empty. When a new host-vertex is created, it is put on mergelist, and the algorithm does the following: while ((v = mergelist.nextElement) ≠ null) try all deductions using v put those who get merged onto mergelist Remove v from mergelist 3. We reduce the total message count with some local optimization tricks. These are carefully done to eliminate probes only when we are sure they will fail. O(D+Q)
For our system the complexity is 2 . However, if the diameter is O(logN) where N is the number of nodes in the model graph and if Q = O(D), it runs in polynomial time or less. Picking the order of port exploration is important. Suppose we’re exploring a switch and we enter at a port effectively chosen uniformly at random. Consider which relative turns have the greatest probability of finding something: excluding turn 0, turns of +/- 1 are the best, turns of +/- 2 are the next best, etc. Turns +/-7 only work small amount of the time. Also note that probes that fail to generate a response tell us nothing about the range of turns that we should be focusing on, but probes that generate responses do. Once we find two turns separated by a distance of 7 that are successful, we are done. Furthermore, if we assume densely-populated switches, as we explore turns -1, -2, ..., and fail to get a response, we should start probing outwards in the other direction (or visa versa).
4
Myricom’s Mapper
The Myricom network mapping software implements a different mapping algorithm. It differs from our algorithm in several ways. To
avoid confusion, Myricom’s mapping algorithm is called the Myricom Algorithm and our algorithm is called the Berkeley Algorithm. A description of the Myricom Algorithm, makes its similarities and differences from the Berkeley Algorithm clear.
4.1
The Myricom Algorithm
The Myricom Algorithm performs a breadth-first exploration of the network. It has the equivalent of a frontier queue of switches pending exploration. While switches remain on their frontier queue, it pops off each one and explores it. To explore the switch, the algorithm sends probe messages to check for the presence of loopback cables and to check for links to hosts and switches. The Myricom Algorithm uses relative switch port addressing and a generalization of loopback probe messages to test if the current switch (the one just popped off the frontier queue) has been explored. Recall that mappers send loopback probes with turns of the form T1 ...Tn 0 -Tn ...-T1 to test for switch-to-switch connectivity. Now consider two turn sequences: T1 ...Tn to some input port on the switch A being explored and S1...Sn to an explored switch B. To test if A is B, the Myricom Algorithm sends probes of the form T1...Tn X -Sm...-S1 where X spans any single turn. For 8-port switches, the turns used in these comparison probes are {-7, ..., -1, +1, ..., +7}. Therefore, switch A is switch B if there exists a route to A, concatenated with a turn X, concatenated with the return route from switch B. The Myricom Algorithm employs a variety of heuristics to reduce the total number of probes sent. When two switches are recognized to be replicates, they are merged in the same manner as in the Berkeley Algorithm, except that merging two switches never produces new ones to merge.
4.2
Comparison and analysis
The Myricom Algorithm aggressively looks for replicates as it explores that network, whereas the Berkeley Algorithm discovers replicates in a lazy fashion. The former sends a sequence of comparison probes to test if a potentially new switch from the frontier queue has already been explored. The latter builds a model graph, and checks for structural inconsistencies, from which it deduces that switches are replicates. This deductive replicate recognition process propagates “backwards” from the leaves towards the mapper host. The Myricom Algorithm proceeds “forwards” from the mapper host, actively finding replicates on the fly. The algorithms trade-off sending messages and memory usage. There are two secondary issues. First, the Myricom Algorithm is implemented in the network interface firmware whereas the Berkeley Algorithm is implemented at user-level. The Berkeley Algorithm is written using essentially the same active message primitives available to standard client/server and parallel programs. Although more tightly connected to the network, the Myricom Algorithm runs on a 37.5-Mhz embedded message processor. The Berkeley Algorithm runs on a 167-Mhz UltraSPARC workstation but it interacts with the network interface via the SBUS. Myricom’s mapper is implemented as a background task in the interface firmware and runs at a lower priority than the normal routing and message handling software. The mapping and routing functions and the normal message handling software all exist in the limited 128KB or 256KB memory of the interface. The Myricom Algorithm views the network bandwidth and latency as the only unconstrained resource in the system and aggressively uses messages to solve the map discovery problem. Secondly, both algorithms have two operational modes, one where a master maps the network while all others interfaces respond to incoming probe messages, and another where all interfaces or hosts actively map the network and in the process the
To appear in the proceedings of the 9th Annual Symposium on Parallel Algorithms and Architectures (SPAA’97)
participants elect a leader by comparing network interface addresses carried in every message. The master/slave mode is faster but introduces a single point of failure, whereas the election mode is more robust, e.g., to network partitions and re-connections, but has a performance cost.
Node84
Node83
Node80
The message complexity of the Myricom Algorithm is O(N2), where N is the number of nodes in the network. The constant factor is large, because for each switch the algorithm sends up to 14 messages to test for self-loops, up to 14 messages to test if switch ports are connected to other ports, 14 additional messages to test if switch ports are connected to hosts, and some O(N2) number of additional messages to comparing switches to previously mapped switches.
Node81
Node74
Node73
Node70
Node71
Node72
Switch 17 0 1 2 3 4 5 ID 17
1 2 3 4 5 6 7
Node89
Node88
Node85
Node87
Switch 124 0 1 2 ID 124
6 7
3 4 5
Switch 74 0 1 ID 74
Node86
Node64
Node61
Node60
Switch 24 0 1 2 3 ID 24
6 7
2 3 4
Switch 75 0 ID 75
5 6 7
Node63
Node79
Switch 102 0 1 2 ID 102
4 5 6 7
Switch 76 0 1 2 3 4 5 6 ID 76
1 2 3 4 5 6 7
Switch 0 0 1 ID 0
Node62
2 3 4 5 6
3 4
Node75
Node77
Node76
Node114
Node113
Switch 28 0 1 2 ID 28
5 6 7
Switch 4 0 1 2 3 4 ID 4
7
Switch 15 0 1 2 3 4 ID 15
7
Node78
3 4 5
Node112
Node111
Node110
Node69
Node68
Node65
Node67
Node66
Switch 23 0 1 2 3 4 5 6 7 ID 23
6 7
5 6 7
5 6 7
Empirical study and discussion
The intent of this section is to provide more insights into the behavior of our algorithm in practice. It summarizes the hardware components in the system, shows two automatically-generated network maps, presents timings and message counts for the Berkeley Algorithm, and makes a brief comparison with Myricom’s Algorithm.
5.1
Components and network maps
Node250
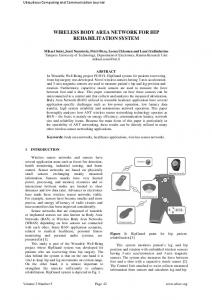
Figure 4 Network topology of the C subcluster. This 35-node cluster is typical of the three subclusters of the system. The single host at the bottom is a machine dedicated to running system services (e.g., nameservers or the active mapper process). Node49
Subcluster
# interfaces
# switches
# links
A
34
13
64
B
30
14
65
C
36
13
64
Node48
Node45
Switch 124 ID 124
0
Node47
1
2
3
4
5
Node46
6
7
Node34
Node33
Node30
Switch 48 ID 48
0
Node32
1
2
3
4
5
Node31
6
7
Figure 3 A, B, and C subcluster components. Rows account for network interfaces, switches, and links in each configuration. Each host has one network interface.
Node54
Node53
Node50
Switch 45 ID 45
Switch 6 ID 6
0
0
1
1
2
Node52
2
3
3
4
4
5
5
6
6
7
Node51
Node44
Node43
Switch 207 ID 207
7
Switch 8 ID 8
0
1
2
3
4
5
6
7
Node40
0
1
2
3
Switch 20 ID 20
4
0
Node42
5
1
6
2
Node41
Node39
Switch 116 ID 116
7
3
4
Switch 505 ID 505
5
6
0
Switch 9 ID 9
7
1
2
3
4
5
0
6
1
7
Node38
0
2
3
1
4
2
5
Switch 504 ID 504
3
Node35
4
6
0
5
6
Node37
Node36
Node92
Switch 115 ID 115
7
0
1
Node91
2
3
4
5
6
Node55
Node57
7
Zooming out allows us to see the entire 100 node cluster as of this writing. Additional switches can be added to increase the number of roots, thereby increasing the number of simultaneously usable routes between subclusters as well as the bisection bandwidth.
Node19
Node18
Node15
Switch 101 ID 101
0
Node17
1
2
3
4
5
Node16
6
7
Node9
Node8
Node5
Switch 76 ID 76
0
1
Node7
2
3
4
5
Node6
6
Node29
1
2
3
4
5
6
Node28
7
Switch 10 ID 10
7
0
Node25
Switch 79 ID 79
0
1
2
3
1
4
5
6
7
2
3
Node27
4
5
0
1
Node26
Node14
Switch 107 ID 107
7
0
1
2
3
4
5
6
7
Switch 502 ID 502
0
1
2
3
4
5
6
5
6
7
2
3
Node13
4
Switch 441 ID 441
Switch 13 ID 13
0
Switch 133 ID 133
7
0
1
2
3
4
Node10
Node12
0
1
2
3
4
5
6
1
2
3
4
5
6
7
0
1
2
5
6
7
3
4
5
6
Node11
Node24
Switch 73 ID 73
7
Switch 14 ID 14
0
1
2
3
4
5
6
0
1
Node23
2
3
4
5
6
Node20
7
Node22
Node21
Switch 74 ID 74
Node104
0
1
2
3
Node101
4
5
6
Node102
7
7
7
Node2
Switch 343 ID 343
6
Switch 12 ID 12
7
Figure 3 shows the constituent components for each of the A, B, and C subclusters that comprise the Berkeley NOW system. Each subcluster has approximately the same number of interfaces (i.e., hosts), switches, and links. Figure 4 shows the results of mapping one of the NOW’s three subclusters. The figure shows 35 hosts along the top row, three levels of switches for a total of 13, and a distinguished utility machine attached directly to a root. This machine runs the active mapper process in the master/slave mode of operation. Note that the network is an incomplete fat-tree and that it exhibits several irregularities. The middle switch in the first level only has two links, instead of three, to other switches. The third was faulty and removed, but never replaced. In addition, there are unused switch ports on all level 2 and 3 switches, leaving room for additional switches, additional switchto-switch connections, or hosts.
Node56
Node103
Node4
Switch 75 ID 75
Node3
0
1
2
3
4
Node0
5
6
7
Node2
Node1
Node84
Node83
Node80
Switch 150 ID 150
0
Node82
1
2
3
4
5
Node81
6
7
Node74
Node73
Node70
Switch 148 ID 148
0
Node71
1
2
3
4
Node72
5
6
Node89
Node88
Switch 536 ID 536
7
Switch 438 ID 438
0
1
2
3
4
5
6
7
Switch 503 ID 503
0
1
2
3
4
5
6
7
Switch 439 ID 439
0
0
1
2
3
4
5
6
7
Switch 146 ID 146
0
1
2
3
4
5
6
Node85
1
2
3
4
Switch 440 ID 440
Node87
5
6
0
Node86
Node61
Switch 155 ID 155
7
1
Node64
2
3
4
5
6
7
Switch 28 ID 28
0
1
Node60
0
1
2
3
4
5
2
3
4
5
6
7
6
7
Node62
Node63
Node79
Switch 510 ID 510
0
1
Node78
2
3
4
5
6
Node75
7
Node77
Node76
Node114
Switch 159 ID 159
0
1
Node113
2
3
4
5
6
Node112
7
Node111
Node110
Node69
Switch 154 ID 154
0
1
Node68
2
3
4
5
6
Node65
Node67
Node66
7
7
50
5
Switch 19 0 ID 19
Node82
Figure 5 The 100-node NOW cluster network map. As shown in the previous figure, irregularities persist. This is unsurprising as system construction was incremental over a period of months.
5.2
Performance characterizations
As the subclusters are connected and mapped, Figure 6 shows the total number of host and switch probes that are sent. Recall that these probes are sent when a switch is popped off the frontier and explored. Because probes that do not generate responses time-out, one measure of our algorithm performance is the ratio of probes that generate responses to the total number of probes sent. The hit ratios for host probes and switch probes are shown. Probes that do not generate responses are more expensive than others because the message time-out period is longer than the time of an average round-trip. For example, the first row shows that the algorithm maps the C subcluster with 450 total messages of which 264 produced responses but 186 produced none. The message counts are algorithmic properties, but the times in the next figure are implementation-specific. System
host
hits
ratio
switch
hits
ratio
C
200
107
53%
250
157
62%
C+A
412
216
52%
491
295
60%
C+A+B
804
324
40%
1207
727
60%
Figure 6 Host and switch probe message hit ratios. Each row shows the number of host and switch probes, the percentage that end at a host or switch, respectively. To appear in the proceedings of the 9th Annual Symposium on Parallel Algorithms and Architectures (SPAA’97)
System
time(ms), one master min / avg / max
time(ms), election min / avg / max
C
248 / 256 / 265
277 / 278 / 282
C+A
499 / 522 / 555
569 / 577 / 587
C+A+B
981 / 1011 / 1208
1065 / 1298 / 3332
800
Number of elements
Figure 7 shows the minimum, average, and maximum times to map three system configurations for the two operational modes of the mapping system. The second column reports times when a single master actively maps the network and all other hosts run mappers in a passive, echoing mode. The third column shows the times when all hosts run an active mapper and dynamically elect a leader as probes are sent and received using the host identifiers.
#edges
700 600
#nodes
500 400 300 200
#frontier nodes
100 0 0
Figure 7 Mapping times for three systems and two operational modes. Note the small variations in mapping times for C and C+A regardless of the mode of operation, and the increased variation for C+A+B, particularly with the election.
50
100
150
200
250
Time in units of “switch explorations” Figure 8 Number of nodes in the model graph, edges in the model graph, and items on the frontier list. The top line is the number of edges. The middle is the number of nodes in the model graph, and the bottom is the number of items on the frontier list.
During one run of the mapping algorithm on the C+A+B system, the number of nodes and edges in the model graph as well as the number of items on the frontier list were recorded after a frontier switch was explored. Hence time is in units of “switch explorations” and not “message probes”. Figure 9 shows the results of processing this log. At exploration number 150, nearly all of the hosts and switches in the system have been found. However, the algorithm continues to explore until the final prune is done. The final prune accounts for the plummet in values near exploration step 250. When done, the number of items on the frontier list (the bottom line) is zero and the number of switches, hosts and edges assume their final values (as can be derived from Figure 3). At the maximum, the algorithm’s model graph has ~750 model graph nodes that eventually are merged and pruned into the 140 actual nodes. The performance characterizations thus far have scaled the number of interfaces, switches, and links. Figure 9 shows the factor of 8 speedup in mapping time from 1 host actively mapping the network as additional hosts (running passive mappers) are added to the system. Along the top line additional mappers were run in order of increasing node number. The step-wise discontinuities occur as the first mapper is run on subcluster. As more hosts are added within a subcluster, the algorithm runs faster. On the bottom line, additional mappers were run on randomly chosen nodes until all nodes were filled. After 15 randomly-placed mappers are running, the execution time is within a factor of 2 of its minimum, and after 20 the time is within a factor of 1.5 of its minimum
5.4
Comparison to the Myrinet Algorithm
With the preceding performance analysis of the Berkeley Algorithm, it is interesting to compare it to that Myricom Algorithm on the identical hardware and system configurations. The point of interest is in the number of messages sent (an algorithmic property). (We suspect that the total number of messages can be reduced by factors of 2 or more based upon our experience with cleverly choosing the sequence that switch ports are probed.) Because this is a fundamentally different algorithm, the categories of probe messages are different from the Berkeley Algorithm’s. When examining the performance summary in Figure 7, please consider that the Myricom algorithm has had little opportunity to run on systems with more than 13 switches or more than 40 processors. In fact, these are the first runs and measurements of their algorithm on much larger systems.
Map time (seconds)
5.3 Additional characterizations 11 10 9 8 7 6 5 4 3 2 1 0
first mapper added to A first mapper added to B
first mapper added to C
0
10
20
30
40
50
60
70
80
90 100
Number of hosts running a mapper Figure 9 Time to map a 40-switch network as the number of hosts increases from 1 to 100. The top line show performance as additional hosts are added one at a time, filling out each subcluster completely before moving onto the next one. The bottom line shows performance as additional hosts are added incrementally but on randomly chosen hosts. The Myricom Algorithm sends 3.2, 3.6, and 5.4 times the number of probe messages to map the C, C+A, and C+A+B configurations, respectively, as compared to the Berkeley Algorithm. The Myricom Algorithm takes approximately 5.5, 3.9, and 3.9 times longer to map the C, C+A, and C+A+B configurations, respectively. Note that the times to map the networks reflects both algorithmic and implementation differences, e.g., execution on the host versus in the network interface message processor. System
loop
host
sw.
comp
total
time (ms)
C
134
713
152
450
1449
1414
C+A
283
1484
329
1234
3330
2197
C+A+B
424
2293
611
5089
8413
4009
Figure 10 Myricom Algorithm performance summary. The columns account for the following types of probe messages: loop for loopback cables, host for hosts attached to switch ports, sw(itch) for switches attached to switch ports, and comp(are) for disambiguating new switches from old ones.
5.5
Deadlock-free route computation
To appear in the proceedings of the 9th Annual Symposium on Parallel Algorithms and Architectures (SPAA’97)
Once the master or elected leader generates a network map, it derives mutually deadlock-free routes from it and distributes them throughout the system. We use UP*/DOWN* [5] routing to impose an edge ordering such that all valid routes are paths that follow zero or more edges in the up direction, followed by zero or more edges in the down direction. A valid route never turns from a down edge onto an up edge. To compute the edge orderings, the algorithm picks a switch as far away from all hosts as possible to use as the root of a breadth-first labeling of the network map. Up edges point towards the chosen root (i.e., the bfs label of the head node is greater than the bfs label of the tail node) and down edges point away from the chosen root. We use the Floyd-Warshall [6] all-pairs shortest-paths algorithm to compute compliant paths between all hosts. Where multiple edges are available between two switches, the algorithm has the option of randomly choosing among them for load balance. The goodness of UP*/DOWN* routes is known to be highly topology-dependant [5]. Two common effects are increased congestion about the root and the creation of locally dominant switches in hypercubic networks. The BFS numbering of these switches is such that all edges lead away from them. Consequently, no route will ever use them because doing so would introduce a turn from a down edge onto an up edge. These switches can be located and made useful for routing by relabelling them with the minimum of their neighbors’ BFS labels minus one. Additionally, in our system, we ignore the specially-designated utility host when picking a switch distant from all hosts. This picks a natural root of the network and allows packets to flow up to the least common ancestor of a source and destination along deadlock-free routes. Of course, a strategically placed cable or two can re-root the UP*/DOWN* tree. UP*/DOWN* is an instance of the turn-model of Glass and Ni [7]. The fundamental idea is to prevent deadlock by analyzing and forbidding sequences of turns. Specifically, UP*/DOWN* routes messages along edges in one dimension, allows a single turn, and then routes messages along edges in the second dimension. Turns from the second to the first are not allowed. Dally and Seitz [8] present the virtual channel model in which switches contain buffering to allow multiple virtual channels to be multiplex onto physical links while maintaining independence amongst the channels. They show deadlock-free routing on k-ary n-cubes, cube-connected cycles, and shuffle-exchange networks and generalize to arbitrary networks, but, not to arbitrary and reconfigurable ones. Ni and McKinley survey wormhole routing techniques for direct networks, and give some attention to arbitrary ones. They mention the approach of prioritizing messages and routing messages with higher priorities around messages with low priorities in the context of virtual channels. Messages traverse channels in an ordered way so as to avoid deadlock. This requires buffering that cannot be bounded, as Owicki and Karlin note, a priori with arbitrary and reconfigurable networks.
5.6
Related systems
Collectively, the differences between mapping local and wide-area networks as discussed below result in the mapping problem for system area networks assuming a new form that requires a qualitatively different solution. ATOMIC [20] network had a mosaic processor at each intersection in the network. 64-node Mosaic mesh of processors and routers comprised a single 8-port crossbar switch. The paper provides examples of mapping irregular networks with non-symmetric links. The key was to use the processors at each cross point to forward a mapping probe message while tagging the message with the output port. Eventually a message will arrive back at the mapper and it can start to deduce the structure of the network. The mapper went back to pick up probe messages that arrived at a node and that were held rather than being forwarded in a broadcast fashion. Implementing a
similar algorithm in the Myrinet network means sending well-defined messages with a set of routing bytes on the front, then waiting for responses and going and picking up extra messages at nodes that are discovered. There are classic papers on automatic network management with the Digitial Autonet/AN1 network [10], [11], [5]. According to Rodeheffer and Schroeder, “Our goal was to make Autonet look to host communications software like a fast, high-capacity Ethernet segment that never failed permanently.” Additionally, they note the principle differences between the ARPANET [13] and AN1 are wide-area and moderate-speed versus local-area and high-speed. Today, this distinction is unclear. If system area networks establish a regime between local area networks and traditional massively parallel processor (MPP) networks, then AN1 more closely resembles a local/wide-area network than an MPP network. AN1 switch latencies of 2 milliseconds are order of magnitude larger than delays through network switches, such as Myrinet. While mapping, the network did not route application traffic. Owicki and Karlin [5] also presents simulation results on the performance of UP*/DOWN* routing and show its sensitivity to topology and other artifacts. ARPANET could tolerate transient forwarding loops but Autonet could not and thus could not be “tolerated.” Consequently, “Autonet cannot carry host traffic while reconfiguration is in progress.” This could cause deadlock, should inconsistent forwarding tables arise. Thus, direct application access to network was not supported, though many studies [16, 17, 18, 19] now show that such direct bindings of physical communication resources to virtual ones is necessary for obtaining high-performance as networks move into the gigabyte per second range. Processors in each switch periodically execute a distributed topology acquisition algorithm. This updates forwarding tables in every switch used for message routing. Thus, AN1 switches effectively formed a parallel computer, where the “hosts” were embedded in the switches. Pairs of switches could monitor and agree upon the status of links connecting them. This direct monitoring ability is unavailable in Myrinet-like networks, where link states must be derived indirectly from hosts.
6
Future work
This paper has introduced a networking regime that raises interesting algorithmic and architectural issues. Several are ripe for investigation: the accurate mapping of system area networks in the presence of application cross-traffic, alternative schemes to UP*/ DOWN* for computing deadlock-free routes on arbitrary graphs, randomized and parallel mapping algorithms, and network interface and/or switch hardware support for directly obtaining switch identifiers. This section briefly introduces and discusses them. Accurately mapping the network is essential. Without accurate maps, deriving deadlock-free routes is difficult, at best. Given a realistic model of system area networks and their failure modes, and a network traffic model, can a mapping algorithm be designed and shown to produce an accurate map? It is possible that the high-bandwidths and low-latencies in these networks can enable (1) user-level communication layers, (2) network interfaces, and (3) network switches to condition traffic to satisfy the necessary requirements and assumptions. What are those requirements and assumptions, and can they be both realistic yet theoretically tractable? Insisting upon an idle network, especially in a general-purpose and multi-programmed system, is at best a stop-gap measure. Once system area network maps can be produced in the presence of arbitrary network traffic (but not from an evil adversary), a second area for investigation is finding more robust strategies for de-
To appear in the proceedings of the 9th Annual Symposium on Parallel Algorithms and Architectures (SPAA’97)
riving deadlock-free routes than UP*/DOWN*. UP*/DOWN* is unpredictable, although in practice it can used and heuristics applied to improve its results. There are two types of networks to consider: (nearly)-perfect instances of well-known interconnects, e.g., hypercubes, and all the rest. When initially constructing a system, it is reasonable to expect that a well-known, initial topology is used. Over time, however, the topology may develop imperfections from the incremental addition and removal of switches, hosts, etc. Parallel mapping algorithms have the potential to increase performance. The Myrinet and Berkeley Algorithms both systematically explore the network in a sequential fashion. It is plausible that every network host could map local regions, and upon discovering another host exchange their partial maps. The central question is how to merge such local views into a stable, globally-consistent one. We conjecture that the network mapping problem may have good solution using randomized techniques. One version of this is including a randomized depth-first search hybridized with the breadth-first search in the Berkeley Algorithm. When stuck in a region far from a host, breadth-first starts to generate many replicates. If a few depth-first branches locate any hosts, the merging routine can take great advantage of them as reference points. There are many variations on this theme. In the Myrinet context, further suppose that the firmware were changed a bit, so that instead of a “hit host too soon” error causing a message to be discarded, the host could read it and send a response. Vazirani has suggested [15] a coupon-collecting initial phase to find most of the graph. Probes of maximal depth are sent out in random directions. This is a considerable saving in probes over randomized depth first search, since the whole length of the path is effectively explored with one probe. The dangling edges of the resulting graph can then be explored in a breadth-first way. If the graph has sufficient expansion, we explore most of it quickly. When an unknown switch is encountered, we can test if it is a previously visited one found during coupon-collecting in the manner similar to the one used by the Myricom Algorithm. It is likely we won’t explore far before hitting a switch we have seen before. Thus the breadth-first cost of switch replication is curtailed. Finally, it is tempting to believe that architectural support for selfidentifying switches would make the network mapping problem trivial. However, due to different routing models, as well as the cross-traffic problem, merely adding self-identifying switches does not completely solve the mapping problem: if a probe made it to a switch and back, it would carry a unique identifier and the exploration process would be simpler. Of course, when considering changing switch hardware, one should consider the addition of selfidentification in the context of a laundry-list of other desirable features. For example, programmable time-to-live fields at the link-layer could simplify interface-to-interface protocols and error detection and increase network performance for every message, not just for relatively infrequent probes.
7
Conclusions
This paper has presented a network mapping algorithm for system area networks, for which Myrinet is but one instance. The intuition behind the algorithm was formalized leading to a proof of correctness of the actual algorithm in use. Empirical performance results and characterizations show that for networks of interest in the Berkeley NOW project, the algorithm performance is comparable with the Myricom Algorithm. Although we have some evidence that the algorithm can oftentimes correctly map the network even in the face of heavy application cross-traffic, developing provably correct algorithms for on-line mapping remains a challenging area for future work. The technological niche filled by system area networks is a unique mix of features of MPP and local area networks that pose a
qualitatively different mapping problem than in either the traditional MPP or distributed system domains.
8
Acknowledgments
The authors thank Bob Felderman at Myricom for his explanations and discussions of the Myrinet Algorithm as well as details pertaining to switch hardware and routing. We also are thank Eric Anderson and Steve Lumetta for their timely reviews and comments on drafts of this paper, and the anonymous reviewers for their comments and feedback.
9
References
[1] R. Horst. TNet: A Reliable System Area Network. IEEE Micro, February 1995, vol.15, (no.1):37-45. [2] F. Thomas Leighton. Introduction to Parallel Algorithms and Architectures: Arrays, Trees. Hypercubes, Morgan Kaufmann Publishers, Inc. San Francisco, CA (1992). [3] N. Boden, D. Cohen, R. Felderman, A. Kulawik, C. Seitz, J. Seizovic, and Wen-King Su. Myrinet: A Gigabit-per-Second Local Area Network. IEEE Micro, February 1995, vol.15, (no.1):29-36. [4] T. Anderson, D. Culler, and D. Patterson. A Case for NOW (Networks of Workstations). IEEE Micro, February 1995, vol.15, (no.1):54-64. [5] S. Owicki and A. Karlin. Factors in the Performance of the AN1 Computer Network. Digital Equipment Corporation Systems Research Center, Palo Alto, CA, 1992. [6] T. Cormen, C. Leiserson, and R. Rivest. Introduction to Algorithms. The MIT Press, Cambridge, MA (1990). [7] C. Glass and L. Ni. The Turn Model for Adaptive Routing. Journal of the Association for Computing Machinery, Vol. 41, No. 5, September 1994. [8] W. Dally and C. Seitz. Deadlock-Free Message Routing in Multiprocessor Interconnection Networks. IEEE Transactions on Computers, Vol. C-36, No. 5, May 1987. [10] T. Rodeheffer and M. Schroeder. Automatic Reconfiguration in Autonet. Digital Equipment Corporation Systems Research Center, Palo Alto, CA, 1991. [11] M. Schroeder, A. Birrell, M. Burrows, H. Murray, R. Needham, T. Rodeheffer, E. Satterhwaite, and C. Thacker. Autonet: A High-speed Self-configuring, Local Area Network Using Point-to-point Links. IEEE Journal on Selected Areas in Communications, Vol. 9, No. 9, October 1991. [14] J. McQuillian and D. Walden. The ARPANET design decisions. Computer Networks, 1, August 1977, pp. 243-299. [15] pers. comm. U. Vazirani [16] K. Keeton, T. Anderson, and D. Patterson. LogP Quantified: The Case for Low-Overhead Local Area Networks. In Proc. of Hot Interconnects III, August 1995. [17] P. Druschel, L. Peterson, and B. Davie. Experiences with a High-Speed Network Adaptor: A Software Perspective. In Proceedings of the SIGCOMM ‘94 Symposium, August 1994. [18] T. von Eicken, D. Culler, S. Goldstein, and K.Schauser. Active Messages: a Mechanism for Integrated Communication and Computation. In Proc. of the 19th ISCA, May 1992., Gold Coast, Qld., Australia, pp. 256-266. [19] A. Basu, V. Buch, W. Vogels, and T. von Eicken. U-Net: A User-Level Network Interface for Parallel and Distributed Computing. In Proc. of the 15th SOSP, December 1995. [20] R. Felderman, A. DeSchon, D. Cohen, and G. Finn. ATOMIC: A High-Speed Local Communication Architecture. Journal of HighSpeed Networks, 1, (1994), pp. 1-28.
To appear in the proceedings of the 9th Annual Symposium on Parallel Algorithms and Architectures (SPAA’97)