System Performance Comparisons of Coreless and Standard Packages for Data Rate beyond 20 Gbps Wendemagegnehu T. Beyene, Ralf Schmitt, Hao Shi, and June Feng Rambus Inc 4440 El Camino Real, Los Altos, CA USA
[email protected], Tel : 650 947 5000 Abstract This paper analyzes the impact of standard and coreless packages on the overall high-speed system performance for data rate beyond 20 Gbps. Instead of focusing on package electrical performance in isolation, we study the package impact on the system performance metrics such as voltage and timing margins and bit error rate (BER) bathtub curves in both time and voltage by employing statistical system simulation methods. Furthermore, the package impact on the quality of the power supply network is also studied using conventional frequency and time domain simulation techniques. Finally, three designs with standard and coreless packages are analyzed to compare the package impacts on signal integrity and power integrity of high-speed systems. Introduction Today’s computing systems require ever more memory bandwidth, in particular, with multi-core streaming memory architecture. Personal computers, workstations and servers, routers and switches, consumer electronics and game consoles all need high-speed interfaces. To meet the increasing performance demands of today’s applications, careful design and optimization of system parameters and components are required. For example, in order to enable higher data rates and increase the pin count, packages have moved from wire bonding to a flip chip configuration [1]. However, the impedance control of via and solder balls over wide frequency ranges and the reduction of via inductance in packages can still be challenging in standard flip-chip ball grid array (FCBGA) packages to facilitate higher data rates. As the data rate increases, the impact of packages on the system performance needs to be considered more closely. Recently, the impacts of several packages with various stack ups and layer thickness on the performance of high-speed systems are analyzed [2]-[3]. The electrical performance of standard and coreless flip-chip packages is compared and both signal and power integrity analyses are considered. In this paper, we study the impact of standard and coreless packages on the system performance in both timing and voltage margins by employing statistical system simulation methods. The signaling performance is compared using such metrics as eye diagrams and bathtub curves. In addition, the impact on power integrity is also studied using conventional frequency and time-domain simulation techniques. These analyses quantify and rank the system performances of high speed interfaces with standard packages with core thickness of 800 µm, 400 µm, and coreless packages. The impact of packages is compared at very lower BER using statistical methods. The impairment of the channel is represented using a probability distribution. Then, the behaviors of the transmitter and receiver are included based on linearity assumptions.
978-1-4244-2231-9/08/$25.00 ©2008 IEEE
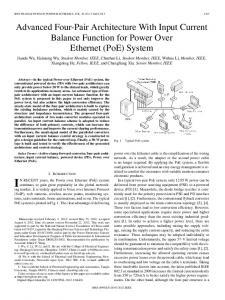
Package Design and Modeling Currently, wide-range of packages is available with varying core thickness. Coreless packages without the thick Bismaleimide-Triazine (BT)-core layer are also now readily available. These packages have overall substrate thicknesses that vary from a fraction of millimeter to half millimeters. Their electrical performances are also different. The loss, the effective inductances, and the impedance of these packages are dissimilar in high-speed application. The stack-up of a typical 6 layer design is shown in Fig. 1(a). The design rules and material properties for packages with varying core thickness are shown in Fig. 1(b). The thickness of the core, the diameters of the vias, and the via separation vary significantly. Dvb
S1 Vdd Hb H Vss b
Hc
tb
εrb , tan(δb) εrc , tan(δc)
tc
Dvc Ds
Vss Vdd S2
tc
Hb
Dpc Dac
Hb
tb
(a) Case0
Case1
Case2
Case3
Description
Hc
135 um
200 um
400 um
800 um
core thickness
Hb
50 um
35 um
35 um
40 um
buildup thickness
εrc
3.7
3.7
3.8
4.3
tan(δc)
0.017
0.017
0.026
0.0085
εrc
3.7
3.7
3.36
3.4
tan(δb)
0.017
0.017
0.02
0.027
Dvc
50 um
50 um
120 um
200 um
diameter of core via
Dvb
43 um
43 um
65 um
50 um
diameter of buildup via
Dpc
110 um
110 um
300 um
450 um
diameter of core via pad
Dac
260 um
260 um
600 um
650 um
diameter of core via antipad
Ds
1 mm
1 mm
1 mm
1 mm
distance between Vdd/Vss vias
tc
12 um
12 um
21 um
20 um
core layer metal thickness
tb
12 um
12 um
15 um
18 um
buildup layer metal thickness
dielectric constant of core loss tangent of core dielectric constant of buildup loss tangent of buildup
Figure 1: (a) The stack up for a 6-layer design and (b) the package parameters and the design rules of an FCBGA. Three different package designs, a standard package with core thickness of 800 µm and 400 µm, and coreless packages, are analyzed and compared. The 6-layer packages have a size of 35×35 mm2. The diameters of the solder balls are 650 µm. The characteristic parameters of uniform interconnect structures that can support quasi-TEM mode wave propagation in package and PCB are often modeled using a 2D electromagnetic solver [4]. However, the vias and solder balls
526
2008 Electronic Components and Technology Conference
in the packages are modeled using a 3D electromagnetic solver [5]. The simulation models for standard thick and coreless packages are shown in Fig. 2. The capacitive effects of the large core via diameters make it difficult to obtain a higher impedance in standard packages. Even though large clearance is made in design of the power and ground planes in order to reduce the capacitance of the core via, the reflection and delay of high-speed signals are larger in the standard packages than in coreless packages.
The broadband characteristics of the combined interconnect structure of solder ball and via are captured using scattering parameters. The amplitude of the insertion loss and return loss of the combined via and solder balls of the standard package with core thickness of 800 µm and 400 µm, and coreless packages are shown in Fig. 3(a). The insertion loss and return loss of the coreless package indicate improved characteristics. The Time Domain Reflectormetry (TDR) waveforms are shown in Fig. 3(b). The coreless package shows better impedance matching than the standard packages. coreless
solder ball
Core (400 µm)
coreless
Return loss
Core (800 µm)
Insertion loss
core via
(a)
(a)
Impedance (Ohm)
Core (400 µm)
core via solder ball
coreless
(b)
micro via
solder ball
(c) Figure 2 : The 3D field modeling of vertical interconnects consisting solder balls and vias in (a) 800 µm-thick core, (b) 400 µm-thick core, and (c) coreless packages.
coreless
Core (800 µm)
(b)
Figure 3: (a) The insertion loss and (b) the TDR waveforms of the combined solder ball and via in the package. Modeling and Analysis of High-Speed Channel In order to evaluate the impact of the packages on the overall performance of a high-speed system, a chip-to-chip interconnect system, shown in Fig. 4, is analyzed. The channel model has 6-in. long FR4 PCB traces, two FCBGA packages each with substrate traces up to 20-mm long, PCB and package vias, and device parasitics, (Ci’s and Ri’s). All these components contribute to signal attenuation and dispersion as it propagates through the channel. In order to analyze the channel at multi-gigahertz frequencies, accurate models of the passive and active components in the channel are generated. The models include lumped elements, transmission lines, and scattering parameter blocks. The scattering parameters from field solvers are integrated in the channel model using circuit simulation tools such as ADS or HSPICE [6]-[7]. The tools are capable of handling sampled or tabular scattering parameters through a convolution technique. Three chip-to-
527
2008 Electronic Components and Technology Conference
chip channels with the standard packages with 800 µm and 400 µm thick cores and coreless packages are compared. In order to simplify the comparison of the packages, the equalization circuitries are excluded from the channel models. Only minimal device parasitics is included in the channel model in order to guarantee reasonable eye opening and low BER. Chip A
Chip B
Package
Package PCB
(a)
RTY
RTY
Zpkg IOLY
IOLY
Zpkg
Ci
Ci IOL
RTD
Zpcb
Ri
Ri
RTD Ci
Ci
Ri
Ri
As the signal propagates in these three channels, the signal degrades by frequency-dependent attenuation and by the reflection caused by the impedance mismatches along these transmission media including the packages. These characteristics of the channels are described by the insertion loss and the return loss of the chip-to-chip interconnect system as shown in Fig. 5(a) and 5(b), respectively. The channel with the coreless packages shows better performance; on the other hand, the performances of the channels with standard packages degrade more as the data rate increases. One of the essential time-domain waveforms to characterize a high-speed channel in a digital system is a single-bit response (SBR). The SBRs of the three channels are shown in Fig. 6. The channel with the coreless packages shows smaller discontinuities and smaller propagation delay and larger pulse amplitude. 0.7 0.6
(b)
0
Amplitude (dB)
-5
coreless
Core (800 µm) 50
100
150
200
250
300
350
Figure 6: Single-bit responses of the chip-to-chip interconnect system with standard 800 µm -thick, 400 µm –thick packages, and coreless packages.
Core (400 µm)
10
15
A better figure of merit to compare the three channels is an eye diagram. In order to generate the eye diagrams, long timedomain simulations are performed using long and complex pseudo random bit pattern sequences (PRBS) as excitations. The received eye diagrams of the chip-to-chip interconnect systems with standard packages of 800 µm-thick, 400 µm– thick cores, and coreless packages and operating at a data rate of 20 Gbps are shown in Fig. 7 (a), (b), and (c), respectively. The received eye diagram of the system with coreless packages has clearly larger voltage and timing margins. The time domain simulation of very long and complex PRBS that can give statistically meaningful information with high confidence is very time consuming. One approach to reduce the time domain simulation is to construct a short bit pattern that stresses the voltage and time domain margins in the channel. This worst-case bit pattern can be generated from the SBR of the channel. The disadvantage of the use of worstcase short pattern to evaluate digital system is that it can lead to very pessimistic results.
20
(a) -20
Core (400 µm)
Core (800 µm) -30
-40
-50
coreless
-60
5
Core (400 µm)
Time [psec]
Freqency [GHz]
-70 0
0.2
-0.1 0
-15
5
0.3
0
Core (800 µm)
-25 0
0.4
0.1
-10
-20
Amplitude (dB)
Voltage [V]
Figure 4: (a) A chip-to-chip interconnect system and (b) the channel model of one of the differential pairs.
coreless
0.5
10
15
20
Frequency [GHz]
(b) Figure 5: (a) Insertion loss and (b) return loss of the interconnect systems in Fig. 4 with standard packages with core thickness of 800 um, 400 um, and coreless packages with minimal device parasitics.
528
2008 Electronic Components and Technology Conference
Voltage [V]
simulation techniques. In addition, current high-speed interfaces employ complex circuitries and digital processing components such as a pre-emphasis filter for the transmitter and a decision feedback equalizer for the receiver to mitigate channel impairment such inter symbol interference (ISI). Synchronizing circuits such as CDR, PLL and/or DLL are used to time the data transmissions. Since their responses to small deviations in voltage and time can be significant, the behaviors of these complex circuitries need to be accurately modeled. The time-domain simulation of high-speed channels with these circuitries is no longer tractable even for higher BER, above 1e-12. An alternative approach is to use a system simulation approach by modeling the components in a link as blocks whose behaviors are described by higher-level languages such as MATLAB or Verlog-A [8]-[10]. The channel behavior is characterized through an ISI probability density function (PDF) that is analytically derived from the channel characteristic functions. The channel ISI PDF is commonly built from the channel pulse or step responses [8]. Then, the ISI eye is constructed by calculating the PDF at multiple sampling points of the channel response within one unit interval. The statistical eye, shown in Fig. 8(a), is constructed, by combining the ISI eye with the device noise. It gives the BER over voltage and time offsets. Thus, instead of performing the time-domain simulation by solving the system equation at each discrete time, the response (BER) is efficiently calculated by convolving together the probability density functions or the probability mass functions of the various blocks in the links [9]. It is important to note that this statistical approach is based on superposition and therefore relies on the linearity of the system. In addition to the jitter and voltage noise caused by the channel and devices, the transmitter and receiver further reduces the system margins by introducing timing uncertainties. This effect is captured by using the sampling distribution shown in Fig. 8(b). The overall performance of the system is determined by convolving the statistical eye diagrams with the sampling distribution of Fig. 8(b). Then, the smallest voltage and timing margins give the bathtub curves as functions of voltage and time as shown in Fig. 9(a) and 9(b), respectively. The channel with coreless packages gives larger margins at BER of 1e-15.
Time [ps]
Voltage [V]
(a)
Time [ps]
Voltage [V]
(b)
Time [ps]
(c) Figure 7 : The eye diagrams of the chip-to-chip interconnect systems operating at 20 Gbps with (a) standard 800 µm-thick core and (b) 400 µm-thick core and (c) coreless packages. Statistical Simulation of High-Speed System The calculation of BER using time-domain simulation is very time consuming. It is almost impossible to calculate BER below 1e-12 with high confidence using conventional circuit
Design Target for Power Supply Systems of High-Speed Interface For high-speed I/O systems, power integrity is an important design parameter. Power supply noise generates jitter and signal distortions that limit the performance of the interface system. As the data rates of I/O systems increase and supply voltage shrinks, the amount of distortion that can be tolerated in the system is decreasing, requiring an ever higher quality of the power distribution system. A special concern for the supply design of high-speed I/O systems is the ‘package-chip resonance’ between the inductance of the package solution and the local capacitance on the chip [11]-[13]. This resonance, which typically occurs at medium frequencies around 50 MHz to 300 MHz, generates a large increase in the impedance of the Power Distribution
529
2008 Electronic Components and Technology Conference
respectively. The thin-core packages have 200 µm and 135 µm thick core vias, respectively. The coreless package has 35 µm thick core via. 0
Core (800 µm)
-5
BER
Network (PDN) and can cause significant supply noise in this frequency range. The inductance causing this resonance is generated by the power supply system inside the package in combination with the decoupling solution on the PCB. This inductance should be as small as possible to reduce the supply impedance in this medium frequency range. Therefore, minimizing the power supply inductance of the package is a major design goal for high-speed I/O systems.
-10
Core (400 µm)
coreless -15 -300
-200
-100
0
100
200
300
Voltage Offset [mV]
(a) 0
Core (800 µm)
(a) Sampling Distribution (log10)
-1 -5
BER
-1.5
Core (400 µm) -10
-2
coreless
-2.5 -15 0
-3 -25
10
20
30
40
50
Time [ps] -20
-15
-10
-5
0
5
10
15
20
(b)
25
Time [ps]
Figure 9: Bit error rate (BER) of the chip-to-chip interconnect systems operating at 20 Gbps as a functions of (a) voltage offset and (b) time.
(b)
Figure 8: The statistical eye diagram and (b) the sampling distribution in the system at a data rate of 20 Gbps. The vias through the core layer of a package can contribute significantly to the total inductance of the package supply system. The length of these vias, which is the thickness of the core layer, is much longer than the length of other vias in the build-up layers of the package as shown in Fig. 1(a). Furthermore, the large size of these core vias limits the number of vias that can be placed for each supply rail as well as the proximity between supply and ground vias. For packages with smaller core thickness, and especially for coreless packages, the inductance contribution of the core vias decreases, improving the package supply inductance. To analyze the improvement in package supply inductance between standard packages with different core thickness and coreless packages we extracted the power supply inductance in the package of the 20 Gbps memory system for different package options. The table in Fig. 1(b) shows the core parameters of the analyzed package options. The thick-core standard packages have 800 µm and 400 µm thick core vias,
Core Via Pair Inductance First, the inductances of a supply via for the core vias of the different package options are extracted. A single supply via and a ground via between two power supply pairs of the package are placed and the inductance from the top of the supply via to the bottom of the supply via is extracted. Fig. 10 shows the simulation model for the inductance extraction. Lumped ports with 50 Ohm are used to excite the system and extract the scattering parameters [5]. For all package options, the ground via is placed in the same distance of 1 mm to the supply via. The distance between the vias in a differential signal pair is also set to 1 mm for all cases. For the standard packages with 800 µm and 400 µm core thickness, this is a realistic average via spacing due to the large antipad size of these vias. For the coreless package option, this assumption is pessimistic, as their antipad size would allow a closer placement between vias. We will discuss the impact of this assumption in a later section.
530
2008 Electronic Components and Technology Conference
Lumped Port 1
Figure 10: Model of core via pair with power-ground planes used for via inductance extraction.
Supply Package Inductance Fig. 12 shows a schematic of the current flow in the package for the power supply used for the core logic of the chip and for the I/O supply. The current flow through the package for the core logic supply is primarily vertical, and accordingly the package supply inductance for this power rail is dominated by the via inductances in the package. For this case, the reduction of via inductance shown in Fig. 11 will lead to a drastic reduction of the package supply inductance. I/O power supplies, however, are typically routed inside the package from the periphery of the chip to the periphery of the package, providing a return path for the output signals referencing this supply. Since the package is usually larger than the chip, the package supply inductance for I/O supply rails has contributions from vias as well as power planes inside the package. 160.0
Core Via Inductance [pH]
1000
Package Inductance [pH]
Fig. 11 shows the extracted via (pair) inductance for the different package options. It shows an approximately linear relationship between via (pair) inductance and core thickness (i.e. via length) for a core thickness up to 400 µm. For the coreless package, the via pair inductance is reduced by more than a factor of 10× compared to a via pair in a standard package with 400 µm core thickness, even though the distance between the supply via and the return ground via is the same in both cases.
140.0 120.0
Core via Plane
100.0 80.0 60.0 40.0 20.0 0.0
800um
coreless
135um
200um
400um
800um
Core Type
800
400um
Figure 13: Package supply inductance for I/O supply rail and the contribution of core vias to this inductance.
600 400
200um 135um
200 coreless 0 0
100
200
300
400
500
600
700
800
900
Core Thickness [um]
Figure 11: Via (pair) inductance as a function of package core thickness.
Chip Core Power
I/O Power
We extracted the package supply inductance of the memory interface for the different packaging option. All packaging options are using the same number of core vias as well as the same average distance between a core supply via and the return ground via. Fig. 13 shows the package supply inductances as well as the contribution of the core vias to this inductance. As expected, Fig. 13 shows that the package supply inductance is decreasing as the core thickness of the package, and with this the inductance of a core via pair decreases. It also shows that for package core thickness ≤ 200 µm, the contribution of the core vias to the total package inductance is less than 50%. For the coreless package, the core vias contribute less than 10% to the total package supply inductance, and so the package inductance is largely determined by the plane inductances inside the package. Reducing the proximity between via pairs or increasing the number of core vias would not have a significant impact on the package supply inductance anymore.
Figure 12: Schematic of current flow for core logic supply and I/O supply.
531
2008 Electronic Components and Technology Conference
Supply Package Impedance Fig. 14 shows the plots of the input impedances of the power supply networks of the systems with the standard 800 um-thick core and 400 um-thick core packages and coreless packages. The system with the coreless package shows lower impedance of the power supply network and a shift of the resonant peak of the impedance to 1 GHz frequency range. Thus, the coreless package suppresses the supply noise over mid-frequency range by providing lower impedance to power supply network.
|Z|, Ohm
Core (400 µm)
Core (800 µm)
coreless
Frequency, Hz
Figure 14: The impedance of power distribution networks of the interconnect system with standard 800 um-thick core and 400 um-thick core, and coreless packages. Thus, a coreless package provides a superior via density and better noise performance. It minimizes power-supply induced jitter and signal distortion that can limit the performance of digital systems. The coreless package is essential to suppress supply noise for high-speed I/O systems operating at 20 Gbps and beyond. Conclusions In this paper, it is demonstrated using multiple performance metrics and statistical simulation methods that the coreless package shows overall superiority in both signal and power integrity. For high-speed signaling system, coreless packages or thin core packages with core thickness less than 200 µm provide improved voltage and timing margins and are essential to support data rates of 20 Gbps and over. Some of the design optimization steps adapted to increase the bandwidth of the standard packages are also discussed. This paper quantifies and ranks the system performances of high speed interfaces with standard packages with varying core thickness and coreless packages. In addition to the passive channel, the impact of the transmitter and receiver is included to calculate the system BER.
References 1. W. T. Beyene, C. Yuan, R. Dhat, and D. Secker, “Effects of plating stubs on the electrical performance of wirebond PBGA packages,” Proceedings of the International Conference on Advanced Packaging and Systems, Reno, NA, pp. 25-30, March 10-13, 2002. 2. R. Sung, K. Chiang, Y. P. Wang, C.S. Hsiao, “Comparative analysis of electrical performance on coreless and standard flip-chip substrate,” Proceedings of Electrical Components and Technology Conference, Reno, NA, pp. 1921-1924, May 29-June 1, 2007. 3. J. Sakai,T. Shimoto, K. Nakase, H. Inoue, K. Motonaga, H. Honda, “Signal integrity and power integrity properties of FCBGA based on ultra-thin, high density package substrate,” Proceedings of Electrical Components and Technology Conference, Lake Buena Vista, FL, pp. 284290, May 31-June 3, 2005. 4. Djordjevic, M. B. Bazdar, T. Sarkar, and R. Harrington, LINPAR for Windows, version 2.0, Software and User's Manual, Boston: Artech House, Inc, 1999.. 5. Ansoft High Frequency Structure Simulator, Ansoft, 1999. 6. Agilent Advanced Design System User's Guide, Agilent Technologies, February 2001, Agilent Technologies, Santa Rosa, CA. 7. HSPICE Simulation and Analysis User Guide, Release U2003.03-PA, March 2003 8. A. Sanders, M. Resso, and J. D’Ambrosia,
“Channel compliance testing utilizing novel statistical eye methodology,” DesignCon, February 2004. 9. V. Stojanovic, Channel Limited High-Speed Links: Modeling, Analysis and Design, PhD Thesis, Stanford University, 2004 Ahmad, “Performance 10. B.
Specification interconnect”, DesignCon, February 2003.
of
11. M. Swaminatan and A. E. Engin, Power Integrity Modeling and Design for Seminconductors and Systems, Prentice-Hall (Boston, MA 2007). 12. R. Schmitt, X. Huang, C. Yuan, “Power Distribution Analysis Methodology for a Multi-Gigabit I/O Interface”, Proceedings 12th Topical Meeting on Electrical Performance of Electronic Packages, pp 141-144, Princeton, 2003. 13. R. Schmitt, C. Yuan, “Power Distribution Design Considerations and Methodology for Multi-Gigabit I/Os”, Proceedings IEEE Internaltional Symposium on Electromagnetic Compatibility, pp 660-665, Chicago, 2005.
Acknowledgments The authors would like thank Sam Khalili and Ming Li for providing the package design rules, Sam Chang and Jihong Ren for supporting the simulation environment and Chuck Yuan for reviewing the paper.
532
2008 Electronic Components and Technology Conference