letters to nature Acknowledgements The authors thank S. L. Opitz, N. Watson and E. Dikovskaia for technical support; K. Hochedlinger and T. Holm for assistance with intracytoplasmic oocyte injection; and W. Lensch for critical revisions of the manuscript. This work was supported by grants from the National Institutes of Health, the National Science Foundation Biotechnology Process Engineering Center, and the Dutch Cancer Society ‘Koningin Wilhelmina fonds’. G.Q.D. is a Birnbaum Scholar of the Leukemia and Lymphoma Society of America. J.G. was sponsored by the Human Frontiers Science Foundation. K.E. is a Junior Fellow in the Harvard Society of Fellows. Competing interests statement The authors declare that they have no competing financial interests. Correspondence and requests for materials should be addressed to G.Q.D. (
[email protected]).
..............................................................
T-cell priming by dendritic cells in lymph nodes occurs in three distinct phases Thorsten R. Mempel, Sarah E. Henrickson & Ulrich H. von Andrian The CBR Institute for Biomedical Research, Department of Pathology, Harvard Medical School, 200 Longwood Avenue, Boston, Massachusetts 02115, USA .............................................................................................................................................................................
Primary T-cell responses in lymph nodes (LNs) require contactdependent information exchange between T cells and dendritic cells (DCs). Because lymphocytes continually enter and leave normal LNs, the resident lymphocyte pool is composed of nonsynchronized cells with different dwell times that display heterogeneous behaviour in mouse LNs in vitro1–3. Here we employ two-photon microscopy in vivo to study antigen-presenting DCs and naive T cells whose dwell time in LNs was synchronized. During the first 8 h after entering from the blood, T cells underwent multiple short encounters with DCs, progressively decreased their motility, and upregulated activation markers. During the subsequent 12 h T cells formed long-lasting stable conjugates with DCs and began to secrete interleukin-2 and interferon-g. On the second day, coinciding with the onset of proliferation, T cells resumed their rapid migration and short DC contacts. Thus, T-cell priming by DCs occurs in three successive stages: transient serial encounters during the first activation phase are followed by a second phase of stable contacts culminating in cytokine production, which makes a transition into a third phase of high motility and rapid proliferation. Naive T cells recirculate continually between the blood and LNs to search for antigen4. The intranodal encounter of a peptide–major histocompatibility complex (MHC) complex that is recognized by a T-cell antigen receptor (TCR) will only result in full-fledged T cell activation upon co-stimulation provided by mature DCs. These professional antigen-presenting cells collect antigens in peripheral tissues and migrate to LNs through lymph vessels. T-cell priming by DCs induces activation markers, cytokine secretion, and proliferation. Several reports have analysed the dynamics of T-cell–DC interactions in excised LNs, but the methods and results have been variable and it is unknown how the absence of lymph and blood flow or innervation influences T-cell–DC interactions1–3,5. There is therefore still no comprehensive description of what happens in a truly physiological setting when naive T cells enter LNs that contain antigen-presenting DCs. We have used two-photon microscopy6 to study lymphocyte migration and interactions with DCs within popliteal LNs of anaesthetized mice. Our preparation preserved physiological blood and lymph flow7, whereas, in our hands, lymph flow was 154
compromised when we attempted to adapt the well-established inguinal lymph-node preparation to two-photon imaging8,9 (not shown). Recipient mice received footpad injections of fluorescent DCs, which entered lymph vessels and accumulated in the popliteal LN during the following day. Differentially tagged TCR transgenic CD8þT cells were injected intravenously 18 h later (Fig. 1a). T cells homed rapidly through high endothelial venules (HEVs) into popliteal LNs7, where they constituted 1–2% of all CD8þ cells 2 h after injection. At this point, further lymphocyte homing was blocked by the injection of anti-L-selectin10. This ensured that all imaged T cells had entered popliteal LNs during the initial 2-h window and enabled us to study synchronized resident cells during the subsequent 2 days. Initially, we examined the phenotype of injected DCs that migrated to draining LNs (Fig. 1b). Immature splenic CD11cþ DCs from CD45.1þ donors were injected into CD45.2þ congenic recipients. Because immature DCs express little or no CCR7—a chemokine receptor required for DC migration into lymphatics and within LNs11—we co-injected lipopolysaccharide (LPS; 10 ng), which induces DC maturation and CCR7 expression12. Consequently, DCs recovered from popliteal LNs were mature and either CD11bþCD8a2 or CD11b2CD8alow/2. CD8ahigh input DCs were rarely detected in LNs. This might reflect an inability of CD8ahigh DCs to migrate to LNs, or the downregulation of CD8a during transit. To examine DCs in situ, we administered footpad injections of red fluorescent DCs and analysed their behaviour within popliteal LNs. After 20 h a fraction of migrated DCs (about 20–50%) resided in the subcapsular sinus and the superficial cortex. The remainder congregated in distinct regions within the deep cortex, where they localized with homed T cells (Supplementary Fig. S1a). A reason for the non-uniform distribution of DCs in the T cell area became apparent after fluorescein isothiocyanate–dextran injection to delineate blood vessels. In line with recent observations13, many DCs lined up around HEVs in strategic positions to interact with newly homed T cells (Supplementary Fig. S1b; Supplementary Information 2, 3). This distribution pattern became less apparent at day 2 or 3 after injection (Supplementary Information 4). One day after injection, DCs in T-cell areas were remarkably motile, whether they presented antigen to T cells or not (Fig. 1c–g; Supplementary Information 5). The median three-dimensional (3D) instantaneous velocity was 6.6 mm min21 (Fig. 1e), which is in good agreement with measurements of two-dimensional velocities in explanted LNs3. Individual DCs followed random paths without apparent directional bias. Even sessile DCs constantly extended and retracted dendrites and pseudopods. The motility of both antigen-pulsed and control DCs was highest between 2 and 8 h after T-cell transfer (20–26 h after DC injection) and decreased over time (Fig. 1f, g; Supplementary Information 5). This progressive decrease in motility might reflect DC ‘exhaustion’, which has been proposed to occur after LPS activation14. Migratory dynamics in LNs were closely dependent on physiological conditions: T cells and DCs stopped migrating and assumed a round shape within minutes after cardiovascular arrest (Supplementary Information 6), even with a tissue temperature maintained at 36 8C, a requirement for interstitial T-cell migration2. In living animals without DC injection, intranodal T cells moved rapidly, reaching peak 3D velocities of 40 mm min21 (Fig. 2a–c; Supplementary Information 7). In LNs draining DC-injected footpads, 3D velocities were equivalent (Fig. 2c, d) but T cells turned at steeper angles and covered a smaller volume of the paracortex, resulting in decreased motility coefficients, even when DCs carried no antigen (Fig. 2e, f). Mean T-cell displacement plots in the antigen-containing LNs revealed a plateau at about 15 mm displacement (Fig. 2e), indicating confined motility15. Thus, DC plus LPS injections induced LN paracortex partitioning into smaller compartments in which incoming T cells were retained, perhaps owing
©2004 Nature Publishing Group
NATURE | VOL 427 | 8 JANUARY 2004 | www.nature.com/nature
letters to nature to motility-attenuating mediators released by DCs and/or other cells, or adhesive contacts between T cells and intranodal structures or confined clusters of DCs16. To address the latter possibility, we examined T-cell migratory behaviour and the kinetics of T-cell–DC interactions in different LN areas. Superficial T cells (less than 100 mm below the capsule) were less motile than those in the deep T-cell area, whether DCs were injected or not. There was additional heterogeneity in the deep T-cell zone of LNs that drained DC injection sites; T cells in areas with high DC density were less motile than in DC-poor areas. We therefore analysed only regions that were more than 150 mm below the LN capsule and contained comparably high DC densities. Here, T-cell motility depended on the presence of antigen and T-cell
dwell time (Fig. 2g). Although instantaneous 3D velocities remained constant in LNs that contained control DCs, T cells migrated more slowly after encountering antigen-bearing DCs for 8–20 h. In contrast, T-cell migration after antigen exposure for 2 or 44 h was similar to T-cell migration in the presence of control DCs. When T cells encountered DCs shortly after homing (2–4 h after transfer), they formed predominantly brief contacts before detaching to interact with other DCs nearby (Fig. 3a–d; Supplementary Information 8). Contacts lasted slightly longer with antigen-loaded DCs (mean ^ s.e.m. 5.9 ^ 0.8 min; median 3.8 min) than with control DCs (4.1 ^ 0.4 min; median 2.5 min; P , 0.05). At 5–8 h, contacts lasted noticeably longer (median 3.8 min without antigen; 7.3 min with antigen) but rarely exceeded 30 min (Fig. 3e). A
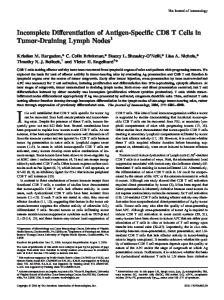
Figure 1 Surface phenotype and migratory properties of DCs in popliteal LNs. a, Experimental protocol. Antigen-pulsed or unpulsed DCs were injected into recipient footpads 18 h before adoptive transfer of T cells. Animals received anti-L-selectin monoclonal antibody Mel-14 2 h and 26 h later, and popliteal LNs were imaged at different times thereafter. b–f, Data from unpulsed DCs at 2–3 h after T-cell injection. b, CD11cþCD45.1þ donor DCs were examined by flow cytometry before injection into the footpad of CD45.2þ recipients (input DC) and after their migration into LNs (migrated DC) for subset composition (CD8a, CD11b) and maturation state (MHC class II, CD86). c, Intravital two-photon micrographs of a representative intranodal CMTMR-labelled DC (see also Supplementary Information 5). The migratory path of the DC was illustrated by
tracking the 3D centroid (yellow dots) in successive image stacks. Time after DC injection is shown. The mean 3D velocity of this cell was 8.4 mm min21. Scale bar, 20 mm. d, Representative tracks of migrating DCs depicted in x–y, x–z and y–z views (left; scale bar, 20 mm) and displayed in 3D (right; grid squares are 20.6 mm £ 20.6 mm). e, Frequency histograms of 3D instantaneous velocities (n ¼ 840). Arrow indicates median (6.6 mm min21). f, Mean displacement plot for DCs shown in e. The straight line denotes the regression function of the initial, linear segment of curve (r 2 ¼ 0.95). The motility coefficient M was calculated from the slope of the regression line as M ¼ x 2/6t, where x is the displacement at time t (ref. 2), and was 4.35 mm3 min21. g, Time course of motility coefficients for unpulsed (open circles) and antigen-pulsed (filled circles) DCs.
NATURE | VOL 427 | 8 JANUARY 2004 | www.nature.com/nature
©2004 Nature Publishing Group
155
letters to nature marked change in T-cell–DC conjugation was apparent when LNs were imaged at 8–12 h (Supplementary Information 9). Most conjugates with antigen-presenting DCs lasted longer than 30 min (86%), and the majority (64%) remained stable throughout the 60 min observation period. We followed single conjugates over up to 3 h, indicating that these interactions can be sustained for a substantial period. Prolonged interactions were still apparent at 20–26 h, but about 70% of the contacts had returned to short encounter mode. One day later (44–48 h), T cells engaged in brief contacts only (Supplementary Information 4). These observations indicate that naive CD8 T cells interacted with antigen-presenting DCs in three sequential stages. Phase one constituted the first approximately 8 h after T-cell entry into LNs and was characterized by short encounters of rapidly migrating cells
with numerous DCs, preferentially in the vicinity of HEVs. By contrast, in vitro stimulation of TCRs on T cells migrating on twodimensional surfaces provides an immediate stop signal followed by assembly of the so-called supramolecular activation cluster or immunological synapse at the contact site17–20. The formation of mature synapses between naive T cells and antigen-presenting cells requires about 30 min (ref. 20). It is controversial whether and when immunological synapses form in vivo and whether they are required for T-cell activation. For example, T-cell–DC interactions in collagen matrices last only minutes but induce T-cell activation21. Given the short duration of contacts during phase one, it is unlikely that mature immunological synapses could have formed. Nevertheless, in contrast with LNs that did not receive DCs, T cells in DCcontaining LNs upregulated CD44 and CD69 during the first 8 h
Figure 2 Effect of antigen on T-cell motility in LNs. a, Intranodal T cell migrating between tetramethylrhodamine b-isothiocyanate–dextran-filled capillaries in the absence of transferred DCs (see also Supplementary Information 7). Scale bar, 20 mm. b, Twodimensional (left; scale bar, 20 mm) and 3D (right; grid squares are 15.4 mm £ 15.4 mm) depiction of representative T-cell tracks. c, d, Representative frequency histograms of 3D instantaneous velocities (upper panels) and turning angles (lower panels) of T cells migrating in the absence (c) or presence (d) of LPS-matured DCs. Arrows in the upper panels indicate medians (8.9 mm min21 in c; 8.3 mm min21 in d). e, Mean displacement
plots of T cells in the absence (blue) or presence (green) of LPS-matured DCs in LNs. f, Time course of T-cell motility coefficients in the presence of control DCs (open circles) and antigen-bearing DCs (filled circles). Triangle denotes T-cell motility coefficient without DC injection. g, 3D instantaneous velocity histograms of T cells in representative LNs at various times after adoptive transfer in the presence of antigen-pulsed (filled bars) or control (open bars) DCs. Medians are indicated by arrows; values shown are in units of mm min21.
156
©2004 Nature Publishing Group
NATURE | VOL 427 | 8 JANUARY 2004 | www.nature.com/nature
letters to nature (Fig. 3f, g). Thus, the brief interactions with DCs were sufficient for T-cell activation, at least at the level of these early activation markers. However, the interleukin (IL)-2 receptor, CD25, was only marginally increased, and isolated LN T cells did not spontaneously produce IL-2 or interferon (IFN)-g after 8 h (not shown). Even when T cells were restimulated for 3 h, few cells secreted cytokines, and only at low levels (Fig. 3h).
Phase two lasted from about 8 h until about 24 h after T-cell transfer. This phase was dominated by T-cell–DC conjugates that remained stable for more than 1 h. The low T-cell velocities during this stage (Fig. 2g) reflect, in part, the slow migration of DCs that dragged interacting T cells along with them (Supplementary Information 10). Thus, active T-cell migration was even more depressed than was indicated by velocity measurements. Many T
a 02:41:00 DC4
02:41:30
02:44:00
02:46:15
02:48:00
10:40:00
10:44:00
10:47:30
10:54:00
02:49:30
02:50:45
02:53:45
03:01:00
03:02:15
11:10:00
11:12:45
11:18:00
11:27:30
DC3 DC2 DC1 10:59:30
b P