ABSTRACT. We present a constant-false alarm rate detection scheme for use in Through-the-Wall Radar Imaging. We consider multiple-viewing scenarios with ...
TARGET DETECTION IN MULTIPLE-VIEWING THROUGH-THE-WALL RADAR IMAGING Christian Debes1 , Moeness G. Amin2 and Abdelhak M. Zoubir1 Signal Processing Group Technische Universit¨at Darmstadt Darmstadt, Germany 1
2
We present a constant-false alarm rate detection scheme for use in Through-the-Wall Radar Imaging. We consider multiple-viewing scenarios with an arbitrary number of vantage points. Classical detection theory is used to fuse the obtained radar images to one reference image. By doing so, clutter and noise artifacts which are strongly represented in the individual images are reduced and targets of interest are more clearly visible. Index Terms— Through-the-wall, radar imaging, array signal processing, synthetic aperture radar, image fusion 1. INTRODUCTION Electromagnetic waves passing through a medium are subject to amplitude and phase distortion. There is an increasing need to develop algorithms to combat wall impairing effects, permitting detection, classication, and location of human behind walls [1, 2]. Seeing optically obscured objects behind obstacles such as walls, doors, and other visually opaque materials is a powerful tool for a variety of civilian, law enforcement, and military applications. It has been recently sought out in rescue missions, searching for victims and survivors in re, earthquakes and avalanches. It also allows behindthe-wall detection and surveillance of suspected criminals and outlaws. Typical sensing for indoor targets is based on emission and reception of radio frequency (RF). RF signal waveforms below S-band are capable of penetrating through building walls, but the resulting observations are sensitive to a wide range of factors, including layout geometry, interior and exterior wall thicknesses, wall EM scattering signatures, existence of doors and windows, and clutter objects within the building. In many urban sensing situations, it is possible to have access to different sides around the structure, allowing multi-viewing imaging [3, 4]. Fusing a set of multi-viewing Throughthe-Wall (TTW) radar images and generating a single reference image has recently become a topic of interest. In [3], each recorded radar image was binarized by applying a direct thresholding scheme. Image fusion was then performed by pixel-wise multiplication. Therefore, a pixel corresponds to a target only if a strong reection at that particular position is obtained in each radar image. This method shows improved results compared to the scenario when only a single image is The work by Moeness Amin is supported by ONR, grant no N00014-07C-0413
���������������������������������,(((
processed. The effect of clutter, which has different RF signatures at different views, is strongly reduced. In this paper, we perform image fusion using hypothesis testing rather than simple image thresholding schemes. We evaluate TTW radar image statistics and derive a constant falsealarm rate detector. We hereby assume imaging through concrete walls with targets detectable at least from one view. 2. RADAR IMAGE STATISTICS Fusion strategies for multiple location synthetic aperture radar (SAR) images using classical detection schemes have been used by Papson and Narayanan in [5]. They assume all magnitude images to be independent and identically distributed (i.i.d.), both the null and alternative hypotheses are described by Gaussian distributions. In order to evaluate typical indoor TTW radar imaging sceí6
í4
Crossrange (ft)
ABSTRACT
Center for Advanced Communications Villanova University Villanova, PA, USA
í2
0
2
4
6 18
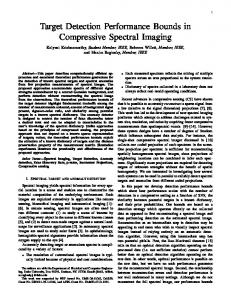
(a) 3D scene of interest
16
14
12 10 Downrange (ft)
8
6
(b) Typical B-scan image
Fig. 1. Experimental setup narios, we consider the scenario shown in Figure 1 (a) consisting of typical room items, such as a chair and a table as well as metal objects with strong reection properties. The wideband beamforming algorithm for TTW radar imaging presented in [6] is used to form the B-scan images (downrange vs. crossrange cut through the 3D scene of interest). For imaging, a 57 × 57 element planar array has been synthesized using a horn antenna. The scene is illuminated using a stepped-frequency continuous-wave signal with a bandwidth of 2.4 GHz. A concrete wall with thickness d = 5.625in and dielectric constant ! = 7.66 is used. A typical B-scan image resulting from the beamforming algorithm, obtained at the height of the table legs is shown in Figure 1 (b). The four table legs can be detected in the lower left quarter, as well as strong noise and clutter contributions all across the radar image. Given the location of the targets of interest, e.g. the region
,������
,*$566�����
0.2
0.4
p(B(i,j))
0.6
0.8
(a) Target distribution
1
0
0.2
0.4
p(B(i,j))
0.6
0.8
1
(b) Noise distribution Crossrange (ft)
Fig. 2. Pdf’s obtained at the table legs height of the four table legs in Figure 1 (b), the total set of image pixels can be divided into a target set T and a noise/clutter set N which can then be used to estimate the corresponding pdf’s. Typical examples of target and noise pdf’s are shown in Figure 2. The data used to estimate these pdf’s is obtained at the height of the table legs, corresponding to the radar image shown in Figure 1 (b). It can be seen that noise and clutter closely follow a Rayleigh distribution whereas samples corresponding to reections from targets can roughly be approximated by a Gaussian distribution. The solid curve in Figure 2 represents the tted pdf’s using the maximum likelihood estimates for the Gaussian and Rayleigh distribution. Further conducted experiments using different targets have shown that our assumption of Gaussian distributed targets and Rayleigh distributed noise/clutter is valid. Depending on the amount of clutter, the scale parameter of the Rayleigh distribution typically takes values 0.1 < σ0 < 0.2.
í6
í6
í4
í4
í2
í2
Crossrange (ft)
0
0
2
4
6 18
16
14 12 10 Downrange (ft)
8
6 18
6
Crossrange (ft)
(a) BW = 0.3GHz
16
14 12 10 Downrange (ft)
8
6
(b) BW = 0.6GHz í6
í4
í4
í2
í2
0
2
4
0
2
4
6 18
16
14 12 10 Downrange (ft)
8
6
(c) BW = 1.2GHz
6 18
16
14 12 10 Downrange (ft)
8
6
(d) BW = 2.4GHz
Fig. 3. Radar images obtained for different resolutions
σ ˆ0
0.3 GHz 0.20
Bandwidth 0.6 GHz 1.2 GHz 0.13 0.11
2.4 GHz 0.10
Table 1. Scale estimates for various bandwidths
4. HYPOTHESIS TESTS Based on our experimental results, we model respectively the null and alternative hypothesis pdf’s as p(B(i, j)|H0 ) = p(B(i, j)|H1 ) =
T
%
B(i, j) − B(i,j) 2 · e 2σ0 σ02
T
%
(B(i,j)−µ1 ) − 1 2σ2 1 √ ·e 2πσ1
2
& 2
&
where T (·) is an operation for truncation and normalization such that
k=1
increases with decreasing bandwidth. Herein, Nnoise is the total number of noise/clutter pixels and N (k) denotes the kth noise/clutter sample. It should be noted, that a large signal bandwidth has a similar effect on the noise parameter estimate
2
í6
3. EFFECT OF THE SYSTEM RESOLUTION Clearly, the distribution functions for target as well as for noise and clutter data are dependent on the system resolution, i.e. the number of array elements used or the bandwidth. Consider the setup shown in Figure 1 (a). A set of B-Scan images obtained at the height of the dihedral are shown in Figure 3 (a) - (d). Here, the signal bandwidth changes from 0.3 - 2.4 GHz. The dihedral image (indicated by a circle in the upper left quarter) becomes more blurred with signal reduced bandwidth. This blurring effect will generally yield larger detected targets which causes problems in the case of two targets close to each other. Then, a detector cannot distinguish between the two individual targets anymore. However, the blurring affects also noise samples. The effect of an increasing bandwidth to the scale parameter estimate of the Rayleigh distribution is summarized in Table 1. It can be seen that the scale estimate, which can be obtained by ! " N$ noise " 1 N 2 (k) (1) σ ˆ0 = # 2Nnoise
0
4
Crossrange (ft)
relative frequenies of occurence
relative frequencies of occurence
as a large array aperture. As will be shown later, the scale parameter σ0 is crucial for calculating the image threshold with the proposed detection scheme. Assuming a wrong σ0 may yield unsatisfactory detection results.
'
∞
−∞
p(ϕ|Hi )dϕ =
'
1
p(ϕ|Hi )dϕ = 1,
i = 0, 1
0
As both pdf’s for our experimental data have only little impact outside the interval [0, 1] one can also neglect the truncation
,������
operation, i.e. assuming
used to perform target detection for one single vantage point as follows: +2 * B(i, j) − µ LLR(i, j) = ln(λ) − ln(B(i, j)) − 2σ12 (5) 2 H1 B(i, j) + ≷ ln(γ) 2σ02 H0
2
p(B(i, j)|H0 ) =
B(i, j) − B(i,j) 2 · e 2σ0 σ02
p(B(i, j)|H1 ) =
√
2
(B(i,j)−µ1 ) − 1 2σ2 1 ·e 2πσ1
which yields simpler expressions for the detection formulae. Assuming all images from multiple views to be i.i.d., we obtain the likelihood ratio (LR) as
where M is the total number of radar images to be fused. The fused binary image can then be calculated as ) 1, LR(i, j) > γ F (i, j) = 0, LR(i, j) ≤ γ Using the Neyman-Pearson theorem [7], we obtain a constant false-alarm rate detector by evaluating ' ∞ fL (L|H0 )dL (2) α= γ
where α is the false-alarm rate and fL (L|H0 ) is the likelihood function under the null hypothesis. For i.i.d. images, γ is given by * +M p(β|H1 ) γ= (3) p(β|H0 ) where β - assuming noise and clutter to follow a nontruncated Rayleigh distribution - can be calculated as , −2ln(α) · σ02
2
λ= √
M ( p(Bm (i, j)|H1 ) H1 ≷ γ LR(i, j) = p(Bm (i, j)|H0 ) H0 m=1
β=
where
(4)
When using the truncated Rayleigh distribution, computationally more demanding optimization procedures have to be used to numerically solve for α and β. As demonstrated in the last Section, the scale parameter of the Rayleigh distribution, σ0 , is dependent on the system resolution, e.g. the available bandwidth. As can be seen in Equations (2), (3) and (4), σ0 affects the likelihood ratio threshold used to distinguish between the null and alternative hypothesis. A wrongly assumed σ0 will therefore yield an undesired actual false-alarm rate. 5. EXPERIMENTAL RESULTS The setup from Figure 1 is now used to obtain two TTW radar images at the table legs height, one from the front and one from the side wall. After performing a rotation operation to align the two sensor-specic coordinate systems, the detection scheme presented in Section 4 is used to perform image fusion with σ0 = 0.16. The log-likelihood ratio (LLR) test, which is easier for implementation issues compared to the likelihood ratio test, can be
2πσ1
-
σ02 (1 − e−1/2σ0 ) . .. − erf √−µ erf √1−µ 2σ 2σ 1
(6)
1
with erf(·) representing the error function. When access to two vantage points is possible, the log-likelihood ratio can be written as LLR(i, j) = 2 ln(λ) − ln(B1 (i, j) · B2 (i, j))− * +2 * +2 B1 (i, j) − µ B2 (i, j) − µ − 2σ12 2σ12 2 2 H1 B1 (i, j) + B2 (i, j) + ≷ 2 ln(γ) 2σ02 H0
(7)
where B1 (i, j) and B2 (i, j) denote the image from the front and side wall, respectively. In Figure 4 the receiver operating characteristics is shown when using the proposed detection scheme on the individual (M = 1) as well as on both (M = 2) radar images. It can be seen that the fusion of images from multiple locations improves the probability of detection given a constant falsealarm rate. In Figure 5 (d), we show the binary fused image F (i, j) for a false-alarm rate α = 1%. We observe an improvement compared to the results which we obtain when using the detection scheme only on one of the images - shown in Figure 5 (a) and (b) - and the simple pixel-wise multiplication of the two individual binary images shown in Figure 5 (c). In addition to the table legs height we demonstrate the performance of the proposed detector when moving to the dihedral height. Note that at this particular height, only one target is present, meaning that we only expect a small amount of clutter due to multipath propagation. Further, due to its shape, the dihedral has very good reection properties when imaging from the front wall and relatively bad reection properties when imaging from the side wall. The result of the proposed CFAR detector when applied to the front and side wall images separately is shown in Figure 6 (a) and (b). For this example a larger false-alarm rate (α = 0.05) has been chosen. This was necessary in order to detect the dihedral in the side wall image, where much less energy is reected compared to the front wall image. The fusion result by simple multiplication is shown in Figure 6 (c). As can be seen, the dihedral can not be detected anymore. The two target regions in the upper left quarter in Figures 6 (a) and (b) do not overlap. A simple multiplication will thus blank out the target. The fusion result when using the proposed CFAR detector is depicted in Figure 6 (d). One can observe that the dihedral is correctly detected. Furthermore, the speckles which appear in Figures 6 (a) and (b) are removed.
,������
í6
0.9
í4
í4
0.8
í2
í2
0.7
pD
0.6
Crossrange (ft)
í6
Crossrange (ft)
1
0
2
0
2
0.5 4
4
0.4 6 18
0.3 Frontwall only Sidewall only Both views
0.1 0 0
0.2
0.4
0.6
p
0.8
14 12 10 Downrange (ft)
8
(a) Front wall image
Crossrange (ft)
Fig. 4. Receiver operating characteristic
í4
í4
í2
í2
í6
í4
í4
í2
í2
0
2
Crossrange (ft)
Crossrange (ft)
6 18
0
2
6 18
6 18
8
6
í6
í6
í4
í4
í2
í2
2
4
6 18
14 12 10 Downrange (ft)
8
6
4
16
14 12 10 Downrange (ft)
8
6
6 18
16
14 12 10 Downrange (ft)
8
6
(d) LR test
7. REFERENCES 16
14 12 10 Downrange (ft)
8
6
0
2
6 18
[1] E. Baranoski, “Through wall imaging: Historical perspective and future directions,” in Proceedings of the 33rd IEEE International Conference on Acoustics, Speech and Signal Processing (ICASSP), Las Vegas, NV, USA, 2008. [2] D.D. Ferris and N.C. Currie, “A survey of current technologies for through-the-wall surveillance (TWS),” in Proceedings of the SPIE, San Diego, CA, USA, 1998, vol. 3577, pp. 62–72.
4
16
2
Fig. 6. Fusion results, Dihedral, α = 5%
(b) Side wall image
Crossrange (ft)
Crossrange (ft)
(a) Front wall image
0
6
2
4
14 12 10 Downrange (ft)
8
0
(c) Simple multiplication
0
4
16
14 12 10 Downrange (ft)
(b) Side wall image
í6
4 í6
16
1
FA
í6
6 18
6
Crossrange (ft)
0.2
16
16
(c) Simple multiplication
14 12 10 Downrange (ft)
8
6
(d) LR test
[3] F. Ahmad and M. G. Amin, “Wideband synthetic aperture imaging for urban sensing applications,” Journal of the Franklin Institute, July 2008, to appear. [4] F. Soldovieri, R. Solimene, and G. Prisco, “A multiarray tomographic approach for through-wall imaging,” IEEE Transactions on Geoscience and Remote Sensing, vol. 46, no. 4, pp. 1192–1199, 2008.
Fig. 5. Fusion results, Table legs, α = 1%
6. CONCLUSION A CFAR detector for use in Through-the-wall Radar Imaging has been presented. Experimental results have been used to decide for appropriate distribution functions to model target and noise/clutter data. The detector has been derived and applied for single- as well as multiple-view scenarios. The detection results show an improvement compared to image fusion by simple multiplication. Further, the effect of the system resolution on the parameters of the distribution functions used in the CFAR detector has been explored. It could be seen that the system resolution has a big effect on the detection scheme and should thus be incorporated for practical detectors.
[5] S. Papson and R. M. Narayanan, “Multiple location SAR/ISAR image fusion for enhanced characterization of targets,” in Proceedings of the SPIE, Volume 5788, pp. 128-139 (2005), Orlando, FL, USA, May 2005, vol. 5788, pp. 128–139. [6] F. Ahmad, M.G. Amin, and S.A. Kassam, “Throughthe-wall wideband synthetic aperture beamformer,” in Proc. IEEE Antennas and Propagation Society International Symposium, Monterey, CA, USA, 20–25 June 2004, vol. 3, pp. 3059–3062. [7] S. M. Kay, Fundamentals of Statistical Signal Processing, Volume 2: Detection Theory, Prentice Hall PTR, 1998.
,������