90nm CMOS technology with a nominal power supply of 1V. The. CGU unit consists of 1620 transistors in total. The design was laid out with a commercial ...
1.3
Technology Exploration for Adaptive Power and Frequency Scaling in 90nm CMOS Maurice Meijer, Francesco Pessolano, and José Pineda de Gyvez Philips Research Laboratories Eindhoven, The Netherlands
{maurice.meijer,francesco.pessolano,jose.pineda.de.gyvez}@philips.com of VDD and Vth scaling, besides power management in processors, are in testing [9], product binning [10], and yield tuning [11].
ABSTRACT In this paper we examine the expectations and limitations of design technologies such as adaptive voltage scaling (AVS) and adaptive body biasing (ABB) in a modern deep sub-micron process. To serve this purpose, a set of ring oscillators was fabricated in a 90nm triple-well CMOS technology. The analysis hereby presented is based on two ring oscillators running at 822MHz and 93MHz, respectively. Measurement results indicate that it is possible to reach 13.8x power savings by 3.4x frequency downscaling using AVS, ±11% power and ±8% frequency tuning at nominal conditions using ABB only, 22x power savings with 5x frequency downscaling by combining AVS and ABB, as well as 22x leakage reduction.
As the benefits of VDD and Vth scaling have already been proved, in this paper we concentrate on quantitative pointers for using such know-how in deep sub-micron technologies. In particular, we want to find what the expected power savings are, what power-delay tradeoffs can be made, understand present static and dynamic power consumption trends, and investigate how far can process-dependent performance spread be tuned. To give answers to the previous concerns, we have implemented a clock generator unit (CGU) consisting of seven ring oscillators in a triple well 90nm CMOS technology with a nominal power supply of 1V. The CGU unit consists of 1620 transistors in total. The design was laid out with a commercial place-and-route tool using constrained-area routing features. The ring oscillators use minimum sized inverters as delay elements, a 2-input NAND gate for enabling control, and a divide-by-2 circuit for duty cycle recovery. The ring oscillators have independent bias control over their PMOS and NMOS transistors by properly adjusting the N-well and P-well voltages, respectively. Measurements were performed using an Agilent 93K SoC test system in a controlled temperature (25degC) environment enabled by a Temptronic thermostream. The fastest measured oscillator has a frequency of 822MHz, while the slowest runs only at 93MHz. In the remainder of this paper, we will refer to the former ring oscillator as “ringo-1” and to the latter as “ringo-7”.
Categories and Subject Descriptors B.7.1 [Integrated Circuits]: Types and Design Styles – advanced technologies, algorithms implemented in hardware, VLSI (very large scale integration).
General Terms Measurement, Performance, Design.
Keywords CMOS, adaptive voltage scaling, adaptive body bias, performance optimization, low power, leakage.
freque ncy
1. INTRODUCTION In recent years the application of adaptive techniques to control either or both power supply (VDD) and threshold voltage (Vth) has gained increased attention. This stems from the fact that modern electronics are hampered by the variation of fundamental process and performance parameters such as threshold voltage and power consumption. Design technologies such as AMD’s PowerNow! [1], Transmeta’s LongRun [2], Intel’s Enhanced SpeedStep [3], to mention some instances, are vivid examples of commercial ICs that use power management based on power supply scaling. In addition to these commercial accomplishments, chip demonstrators with VDD and Vth scaling capabilities have also been reported in the literature archival [4]-[8]. Other reported uses
AVS min Vth
ABB
max Vdd
nom Vth
nom Vdd max Vt h
min Vdd
AVS+ABB power
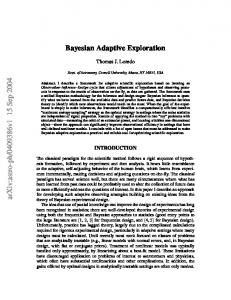
Figure 1. Power supply and body bias scaling. Section 2 introduces the voltage conventions we used for AVS and ABB. In section 3 we will focus on frequency scaling as well as frequency tuning. Section 4 presents current trends of both static and dynamic power consumption; section 5 deals with the use of AVS and ABB for reduction of power demand. Section 6 explores the potential of AVS and ABB for online performance compensation.
Permission to make digital or hard copies of all or part of this work for personal or classroom use is granted without fee provided that copies are not made or distributed for profit or commercial advantage and that copies bear this notice and the full citation on the first page. To copy otherwise, or republish, to post on servers or to redistribute to lists, requires prior specific permission and/or a fee. ISLPED’04, August 9–11, 2004, Newport Beach, California, USA. Copyright 2004 ACM 1-58113-929-2/04/0008…$5.00.
14 Proceedings of the 2004 International Symposium on Low Power Electronics and Design (ISLPED’04) 1-58113-929-2/04 $ 20.00 ACM
2. SCALING OPERATIONS
Frequency [Hz]
max Vth
Description
Variable
Adaptive Voltage Scaling
VDD
[0.5,1.0]V
ABB
Adaptive Body Biasing
Vnwell Vpwell
[VDD-0.5,VDD+1.0]V [-1.0,0.5]V
AVS+ABB
Adaptive Voltage and Body Biasing
VDD Vnwell Vpwell
[0.5,1.0]V [VDD-0.5,VDD+1.0]V [-1.0,0.5]V
min Vth max Vth
10.0E+6 0.4
AVS
0.5
0.6
0.7
0.8
0.9
1.0
1.1
Supply voltage [V]
Figure 2. Frequency scaling and tuning for ringo-1 (upper curve) and ringo-7 (lower curve). The contour plot in Figure 3 displays the range for frequency tuning when using ABB at VDD = 1V. The horizontal and vertical axes show the N-well and P-well voltage bias, respectively. The upper left corner shows the highest frequency, and the frequency bands are spaced at 10MHz intervals. For the measured silicon, ABB gives an absolute tuning range of 131MHz for the chosen well voltages. Observe also that it is possible to change the Vth of the PMOS and NMOS transistors independently and still attain the same frequency. Obviously, the choice of Vth has a significant impact on static power consumption as we will show later in section 4.
Range
AVS
AVS+ABB 100.0E+6
ABB
Table 1. Voltage conventions for scaling operations Ope ration
min Vth
1.0E+9
We will now briefly introduce the adaptive voltage scaling (AVS) and the adaptive body bias (ABB) schemes. Figure 1 shows a graph of frequency vs. power as a function of either or both AVS and ABB. The thick line shows the nominal trend as VDD is varied from its maximum to its minimum value. An AVS operation consists in sweeping the power supply while maintaining the body bias constant. ABB is essentially the contrary approach: VDD is kept constant and the body bias is swept. Here, it holds that frequency and power have an almost linear negative dependence on the threshold voltage. The result is a “cloud” of frequencypower points at a given VDD operating point. Finally, AVS+ABB is the case when both body biasing and power supply are swept. Table 1 presents the voltage ranges we have employed during our measurements. Observe that the wells were forward biased for at most 0.5V and reverse biased by 1V, independently of the power supply value. Forward biasing is constrained by the turn-on voltage of the transistors’ body-to-source junction diode. Essentially, reverse biasing is unconstrained, but for high reverse biasing voltages it results in increased (junction) leakage. We will now illustrate how these techniques can be used to alter the performance of integrated circuits. For this purpose, we have focused our attention on ringo-1 and ringo-7. Observe that in the next sections we will use the term ringo to refer to any of the two ring oscillators when not differently stated.
Highest frequency 883 MHz.
0.5
0.2
nominal -0.1
Vpwell [V]
-0.4
3. FREQUENCY SCALING AND TUNING Let us first investigate the dynamic range of the ring oscillators. To a first order approximation the frequency can be calculated as f | P.VDD-1(VDD – Vth)Dҏ [12], where f is the operating frequency, K is a proportionality factor, P is the carrier mobility and D is a process dependent parameter that takes into account velocity saturation. In the case of velocity saturated devices, D is close to 1. Because of the low D factor, it follows then that frequency scales almost linearly with VDD. Figure 2 shows the ringo frequency as function of power supply. Observe that the frequency increases by 3.4x when VDD is scaled up from 0.5V to 1V.
-0.7
-1 0.5
0.8
Vnwell [V]
1.1
1.4
1.7
2
Lowest frequency 761MHz.
Figure 3. Contour plot of frequency vs. well bias. In general, the ringo-1 and ringo-7 show the same frequency scaling and tuning trend, except of course for absolute differences.
We can now analyze the impact of ABB as a frequency tuning mechanism at each VDD point. Notice from Figure 2 that the relative tuning range is not the same for all VDD values. In particular, we measured frequency spans of approximately ±14% at VDD= 0.5V and ±8% at VDD=1V w.r.t. their nominal frequencies. This unbalance is because the effective gate drive of the transistors is smaller at low VDD values.
Figure 4 shows measurement results of the ringo frequency as a function of temperature and power supply. The relative temperature dependence at VDD = 1V and nominal body bias is about -1.2%/qC. When VDD > 0.6V, the frequency decreases linearly as temperature increases, but when VDD < 0.6V, the frequency increases linearly as temperature increases. To understand the varying frequency behavior as a function of
15 Proceedings of the 2004 International Symposium on Low Power Electronics and Design (ISLPED’04) 1-58113-929-2/04 $ 20.00 ACM
dynamic to static power consumption, and a ratio of 1.3 when ABB is used in reverse bias.
temperature, recall that frequency is dependent on the transistor’s threshold voltage Vth and carrier mobility P. To a first order approximation [13][14] this dependence can be expressed as
1.6E-3
where F is a constant, P(T0) is the carrier mobility at a reference temperature T0 and b is a constant. In turn, Vth decreases with temperature, while P is inversely related to temperature. When VDD > 0.6V, the carrier mobility is the dominant parameter. However, observe that both parameters, Vth and P, balance out each other at VDD = 0.6V as the frequency remains more or less constant, i.e. it is independent of temperature. For VDD < 0.6V, Vth becomes a dominant factor and frequency increases for increasing temperatures.
1.4E-3 1.2E-3 1.0E-3
ti P sta
800.0E-6 600.0E-6
=
P dy
c mi na
c
VDD = 1V
400.0E-6 0.5V
200.0E-6
0.6V
0.9V
0.8V
0.7V
1. 6E -3 1. 8E -3
00 0. 0E +0 20 0. 0E -6 40 0. 0E -6 60 0. 0E -6 80 0. 0E -6 1. 0E -3
000.0E+0
1. 2E -3 1. 4E -3
§T · P �T P �T0 ¨¨ ¸¸ © T0 ¹
�F
CGU Static Power [W]
dVth dT
1.8E-3
�b
Dynamic Ringo Power [W] 120.0E+6
Ringo7
Figure 5. Static vs. dynamic power of ringo-1.
VDD = 1V
80.0E+6 60.0E+6
VDD = 0.9V
450.0E-6
VDD = 0.8V
400.0E-6 CGU Static Power [W]
Frequency [Hz]
100.0E+6
VDD = 0.7V VDD = 0.6V
40.0E+6 VDD = 0.5V
20.0E+6 000.0E+0 -50
-25
0
25
50
75
100
125
150
Temperature [degC]
VDD = 1V
350.0E-6 0.9V
300.0E-6 250.0E-6
0.8V
200.0E-6 0.7V
150.0E-6 0.6V 100.0E-6 0.5V 50.0E-6
=
P sta
c mi na y Pd
tic
0 50 .0 E6 10 0. 0E -6 15 0. 0E -6 20 0. 0E -6 25 0. 0E -6 30 0. 0E -6 35 0. 0E -6 40 0. 0E -6 45 0. 0E -6
000.0E+0
00 0. 0E +
Figure 4. Frequency vs. temperature of ringo-7.
Dynamic Ringo Power [W]
4. POWER TRENDS
Figure 6. Static vs. dynamic power of ringo-7.
Often enough it has been predicted that static power consumption will reach levels comparable to dynamic power consumption. We will now investigate this hypothesis under AVS and ABB. In our experiments static power consumption takes into account all sources of leakage, e.g. subthreshold leakage, gate leakage, etc. The measurements of static power consumption were done with the ring oscillators stopped for the entire CGU unit. Power trends of ringo-1 are shown in Figure 5 in which the CGU static and ringo-1 dynamic power consumption are plotted against each other. Each “cloud” is associated to a unique VDD value, and each dot in the cloud corresponds in turn to a unique N-well and P-well bias combination, e.g. as previously displayed in Figure 3. This body bias combination is the same from cloud to cloud. The line joining clouds shows the nominal trend. Without loss of generality, we observed that at VDD = 1V, and when nominal body bias is applied, the dynamic power consumption is approximately 7x the CGU-static power consumption. When forward body bias is applied, the ratio of dynamic to static power consumption is reduced to 4.3, while for the case of reverse body bias it is increased to 8.2. In contrast to the previous results are the ones of ringo-7 (Figure 6). This being a low-frequency ringo, we see that CGU-static and dynamic ringo-7 power consumption are almost equal. ABB with forward bias yields a ratio of 0.7 for
When comparing power values of ringo-1 and ringo-7, one can see that the CGU-static power consumption at nominal VDD is approximately the same whether the ringo oscillates at a high or low frequency. Notice however, that if ringo-1 is operated at VDD = 0.5V, its running frequency is around 100MHz, close enough to the nominal frequency of ringo-7, but its power consumption is about 7x lower than the one of ringo-7. This shows the advantageous impact of using AVS. Leakage power is one of the main concerns in deep sub-micron technologies. In fact, AVS and ABB are often used for leakage reduction purposes. Figure 7 shows the impact of AVS and ABB on the leakage current for our CGU. The plot shows measurements of leakage current as a function of power supply. For the measured silicon, leakage reduces by 5x when VDD is scaled down from 1V to 0.5V. When using ABB alone at VDD = 1V, leakage decreases only by 1.2x. This low impact of ABB is probably because of a high level of gate leakage. On the other hand, the combination of AVS with ABB renders a leakage reduction of 22x. Notice that, while the exact numbers may not be characteristic given the maturity level of the technology, it is clear that ABB alone has only a small impact on leakage reduction.
16 Proceedings of the 2004 International Symposium on Low Power Electronics and Design (ISLPED’04) 1-58113-929-2/04 $ 20.00 ACM
This is essentially due to the impact that both forward and reverse ABB have on leakage current levels.
400.0E-6
min Vth 300.0E-6
ABB AVS+ABB
250.0E-6 200.0E-6 150.0E-6 100.0E-6
max Vth
50.0E-6 000.0E+0
0.4
0.5
0.6
0.7 0.8 0.9 Supply voltage [V]
1.0
1.8E-3
450.0E-6
1.6E-3
400.0E-6
1.4E-3
350.0E-6
1.2E-3
300.0E-6
1.0E-3
250.0E-6
800.0E-6
200.0E-6
600.0E-6
150.0E-6
400.0E-6
100.0E-6
200.0E-6
50.0E-6
CGU Static Power [W]
AVS 350.0E-6
Dynamic Power [W]
CGU Off-state Leakage [A]
450.0E-6
1.1 000.0E+0 000E+0
Figure 7. Leakage reduction trends.
200E+6
400E+6
600E+6
000.0E+0 1E+9
800E+6
Frequency [Hz]
5. POWER AND FREQUENCY TUNING
Figure 9. Static and dynamic power vs. frequency.
The ultimate goal of the AVS and ABB schemes is performance tuning with performance being the optimal combination of frequency and power, i.e. the lowest power for a fixed frequency. Figure 8 presents a plot of frequency as function of the total power, e.g. both CGU-static and dynamic power consumption of ringo-1. In this plot we have used the same conventions as before, i.e. each cloud is associated to a unique VDD value, each dot in a cloud corresponds to a unique N-well and P-well combination, and the line joining clouds indicates the nominal trend.
900.0E+6
Frequency [Hz]
The plot of Figure 8 puts us in state to evaluate power savings and tuning range control of AVS and ABB. Measurement results of ringo-1 indicate a 13.8x power savings by 3.4x frequency downscaling using AVS over half of the entire VDD range. The use of ABB at VDD = 1V results in ±11% power and ±8% frequency tuning w.r.t the nominal operating point. The combination of AVS and ABB yields 22x power savings with 5x frequency scaling from the highest possible frequency (minimum Vth) to the lowest one (maximum Vth). These results show the strength of the combined use of AVS and ABB. 1.0E+9
Frequency [Hz]
600.0E+6 0
400.0E+6
A
300.0E+6
BB +A S V
AVS VDD =0.5V
500.00E -6
1.00E-3
1.50E-3
2.00E-3
0.002
0.0025
Figure 11 puts in perspective both the ring oscillators. The left axis shows the frequency of ringo-7, the right axis is associated to ringo-1, and the horizontal axis shows the total power consumption. The plot also shows two arrows labeled as “A” and “B”, respectively. Arrow “A” indicates a constant power trend. It basically indicates that for the same power figure, ringo-1 runs still 5x faster than ringo-7. Arrow “B” indicates that for the same speed (actually ringo-1 runs at 10% higher speed than ringo-7) ringo-1 consumes 7x less power. The implication of this latter observation can be quite significant. Is it possible, for instance, to
000.0E+0
000.00E+0
0.0015
Let us now explore possible performance tradeoffs by using AVS and ABB. Figure 10 shows a zoom-in of Figure 8 at VDD =1V. If AVS and ABB are applied such that the nominal VDD becomes 0.9V instead of 1V, and the Vth’s are pulled to their minimum value as indicated by the arrow in Figure 10, we see that it is possible to achieve a 19% power savings w.r.t. the nominal conditions at a penalty of only 4% in frequency reduction. A more aggressive VDD downscaling to 0.8V results in 45% power savings at 19% frequency penalty. It is clear, thus, that AVS+ABB can lead to significant power savings without serious performance penalty.
200.0E+6 100.0E+6
0.001
Figure 10. Frequency vs. total power tradeoff.
VDD = 0.7V VDD = 0.6V
0.0005
Total Power [W]
700.0E+6
500.0E+6
750.0E+6
VDD=0.8V
V DD = 0.8V
600.0E+6
VDD=0.9V
650.0E+6
ABB
VDD = 0.9V
800.0E+6
800.0E+6
700.0E+6
V DD = 1V
900.0E+6
VDD=1V
850.0E+6
2.50E-3
Total Power [W]
Figure 8. Frequency vs. total power. For the sake of completeness, Figure 9 shows a plot of both CGUstatic and dynamic ringo-power consumption against frequency. Worth seeing here is the spread of the static power consumption.
17 Proceedings of the 2004 International Symposium on Low Power Electronics and Design (ISLPED’04) 1-58113-929-2/04 $ 20.00 ACM
improvement. Let us investigate now up to what extent the frequency spread can be compensated. Figure 13 shows a frequency correlation between sample “fast” and sample “typical”. Each cloud is associated to a unique VDD value and each point in the cloud corresponds to a unique N-well and P-well bias combination.
synthesize a circuit for a higher speed and then through AVS reduce the power supply to reach the target speed with the additional benefit of significant power reduction? 1.0E+9
120.0E+6 100.0E+6
800.0E+6
60.0E+6 400.0E+6 40.0E+6
50
0E 0.
000.0E+0
-6 0 1.
3 E-
5 1.
3 E-
0 2.
3 E-
5 2.
400.0E+6 300.0E+6
VDD = 0.6V VDD =0.5V
000.0E+0
00 0. 0E +0 10 0. 0E +6 20 0. 0E +6 30 0. 0E +6 40 0. 0E +6 50 0. 0E +6 60 0. 0E +6 70 0. 0E +6 80 0. 0E +6 90 0. 0E +6 1. 0E +9 TYPICAL CORNER
Typical ringo [Hz]
Figure 13. Frequency correlation between "fast" and "typical" ringos.
6. PERFORMANCE COMPENSATION As the variation of fundamental parameters such as channel length, threshold voltage, thin oxide thickness and interconnect dimensions goes well beyond acceptable limits, “on the fly” performance compensation is becoming necessary. While process spreads are tightly controlled, their impact on circuit design and behavior is higher and higher. For instance, while before a Vth variation of say 50mV on a nominal Vth of 450mV was not that crucial, in deep sub-micron technologies with a nominal Vth of 250mV this variation can make circuit operation quite difficult.
Observe that the frequencies of both axes are different, e.g. the clouds lie above the 45-degree line. What is notorious from this plot is the fact that it is possible to tune the “fast” sample to the “typical” one by using AVS and ABB. Notice also that the tuning is continuous for all frequencies. Namely, when both AVS and ABB are used, the frequency range of the “fast” ringo is 170MHz < ffast < 892MHz while the one of the “typical” ringo is 85MHz < ftypical < 815MHz. 900.0E+6
1.2E+9
Ringo1 from multiple die samples
850.0E+6
Fast ringo [Hz] FAST CORNER
ABB
800.0E+6 600.0E+6 400.0E+6
800.0E+6 750.0E+6 700.0E+6 650.0E+6 600.0E+6
200.0E+6
550.0E+6
0.8
0.85
0.9
0.95
1
500.0E+6 50 0. 0E +6
Supply voltage [V]
Figure 12. Frequency spread and performance tuning.
90 0. 0E +6
0.75
85 0. 0E +6
0.7
80 0. 0E +6
0.65
75 0. 0E +6
0.6
70 0. 0E +6
0.55
65 0. 0E +6
Frequency [Hz]
ABB
VDD = 0.7V
500.0E+6
100.0E+6
Figure 11. Frequency vs. total power of both ringo-1 and ringo-7.
000.0E+0 0.5
VDD = 0.8V
600.0E+6
200.0E+6
3 E-
Total Power[W]
1.0E+9
VDD = 0.9V
700.0E+6
60 0. 0E +6
000.0E+0 0 E+ .0 0 00
200.0E+6
A
B
VDD = 1V
AVS
800.0E+6
55 0. 0E +6
20.0E+6
900.0E+6
Fast ringo [Hz]
600.0E+6
Ringo-1 [Hz]
Ringo-7 [Hz]
1.0E+9
80.0E+6
TYPICAL CORNER Typical ringo [Hz]
Figure 14. “Fast” to “typical” ringo performance compensation.
Figure 12 shows an example of performance spread in which frequency is plotted against power supply for eleven different samples. Additionally, frequency tuning using ABB for three selected samples is shown as well. Samples were selected as “fast”, “typical” and “slow” with nominal frequencies of 822MHz, 713MHz, and 640MHz, respectively. The total frequency spread of the limited sample set of ringo-1 is 180MHz. Despite this spread, it is possible to tune its frequency to the “typical” ringo. This gives basically a 100% parametric yield
As an example we use AVS and ABB to lower the nominal frequency of the “fast” sample to the one of the “typical” sample as indicated by the arrow in Figure 14. The nominal VDD of the “fast” sample becomes 0.9V instead of 1V, while several combinations of Vth’s can provide the required frequency of 713 MHz.
18 Proceedings of the 2004 International Symposium on Low Power Electronics and Design (ISLPED’04) 1-58113-929-2/04 $ 20.00 ACM
for low-power high-speed CMOS digital design”, IEEE Journal of Solid-State Circuits, March 1998, Vol.33, No.3, p. 454-462
7. CONCLUSIONS We presented measurement results that show the extent to which adaptive power supply and adaptive body bias are useful in a state-of-the-art CMOS technology. Although the results were obtained from this particular 90nm CMOS technology, they are well suited as indices for reference purposes. This paper shows that AVS renders a wide frequency-scaling control and significant power savings. The index factors are ~14x power savings by ~3x frequency downscaling. While the frequency and power tuning range of ABB may look limited (index factors ±11% power and ±8% frequency tuning @ VDD = 1V), the frequency tuning range proves to be effective for process-dependent performance compensation. In fact, we observed a continuous frequency tuning despite the wide frequency spread. With AVS and ABB together it is possible to attain 22x power savings with 5x frequency downscaling. These indices show that the combined use of AVS and ABB offers significant performance control. Contrary to the belief that high Vth has a considerable impact on leakage power reduction, we showed that reverse-bias ABB alone reduces leakage only by 1.2x. However, the combination of AVS and ABB yields an index factor of ~22x leakage reduction. More work is needed to qualify this design technology in deep sub micrometer technologies, e.g. to assess the implications of VDD and Vth scaling on circuit activity, noise margins, power supply noise among other parameters. While the work hereby presented relates to ring oscillator measurements, it is a first step towards understanding the limitations of power and frequency scaling given the constraints imposed by the semiconductor process.
We would like to thank Rutger van Veen, Bram Kruseman, Dick Heslinga, and Atul Katoch who helped us through various phases of this investigation.
[2]
M. Fleishman, “Longrun power management; Dynamic power management for Crusoe processor”, Transmeta white paper, January 2001, http://www.transmeta.com
[3]
S. Gochman., R. Ronen, I. Anati, A. Berkovits, T. Kurts, A. Naveh, A. Saeed, Z. Sperber and R. Valentine, “The Intel Pentium M processors: microarchitecture and performance”, Intel Technology Journal, May 2003, Vol.7, Issue 2, p. 2236
[4]
[6]
V. Gutnik and A. Chandrakasan, “Embedded power supply for low-power DSP”, IEEE Transactions on Very Large Scale Integration (VLSI) Systems, December 1997, Vol.5, No.4, p.425-435
[7]
G. Wei and M. Horowitz, “A fully digital, energy-efficient adaptive power-supply regulator”, IEEE Journal of SolidState Circuits, April 1999, Vol.34, No.4, p. 520-528
[8]
N. Dragone, A. Aggarwal and L. Carley, “An adaptive onchip voltage regulation technique for low-power applications”, Proc. of International Symposium on Low Power Electronic Design, July 2000, p. 20-24
[9]
T. Miyake, T. Yamashita, N. Asari, H. Sekisaka, T. Sakai, K. Matsuura, A. Wakahara, H. Takahashi, T. Hiyama, K. Miyamoto, and K. Mori, “Design Methodology of High Performance Microprocessor using Ultra-Low Threshold Voltage CMOS”, Proc. of IEEE Custom Integrated Circuits Conference, 2001, p. 275-278
[11] T. Chen and S. Naffziger, “Comparison of Adaptive Body Bias (ABB) and Adaptive Supply Voltage (ASV) for Improving Delay and Leakage Under the Presence of Process Variation”, IEEE Transactions on VLSI Systems, October 2003, Vol. 11, No. 5, p. 888-899
9. REFERENCES AMD PowerNOW! Technology, AMD white paper, November 2000, http://www.amd.com
K. Nowka, G. Carpenter, E. MacDonald, H. Ngo, B. Brock, K. Ishii, T. Nguyen and J. Burns, “A 32-bit PowerPC system-on-a-chip with support for dynamic voltage scaling and dynamic frequency scaling”, IEEE Journal of SolidState Circuits, November 2002, Vol.37, No.11, p. 14411447
[10] J. Tschanz, J. Kao, S. Narendra, R. Nair, D. Antoniadis, A. Chandrakasan, and Vivek De, “Adaptive body bias for reducing impacts of die-to-die and within-die parameter variations on microprocessor frequency and leakage”, IEEE Solid-State Circuits Conference, February 2002, Vol.1, p. 422-478
8. ACKNOWLEDGMENTS
[1]
[5]
[12] T. Sakurai and R. Newton, “Alpha-Power Law MOSFET Model and its Applications to CMOS Inverter Delay and Other Formulas”, IEEE Journal of Solid-State Circuits, April 1990, Vol.25, No.2, p. 584-593 [13] Y. Tsividis, “Operation and Modelling of the MOS Transistor”, New York: McGraw-Hill, 1987 [14] K. Laker and W. Sansen, “Design of Analog Integrated
Circuits and Systems”, New York: McGraw-Hill, 1994
T. Kuroda, K. Suzuki, S. Mita, T. Fujita, F. Yamane, F. Sano, A. Chiba, Y. Watanabe, K. Matsuda, T. Maeda, T. Sakurai and T. Furuyama, “Variable supply-voltage scheme
19 Proceedings of the 2004 International Symposium on Low Power Electronics and Design (ISLPED’04) 1-58113-929-2/04 $ 20.00 ACM