IEEE TRANSACTIONS ON COMPONENTS AND PACKAGING TECHNOLOGIES, VOL. 29, NO. 2, JUNE 2006
333
Temperature, Humidity and Pressure Measurement on Automotive Connectors Yu-Zhi (Liza) Lam, Christian Maul, and John W. McBride
Abstract—Environmental testing under laboratory-controlled conditions has long been used to evaluate connector performance prior to practical application. There are a number of experimental procedures frequently used in the automotive industry such as the USCAR standard for automotive electrical connector systems to test connectors. However, recent research has shown that these tests appear to evaluate the mechanical stability of the connector housings and terminals, rather than their electrical performance. In order to establish more representative tests to evaluate the electrical performance of contacts, the actual environmental conditions at the contact interface, which are generally unknown, must be measured. This paper compares the temperature, humidity, and air pressure inside the connector housing to those measured outside. It was found that the conditions inside and outside the connector housing are different and a model relating the conditions is introduced. Index Terms—Connector environment, environmental testing, humidity, pressure, temperature.
I. INTRODUCTION
E
LECTRICAL connectors allow components to be installed and maintained individually in an electrical system. With them, it is possible to replace defective units, provide system flexibility as well as low cost installation and inspection. Automotive connectors operate under circumstances that are given by the automotive environment. The harsh conditions surrounding the connectors often render them as weak links in the reliability chain within the electrical system. High levels of vibration, humidity, and temperature including rapid change in temperature lead to deterioration of the connector. Swingler et al. [1] divide the stresses on connectors into two main groups based on their origins. The first group consists of external stresses caused by “the world” in general while the second group deals with internal stresses that are created by the car itself. In general, the types of stresses include temperature, thermal shock, humidity, water and gaseous pollutants, vibration, and mechanical shocks. Much work [2] has been carried out to enhance the reliability of electrical connectors in automotive systems when subjected to ranges of operating environments in the automotive life cycle Manuscript received November 1, 2004. This work was supported through the European Commission “Growth” Programme, Research Project AUTOCON: “Investigations into integrated wiring and interconnecting of electrical and electronic components for intelligent systems,” under Contract GIRD-CT01-00588. This work was recommended for publication by Associate Editor M. Braunovic upon evaluation of the reviewers’ comments. Y.-Z. Lam and J. W. McBride are with the School of Engineering Sciences, University of Southampton, Southampton S017 1BJ, U.K. (e-mail:
[email protected]). C. Maul is with TaiCaan Technologies Ltd., Southampton S016 7NP, U.K. Digital Object Identifier 10.1109/TCAPT.2006.875896
from manufacture to operation. Some of these tests have been standardized [3]. However, depending on the test conditions, the information could be considered unrepresentative [4]. Most environmental monitoring has been carried out near the connector housing. However, it would be more appropriate to measure inside the connectors where the contact interfaces are located [2], [5]. At the interface, these environmental influences would be the key effects in determining the stability and contact resistance failure criteria for electrical systems [6]. It is important to maintain or improve connector reliability throughout its operational life. However, the issue of connector reliability has been threatened by degradation processes such as fretting corrosion. This phenomenon occurs due to the effects of thermal cycling and vibration induced micro-movement. In thermal cycling, the mechanism of fretting corrosion was mainly attributed to the differential thermal expansion of connector components [7]. On the other hand, the study on vibration induced fretting showed that the threshold vibration levels and the rate of fretting corrosion at the contact interface were influenced by various parameters namely vibration amplitude, frequency, wire tie-off length, connector design and contact interface lubrication [8]. Using some of these parameters, a model was also established and generalized to relate with fretting degradation rate at low frequencies. The relative humidity at the contact interface also has a significant influence on corrosion; above a relative humidity of 50%–60%, the corrosion rate sharply increases [9]. Placing these focuses toward practical situations, Malucci et al. [10] carried out field studies for automotive applications to determine thermal stress levels inflicted by real world environmental situations. They have shown that current thermal cycle test was adequate to evaluate the connectors however there were significant levels of uncertainty associated with it. In other words, this type of accelerated test may create the potential of artificially exceeding the fretting threshold for a given design. The objective of this paper is to relate the temperature, humidity and air pressure inside the housing to the corresponding conditions outside the connector housing. This paper presents the experimental and analytical results of three different environmental stress parameters, namely temperature, humidity and air pressure inside and outside the connector housing. Connectors underwent continuous monitoring and the differences in terms of delay times and absolute magnitudes in the transient and steady state responses, respectively, were compared. II. EXPERIMENTAL DETAILS For all experiments, plastic connector housings, each accommodating six connectors with multicored cables were used. The housing is made of semi-crystalline, thermoplastic saturated
1521-3331/$20.00 © 2006 IEEE
Authorized licensed use limited to: UNIVERSITY OF SOUTHAMPTON. Downloaded on June 15, 2009 at 07:34 from IEEE Xplore. Restrictions apply.
334
IEEE TRANSACTIONS ON COMPONENTS AND PACKAGING TECHNOLOGIES, VOL. 29, NO. 2, JUNE 2006
Fig. 1. Representations of connector housings of (a) sealed and (b) unsealed configurations.
Fig. 3. Thermocouple and humidity sensor (inside connector housing).
Fig. 2. Temperature profile of climate chamber.
polyester filled with 10% glass fiber. The interior of the housing has rubber-like sealing features and each insulated cable has a polymer ring used to seal the individual insertion entrance. The samples were placed and tested in a temperature chamber (Climatic testing cabinets, series SB, System Weiss) where the temperature and humidity profiles could be programmed. Measurements were acquired by a data logging system consisted of a laptop with a data acquisition card (National Instruments). This acquisition system accommodated eight different analogue input channels that allowed signals to be sampled simultaneously. A LABVIEW software program was written to automate the procedure so that experiments could be carried out effectively over long periods of time. A. Temperature External sources such as climatic influences could have ranges averaged between 45 C to 45 C [11]. On the other hand, the vehicle itself could produce temperatures up to several hundreds degree centigrade, especially near the exhaust system. The effect of elevated temperatures on contact performance could lead to variation in the rate of chemical processes such as corrosion and physical processes like stress relaxation. Rapid changes in temperature could be caused by several situations. For example, temperature experienced by the connector could vary when it was subjected to normal warming up periods and subsequently be cooled directly by water splashes. Under the influence of changing temperature the connector housing will contract and expand and the terminals are likely to move relative to each other, possibly leading to fretting. The standard USCAR specifications for automotive electrical connection systems [12] were used as a guide for designing the experimental procedures within this investigation. Two sets of connectors, one attached to sealed (with silicon rubber gel) cables and the other attached to unsealed cables (as shown in Fig. 1) were subjected to a series of thermal shock cycles. Each cycle followed the temperature profile as illustrated in Fig. 2. This thermal cycle was carried out for four cycles.
In order to measure the on-going changes in temperature inside and outside of the connector housing, PTFE-insulated K type thermocouples (LABFACILITY) were employed. The miniaturized thermoelement measuring approximately 0.5 mm by 0.5 mm is suitable to be inserted into the connector housing as shown in Fig. 3. The voltage output of the thermocouple was connected to a monolithic thermocouple amplifier with cold junction compensation (Analog Devices) to perform signal conditioning and linearization prior to data acquisition. The outside temperature was measured by a similar thermocouple setup placed close to the outside of the housing. B. Humidity Water and water vapor residing on contact surfaces could lead to increased galvanic corrosion [13]. Humidity level is an important parameter that can affect the electrical performance of the contact. It is expressed either as absolute or relative humidity. Absolute humidity (AH) is defined as the mass of water vapor divided by the mass of dry air in a volume of air. Relative humidity (RH) is the ratio of the actual vapor density and the highest possible saturated vapor density. It is strongly dependent on the air temperature. The warmer the air is, the more water it can contain. Often, RH levels are also denoted by percentage relative humidity (%RH). Several experiments were carried out for the humidity measurements. First, the sealed and unsealed connector housings were subjected to a similar temperature profile as described in Fig. 2. However, the maximum and minimum temperatures of the profile were set to 90 C and 15 C, respectively, due to limitations of the climate chamber with humidity control. The chamber was initially programmed at a constant 20% RH level throughout four thermal shock cycles. Upon completion, the RH level was changed to 90% and the experiment repeated for four thermal shock cycles. These values were adopted with reference to the USCAR standards. The same samples were then subjected to tests employing varying humidity levels at constant temperature. The %RH profile as shown in Fig. 4 was programmed into the climate chamber and the temperature was set at 25 C. The %RH levels inside and outside the connector housing were measured by solid-state humidity/moisture sensors (HIH-
Authorized licensed use limited to: UNIVERSITY OF SOUTHAMPTON. Downloaded on June 15, 2009 at 07:34 from IEEE Xplore. Restrictions apply.
LAM et al.: TEMPERATURE, HUMIDITY AND PRESSURE MEASUREMENT ON AUTOMOTIVE CONNECTORS
335
Fig. 4. Relative humidity profile for the climate chamber.
3610) from Honeywell. This capacitive-based sensor was selected for this application due to its compactness. This feature allowed the sensor to be inserted into the connector housing as shown in Fig. 3. The output voltages of the sensor are linearly proportional to the %RH levels. With the measured %RH levels and corresponding temperature, AH levels can be obtained using (1) [14], where is the temperature in C
Fig. 5. Pressure sensor attached to connector housing.
(1)
C. Air Pressure The introduction of waterproof or well-sealed connector designs has led to concerns about the influence of pressure build-up within the connector housing on fretting. With a change of temperature and therefore air pressure inside the connector, there could be micromovement at the contact interface, hence promoting the occurrence of fretting. This in turn would affect the durability and reliability of the connector. According to the ideal gas law and kinetic theory [15], the air pressure within a fixed enclosed space of volume is directly proportional to temperature as denoted in
Fig. 6.
Temperature profiles for connector housing with sealed cables.
(2) where is the universal gas constant 8.3145 J/mol K, is the number of gas molecules and is temperature in Kelvin. The experiments for air pressure measurements were carried out in the climate chamber using sealed and unsealed connector housings under the influences of the temperature profile given in Fig. 2. A piezoresistive pressure sensor measuring absolute pressure with reference to vacuum (Motorola) was attached to the housing via a protruding port as shown in Fig. 5. An identical sensor was placed outside the connector to measure the environmental pressure. The protruding port of the pressure sensor has a diameter similar to that of the cable and the seal that is used to seal the cable exit is also used to seal the connection between the connector housing and the pressure sensor. III. RESULTS AND DISCUSSIONS A. Temperature 1) Experimental Results: Figs. 6 and 7 show the temperature profiles measured inside and outside the housing with connector cables sealed with silicon rubber and unsealed, respectively.
Fig. 7. Temperature profiles for connector housing with unsealed cables.
The results obtained from the four recurring cycles indicate good repeatability, hence only the measurements of a single cycle are shown. The time of 20 mins required for the change of temperature from 5 C to 90 C and vice versa was the shortest possible period achievable by the climate chamber. The heating rate was found to be slightly faster than the cooling rate. As can be expected, the temperature inside the connector follows the temperature outside the connector with a time delay.
Authorized licensed use limited to: UNIVERSITY OF SOUTHAMPTON. Downloaded on June 15, 2009 at 07:34 from IEEE Xplore. Restrictions apply.
336
IEEE TRANSACTIONS ON COMPONENTS AND PACKAGING TECHNOLOGIES, VOL. 29, NO. 2, JUNE 2006
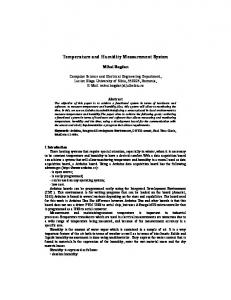
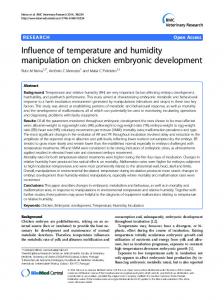
Fig. 8. External connector temperatures measured on a vehicle undergoing reliability testing for a 24-h period.
For this connector with unsealed cables, the time delay is between 4.6 and 5.0 min. During the heating and cooling phase, in steady state, the difference between the external connector temperature and the internal connector temperature is between 16.8 and 18.2 C. Although these results are not unexpected, particularly the length of the delay between external and internal temperature is surprising. A contact terminal in a connector housing that experiences rapid temperature changes, would not necessarily “see” these temperature changes at the contact interface. In a field experiment involving the measurement of temperatures at various parts of a vehicle, a connector that is located behind the bumper of a vehicle will encounter ambient temperature when the vehicle is driven and a higher temperature, as shown in Fig. 8 up to 40 C, when the vehicle is stationary [5]. In a stop-and-go situation, such as in urban traffic, the connector terminals would not reach the temperature of 40 C, but instead oscillate around an average value which is somewhere between ambient temperature and 40 C. According to the laboratory experimental results as shown in Figs. 6 and 7, the contact degradation at the contact interface is likely to be lower in this case than would be estimated if the contacts performed the full temperature cycle. 2) Theoretical Model: A model for heat transfer experienced by completely enclosed connectors is established to theoretically evaluate the behavior of the internal temperature with respect to changes in the external temperature. Structurally, the model is based on an electrical analogy for one-dimensional heat conduction and specific heat [16], [17]. The equivalent governing equation is given by (3) and are the heat capacity and thermal resistance of where connector material, in this case polyester filled with glass fiber, is the internal temperature; is the internal respectively; temperature; and is time. as seen in Fig. 2 can be approxThe external temperature imated by three different linear (piecewise-linear) equations, generalized as shown in (4) where
is the gradient and
is the -axis intercept value.
Fig. 9. Theoretical temperature profiles based on the model of a completely enclosed connector.
In each case, (4) was used to depict the 20-min heating process from 5 C to 90 C, the 100-min long subtle decrease from 90 C to 80 C and the 20-min cooling process from 80 C to 5 C. Using the empirical method to evaluate first order differential equations, the general solution for (3) would be (5) where is an arbitrary constant. The specific heat capacity of the polyester filled with glass of the 16 g confiber is 1.26 Jg K [18], therefore the nector is calculated to be 20.16 JK . The thermal conductivity of the polyester is 0.27 Wm K [18], hence based on the physical housing dimensions, the corresponding thermal reis found to be approximately 13.33 KW . The sistance product of the two parameters giving the time constant was 268.8 s. Substituting the numerical values and applying appropriate boundary conditions to (5), the internal temperature profile due to changes in the external temperature is illustrated in Fig. 9. The differences between internal and external temperature are 18.8 C and 16.6 C for the heating and cooling phases, respectively. The time delays are both approximately 4.17 min. It can be also seen that the trend of the theoretical internal temperature profile was similar to that of the experimental results as given in Figs. 6 and 7. Several assumptions were made for the model. First, comparing the external temperature profiles for the experimental would be subjected and theoretical cases, it was noted that to errors in the piecewise linear approximations, especially in between the discontinuity regions. These errors were not taken into account for the theoretical evaluation of the internal temperwas derived from ature . Second, the thermal resistance an ideal isotropic housing structure. However in practice, the internal temperature was not measured under the same conditions, hence propagating these inaccuracies to the time constant value. Thirdly, the model was based on a completely enclosed housing and therefore only conduction was considered for the heat transfer. Convection was ignored in this case hence this was not entirely representative of the experimental situation.
Authorized licensed use limited to: UNIVERSITY OF SOUTHAMPTON. Downloaded on June 15, 2009 at 07:34 from IEEE Xplore. Restrictions apply.
LAM et al.: TEMPERATURE, HUMIDITY AND PRESSURE MEASUREMENT ON AUTOMOTIVE CONNECTORS
337
Fig. 11. Relative humidity for housing with sealed cables at varying temperature profile. Fig. 10. Relationship between experimental external temperature line; and theoretical internal temperature (experimental—dashed theoretical—solid line).
X
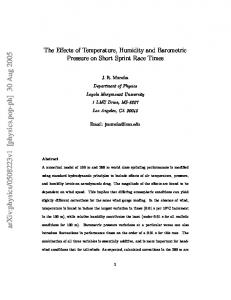
This model is applied to the field experimental results (see Fig. 8) to support its validity. The temperature data collected from the connector located behind the bumper was used. They were interpolated and eventually evaluated in MATLAB employing numerical methods to approximate the internal temperature at the contact interface. Fig. 10 shows the relationship between the field experimental data (in dashed -marked lines) and the approximated modeled result (in solid lines) for a first 720 min; this was extracted in order to illustrate the observations more clearly. It can be seen that for varying external temperatures, there are differences in the corresponding calculated internal temperatures with respect to the same point in time. In this case for the field experiment, the most abrupt change of external temperature is approximately 0.031 C/s, which is 2.3 gentler than the gradient of the laboratory results. Therefore, it can be expected that the difference between internal and external temperatures would also be relatively smaller as compared to the latter results obtained in Figs. 6 and 7. This is due to the fact that the field experimental data involve connectors that are different from those used in the laboratory tests. From Fig. 10, the maximum difference in temperatures is found to be approximately 2.1 C. Furthermore, the respective estimated maximum time delay of 4.13 min is comparable to that of the laboratory experiments and theoretical model. Another important observation is that occasions where rapid variations in external temperature occur, these changes could not be “seen” by the internal temperature at the contact interface. The field experimental data was taken from unrelated measurements from previous literature and it showed that the difference between internal and external temperatures would be of no major concern in this particular case. However, in relation to our studies, further investigations will be carried out in more detail. 3) Summary: A time delay in the order of minutes can be expected between the external and internal connector temperature. This means that rapid external temperature changes do not reach the contact interface and have a less than expected contribution to contact degradation. The theoretical model was established to analyze and correlate the temperatures. With this, using appro-
Fig. 12.
Internal absolute humidity versus temperature.
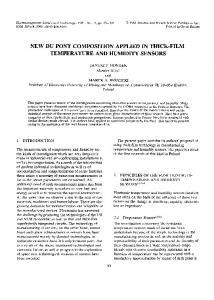
priate values for the material parameters, approximations could be effectively carried out for other types of connector housings without the need to perform the experiments. B. Humidity 1) Constant Humidity With Varying Temperature: The climatic chamber was programmed to maintain relative humidity at a constant level while the external temperature changed between 15 C and 90 C. The graph in Fig. 11 shows both the external and internal temperature, as well as external and internal humidity over time. Due to the regulation control of the chamber, external relative humidity could not be kept constant at the programmed value of 20% as a result of dynamic temperature changes. This limitation of the chamber affected the measured external RH levels as given by the example of the housing with sealed cable in Fig. 11. Using (1), absolute humidity (AH) levels were calculated and plotted against temperature as shown in Fig. 12. Under the same experimental conditions, internal AH levels of the sample with sealed cables were found to have smaller magnitudes and error bars when compared to that of the unsealed sample. In the case of an ideally sealed sample, there would be no exchange of air flow and therefore absolute humidity should remain constant since the ratio between the mass of water vapor and the volume of dry air is unchanged.
Authorized licensed use limited to: UNIVERSITY OF SOUTHAMPTON. Downloaded on June 15, 2009 at 07:34 from IEEE Xplore. Restrictions apply.
338
IEEE TRANSACTIONS ON COMPONENTS AND PACKAGING TECHNOLOGIES, VOL. 29, NO. 2, JUNE 2006
Fig. 13. Relative humidity at 25 C for housing with unsealed cables.
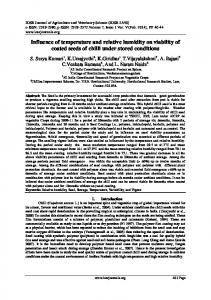
2) Varying External Humidity at Constant Temperature: By varying the external humidity and keeping temperature constant, the effect of external humidity on internal humidity was investigated. The temperature was set at a fixed value of 25 C. The external RH levels followed the programmed profile as depicted in Fig. 4 and the result for the housing with unsealed cables is shown in Fig. 13. It was obvious that when temperature remained unchanged, the humidity inside the housing would also remain unchanged despite the variation of the external humidity. This observation was evident for both housing samples with sealed and unsealed cables. This means that for air inside the connector to be exchanged, the temperature and therefore the air pressure needs to change. 3) Summary: The measurements of humidity clearly show that an exchange of the air inside the connector is possible when the temperature and therefore the pressure inside the connector change. The seal limits this air exchange, but does not prevent it. Furthermore, it is noted that the measured internal RH levels approximately at 60% as shown in Fig. 13 are in the range where corrosion rates tend to increase [9]. C. Pressure 1) Comparison of External and Internal Pressure: The absolute pressure measured for the sealed-cable and unsealed housings were repeatable over several thermal shock cycles when subjected to temperature variation as described by the profile given in Fig. 2. Thus, each respective connector housing could be represented by a single cycle as depicted in Figs. 14 and 15. From Fig. 14, the internal pressure of the sample with sealed cables was 100.5 KPa at 5 C. During the period when temperature was increasing, the internal pressure began to increase rapidly to 101.4 KPa. When the temperature continued to reach the set maximum temperature of 90 C, the rate at which the internal pressure changed reduced by approximately a factor of 80. As the temperature commenced to decrease gradually to 80 C, the internal pressure seemed to decrease initially at a fast rate to reach approximately 100.3 KPa and subsequently remained relatively constant until a sudden change of temperature was encountered at the later stage of the profile. The internal
Fig. 14.
Absolute pressure for housing with sealed cables.
Fig. 15.
Absolute pressure for housing with unsealed cables.
pressure then decreased sharply to 98.7 KPa. From that point thereafter, the internal pressure started to increase at a gradual pace until the temperature reached approximately 5 C. Upon reaching this minimum value, the temperature remained constant for an hour and the corresponding internal pressure level also returned to the initial value of 100.5 KPa. The climatic chamber experienced free flow of air. Hence ideally, external pressure should remain constant in the climatic chamber regardless of the change in temperature. However, it was observed that the relatively small levels of variation occurred in the absolute external pressure. These variations are due to the cross-sensitivity of the pressure sensors to temperature. For the sample with unsealed cables, similar trends were observed as shown in Fig. 15. The main differences were found in the maximum and minimum values of internal pressure at 101.1 KPa and 99.8 KPa, respectively. This could be expected as the unsealed feature allowed air flow through the housing which led to less pressure build-up inside the housing. The differences between the experimental values for the external and internal pressures denoted by differential pressure were calculated. Fig. 16 describes the relationship of the differential pressure and the temperature for the samples with sealed and unsealed cables. The sample with unsealed cables would
Authorized licensed use limited to: UNIVERSITY OF SOUTHAMPTON. Downloaded on June 15, 2009 at 07:34 from IEEE Xplore. Restrictions apply.
LAM et al.: TEMPERATURE, HUMIDITY AND PRESSURE MEASUREMENT ON AUTOMOTIVE CONNECTORS
Fig. 16.
Differential pressure vs. temperature.
have a higher degree of ventilation as compared to the unsealed sample. With this, it was noted that the differential pressures of the unsealed housing took on smaller magnitudes, hence forming an inner loop as seen in Fig. 16. From (2), it is assumed that in an ideal enclosed housing, the ratio of pressure and temperature is a constant given by since the number of molecules , the gas constant and should remain the same. Using the initial temthe volume perature and internal pressure of 5 C (278 K) and 100.5 KPa, the corresponding internal pressure at 90 C (363 K) was calculated to be 131.2 KPa. Similarly at the cooling process, using the initial temperature and internal pressure of 80 C (353 K) and 100.3 KPa, the corresponding internal pressure at 5 C (278 K) was calculated to be 77.6 KPa. The calculated values of 131.2 KPa and 77.6 KPa would be the ideal pressures experienced for the heating and cooling processes respectively. From the experiment, the values measured differed from that of the ideal situation as there were possible leakages within the housing, in which case, the number of molecules and subsequently the gas constant are not the same at different temperatures. In the event of dry air, the gas constant is known to be at 287 J kg K [19] (Note: this is not the universal gas constant). If condensation occurs from the effects of the temperature cycling procedure, the gas content would increase to approximately 461.5 J kg K [20] due to the presence of water vapor. 2) Summary: The measurements of connector pressure have shown that the internal pressure changes with temperature are less than could be expected from theory. The difference is believed to be caused by leakages in the connector system. The change in internal pressure may be considered sufficient to cause fretting motion at the contact interface. The two contact terminals would act as “pistons” and move outwards when the internal pressure is increased and inwards, when the internal pressure is reduced. From this point of view it is not desirable to have a completely airtight connector, because the pressure build-up and therefore the expected fretting motion are larger. To verify this assumption a simple experiment was carried out. From Fig. 16, the differential pressure, which is the difference between the internal and external pressure is found to be approximately 1 KPa. The cross-sectional area upon which this differential pressure acts is measured at 300 mm . The equivalent 0.3-N force (given by the product of pressure and area) is calculated.
339
The male part of the housing was held tightly by a clamp. A calibrated weight of 30 g was attached to the female part of the housing to allow the effects of this force to be studied by measuring the displacement between the male and female parts. It was found that the relative displacement of the connector housing due to 0.3 N force is below 3.7 m (the sensitivity of the displacement gauge used here). It is noted that this value does not represent the movement at the electrical contact point. Nonetheless, this information is useful as it indicates that the movement caused by differential pressure is small and hence, realistic measurements for future work on fretting could be carried out by visual or optical means where the housing would be exposed to external environmental conditions at the contact interface. A study is currently being undertaken to investigate the relationship between temperature, internal pressure, and relative displacement at the contact interface. IV. CONCLUSION In this paper, three different environmental parameters that would affect the reliability of connector contacts were investigated by subjecting the housing samples with sealed and unsealed cable to a series of laboratory experiments. These test results relate the actual conditions at the contact interface to the conditions surrounding the connector housing. Each parameter was measured with commercially available sensors that were compact and relatively small in order to be placed within the housing. A time delay between the external temperature and the internal temperature in the order of several minutes has been measured in the experiments. It is expected that rapid external temperature changes with a period of only a few seconds do not reach the contact interface and therefore have a less than expected contribution to contact degradation. The measurements of humidity clearly show that an exchange of the air inside the connector is possible when (and only when) the temperature and therefore the pressure inside the connector change. The seal limits this air exchange, but does not prevent it. The measurements of connector pressure have shown that the internal pressure changes with temperature are less than could be expected from theory. The difference is believed to be caused by leakages in the connector system. The change in internal pressure in the measurements performed here was not sufficient to show fretting motion at the contact interface. This will be investigated further in the near future. In conclusion, the investigations to relate temperature, humidity, and pressure inside and outside the connector housing were carried out. The results proved to be useful for the initial understanding of the environmental effects on connector housings. In the near future, these monitoring techniques will be employed to measure the parameters under a more realistic situation such as in the case of an actual connector housing within a moving car or vehicle. ACKNOWLEDGMENT The authors would like to thank W. Stabroth, Tyco Electronics, Germany, for samples and useful suggestions, the Staff
Authorized licensed use limited to: UNIVERSITY OF SOUTHAMPTON. Downloaded on June 15, 2009 at 07:34 from IEEE Xplore. Restrictions apply.
340
IEEE TRANSACTIONS ON COMPONENTS AND PACKAGING TECHNOLOGIES, VOL. 29, NO. 2, JUNE 2006
of the Thick Film Unit, University of Southampton, for the use of the climate chamber and measuring equipment, and M. Hill and J. Sun, for their advice on MATLAB simulation.
[19] D. Brunt, Physical and Dynamical Meteorology. Cambridge, U.K.: Cambridge Univ. Press, 1944. [20] ASHRAE, “Psychrometric,” in Amerian Society of Heating, Refrigerating and Air-Conditionaing: 2001 Fundamentals Handbook. Atlanta, GA: ASHRAE, 2001, ch. 6.
REFERENCES [1] J. Swingler and J. McBride, “Fretting corrosion and the reliability of multicontact connector terminals,” IEEE Trans. Compon. Packag. Technol., vol. 25, no. 4, pp. 670–676, Dec. 2002. [2] J. Swingler, J. McBride, and C. Maul, “Degradation of road tested automotive connectors,” IEEE Trans. Compon. Packag. Technol., vol. 23, no. 1, pp. 157–164, Mar. 2000. [3] Public Safety Publication, Part 2, Int. Std. IEC 68 , 1987. [4] W. H. Abbott, “The development and performance characteristics of mixed flowing gas test environment,” IEEE Trans. Compon., Hybrids, Manufact. Technol., vol. 11, no. 1, pp. 22–35, Mar. 1988. [5] C. Maul, J. Swingler, and J. W. McBride, “Monitoring the connector environment in automotive systems,” in Proc. IEE Symp. Autom. Electron. Stand., London, U.K., Nov. 30, 1999, pp. 5/1–5/4. [6] R. D. Malucci, “Stability and contact resistance failure criteria,” in Proc. 50th Holm Conf., 2004, pp. 206–213. [7] J. H. Whitley and E. M. Bock, “Fretting corrosion in electric contacts,” in Proc. Holm Conf. Elect. Contacts, 1974, pp. 128–138. [8] G. T. Flowers, F. Xie, M. Bozack, and X. Hai, “A study of the physical characteristics of vibration-induced fretting corrosion,” in Proc. 50th Holm Conf., 2004, pp. 312–319. [9] M. Antler, W. H. Abbott, W. E. Campbell, S. M. Garte, M. S. Mamrick, A. C. Snowden, and J. Trzeciak, “The effect of environment on electrical contacts: a discussion at the 1973 Holm seminar,” IEEE Trans. Parts, Hybrids, Packag., vol. PHP-11, no. 1, pp. 57–67, Mar. 1975. [10] R. D. Malucci, D. L. Fowler, and F. R. Ruffino, “Field studies on the thermal environment for automotive applications,” in Proc. 35th Annu. IICIT Connect. Interconnect. Technol. Symp., 2002, [CD ROM]. [11] Classification of Environmental Conditions, Part 2: Environmental Conditions Appearing in Nature: Temperature and Humidity, Int. Std. IEC 721-2-1, 1982. [12] Standard for Automotive Electrical Connector Systems, Std. PF-1, 1994. [13] W. H. Abbott, “Effects of test procedures and sequences on the performance of tin-plated connectors,” in Proc. 39th Holm Conf., Sep. 1993, pp. 191–204. [14] R. D. Harrison, Chemistry, Physical Science, Physics—Book of Data. London, U.K.: Nuffield Advanced Science: The Nuffield Foundation, 1972. [15] D. V. Schroeder, An Introduction to Thermal Physics.. Reading, MA: Addison Wesley, 2000. [16] T. Y. Wang and C. P. Chen, “3-D thermal-ADI: a linear-time chip level transient thermal simulator,” IEEE Trans. Computer-Aided Design Integr. Circuits Syst. (TCAD), vol. 21, no. 12, pp. 1434–1445, Dec. 2002. [17] J. P. Holman, Heat Transfer, 6th ed. New York: McGraw-Hill, 1986. [18] MATWEB, Datasheet for Glass Fiber Reinforced Polyester, Material Property Data, 2004.
Yu-Zhi (Liza) Lam received the B.Eng. and M.Eng. degrees in electrical and electronics engineering from Nanyang Technological University, Singapore, in 1997 and 2000, respectively, and the Ph.D. degree in research and development of the biomedical oxygen sensor from the Thick Film Unit, University of Southampton, Southampton, U.K., in 2003. She is currently a Research Fellow with the Electromechanical Group, University of Southampton and also lectures at the Faculty of Technology, Southampton Institute. Her research interests include sensors and instrumentation especially in the field of biomedical engineering and MEM/NEM technologies.
Christian Maul received the Dipl.Ing. degree in mechanical engineering from the Technical University of Braunschweig, Braunschweig, Germany, in 1997 and the Ph.D. degree in fundamental and applied research in automotive connectors from the School of Engineering Sciences, Mechanical Engineering Department, University of Southampton, Southampton, U.K., in 2001. He is currently working with TaiCaan Technologies Ltd., Southampton, which engages in high-precision measurement and analysis of 3-D surface topography. Meanwhile, he is also involved in several research projects with the Electromechanical Group, University of Southampton.
John W. McBride received the M.S. degree in aeronautical engineering from the University of Southampton, Southampton, U.K., in 1978 and the Ph.D. degree in electrical contact phenomena from Plymouth University, Plymouth, U.K., in 1986. Since 1987, he has been Lecturer, Senior Lecturer, and now Professor of Electromechanical Engineering in the School of Engineering Science, University of Southampton. He is Chair of the Electromechanical Research Group. His research interests include instrumentation; surface metrology, applied to optics, MEMS, wear analysis, early sound recordings, and electrical contact phenomena. Dr. McBride is an Associate Editor of the IEEE TRANSACTIONS ON COMPONENTS AND PACKAGING TECHNOLOGIES and a member of the Organizing Committee, IEEE Holm Conference on Electrical Contacts.
Authorized licensed use limited to: UNIVERSITY OF SOUTHAMPTON. Downloaded on June 15, 2009 at 07:34 from IEEE Xplore. Restrictions apply.