R. K. Singh and J. Narayan, Phys. Rev. B 41, 8843 (1990). 2. Pulsed Laser Deposition of Thin Films, D. B. Chrisey and G. K.. Hubler, Eds. (Wiley, New York, ...
Tem poral an d Sp atial Beh av ior of Electr on Den sity an d Tem per atu re in a Laser -Prod u ced Plasm a fr om YBa 2Cu 3O 7 S. S. HARILAL, C. V. BINDHU, V. P. N. NAMPOORI, an d C. P. G. VALLABHAN* Laser Division, International School of Photonics, Cochin University of Science and Technology, Cochin 682 022, India (S.S.H., C.V.B., V.P.N.N., C.P.G.V.); and Department of Physics, Sree Narayana College, Punalur 691 305, India (S.S.H.)
Sp ectroscop ic stu d ies of laser -in d u ced p lasm a fr om a h igh -tem p eratu re su p ercon d u ctin g m ater ial, v iz., YBa 2 Cu 3 O7 (YB CO), h av e b een car ried ou t. Electron tem p eratu re an d electr on d en sity m easu rem ents w ere m ad e fr om sp ectral d ata. Th e Star k b road en in g of em ission lin es w as u sed to d eterm in e th e electron d ensity, an d th e ratio of lin e in tensities w as exploited for th e d eterm in ation of electr on tem p eratu re. An in itial electron tem p eratu re of 2.35 eV an d electron d ensity of 2.5 3 10 17 cm 2 3 w ere ob serv ed. Th e d epend ence on electr on tem p eratu re an d d ensity on d ifferent exper im ental p aram eters su ch as d istan ce fr om th e tar get, d elay tim e after th e in itiation of th e p lasm a, an d laser ir r ad ian ce is also d iscu ssed in d etail. Index Headings: Laser -p lasm a sp ectroscop y; Plasm a d iagn ostics; Em ission sp ectroscop y; YBa 2 Cu 3 O 7 .
INT RODUC TION Laser deposition of high-te mperature superconducting (HTSC) material such as YBa2 Cu3 O 7 (YB CO) for thin® lm preparation has recently attrac ted considerable attention from different groups of researchers. 1± 3 Among the various methods for producing HTSC ® lms, the laser deposition technique has gained wide acceptanc e. The technique is advantageous because of its highly directed and local nature and is capable of giving ¯ exible control over the process paramete rs and the ® lm composition, structure, and properties. 4 Laser radiation is being successfully used not only to deposit thin ® lms onto the specially prepared substrates but also to effect some structural modi® cations of the deposited layer and to analyze the molecular composition and velocity distribution of particle s encountering the substrate. 5,6 Among the parameters involved in the pulsed laser deposition process, the laser irradiance , laser wavelength, background gas pressure, and distance at which the substrate is placed seem to be more relevant in order to control the ® lm growth. Spectral analysis of light emitted from the plasma produced in the process of target ablation and material transport in laser deposition of thin ® lms gives information about the plasma composition, the energy content of ablation products, and the dynamics of the different species in the plume. In addition, the evolution of the plume can be theoretically predicted with models that refer to the initiation mechanism, kinetic processes, and other important paramete rs such as electron temperature and electron density, etc. Laser ablation of HTSC targets is accompanied by the formation of brilliant elongated plasma located over the target surfac e, extending outw ards. The length of the laser-ablated plasma plume depends on the laser irradiance Received 2 June 1997; accepted 18 September 1997. * Author to whom correspondence should be sent.
Volume 52, Number 3, 1998
employed as well as on the nature and pressure of the ambient gas used. 7± 9 It was also noted that the expansion dynamics of various species in the plasma strongly depend on the laser irradiance used and distance z from the target surfac e.10,11 Research on the ablation products of YBCO superconductors show s that there exist four types of particles: neutral atoms and oxide molecules, ions and ionized molecul es , micro-clusters , and mac ro-parti cles.12± 16 Analysis of the optical emission spectrum from the plasma plume has been used to identify vaporized and ejected atoms, ionized atoms, and diatomic molecules, while mass spectroscopic studies can be successfully used for the study of micro-cluste rs and macro-particles. Identi® cation of these species is important in understanding the complicated ablation, transport, and deposition processes. An analysis of optical emission produced by laser ablation of a YBCO target with the use of a wide range of wavelengths showed that UV radiation (excimer lasers) produces mostly neutral species and that 1.06 m m and 532 nm radiation (Nd:YAG laser) produce mostly ionized species.17,18 An excimer laser with high photon energy may cause internal electronic excitation. Also, YBCO has a smaller absorption coef® cient for the longe r wavelength in comparison to the UV region. More thermal effects can therefore be expected in the former case. An important difference betw een the excimer and YAG lasers is the much greater coherence of the YAG output, leading to vastly different far-® eld characteristics of the light source . Consequently, YAG laser excitation of the target occurs in a far more localized manne r. Richter 19 demonstrated the peculiarities of the pulsed laser plasma method for the deposition of thin ® lms by estimating the evaporation threshold as well as the electron temperature and density of the absorbing laser plasma. Most of the published works have concentrate d mainly on identi® cation of plasma species and on parametric studies of the velocity distributions of species in the expanding plume. 20± 23 How ever, relatively little quantitative information is available on either the fundamental plasma parame ters, such as electron temperature, electron density, composition, etc., or on the nature of the dominant plume excitation processes in differe nt spatial and temporal regions of the expanding plasma. Such data are required in order to develop and test models of plasma processes 24,25 that enable us to evaluate the energy transport into the plasma with regard to temporal and local behavior as well as its effectiveness in thin-® lm deposition. There are several diagnostic techniques employed for the determination of electron density, which include plas-
0003-7028 / 98 / 5203-0449$2.00 / 0 q 1998 Society for Applied Spectroscopy
APPLIED SPECTROSCOPY
449
ma spectrosc opy,26,27 Langmuir probe, 28,29 microwave and laser inte rferome try, 30± 32 and Thomson scatte ring.33,34 Thomson scattering is probably the most direct and least theory-depe ndent approach, while spectroscopy is the simplest as far as instrume ntation is concerned. Plasma density determination using Stark broadening of spectral lines is a well-established and reliable technique 26,35,36 in the range of number density from 10 14 to 10 18 cm 2 3 . The electron temperature is an equally important plasma parameter, which can be determined spectrosc opically in a variety of waysÐ from the ratio of the integrated line intensities, from the ratio of the line intensity to underlying continuum, and from the shape of the continuum spectrum (bremsstrahlu ng). 37 In the present pape r, we report the studies on plasma parameters such as electron density and electron temperature and their dependence on factors such as incident laser irradiance, time after the elapse of the laser pulse, and spatial separation from the target surface. The relative spectral line intensitie s of successive ionization states of barium were used for the determination of electron temperature , while the Stark broadene d pro® le of Ba(I) at the 553.5 nm transition is used for the measureme nt of electron density. EXPERIMENTAL Details of the experimental technique are given elsewhere.38,39 The plasma was generated by ablation of a high-temperature superconducting YBCO sample using 1.06 m m radiation pulses from a Q-switched Nd:YAG laser (Quanta Ray, DCR II) with a repetition rate of 10 Hz and pulse width of 9 ns (maximum energy 275 mJ). The estimated spot size at the target was 200 m m. The target in the form of a disk-shaped pellet (25 mm diameter and 5 mm thickness) was placed in an evacuated chamber provided with optical window s for laser irradiation and spectrosc opic observation of the plasma produced from the targe t. During these studie s the pressure inside the vacuum chamber was maintaine d at ; 10 2 4 mbar. The target was rotated about an axis parallel to the laser beam to avoid nonuniform pitting of the target surface. The bright plasma emission was viewed through a side window at right angles to the plasma expansion direction. The section of the plasma was imaged onto the slit of a 1 m Spex monochromator (Model 1704, grating with 1200 grooves per mm blazed at 500 nm, maximum resolution 0.015 nm), with entrance and exit slits kept parallel to the target surface , and the use of appropriate collimating and focusing lenses in order to have one-toone correspondence of the sample d area of the plasma with the image. The spatial resolution available was better than 0.2 mm. The recording was done by using a thermoe lectrically cooled Thorn EMI photomultiplier tube, which was couple d to a boxcar averager/gate d integrator (Standford Research Systems, SRS 250). The averaged output from the boxcar averager was fed to a chart recorder, which for the present study averaged out intensities from 10 pulses. For the calculation of electron temperature, emission intensities were corrected for the dete ctor s pe ctral re spons e, w hi ch w as prede te rmine d through use of a standard lamp.
450
Volume 52, Number 3, 1998
RESULTS AND DISCUSSION One of the most pow erful spectroscopic techniques to determine the electron density with reasonable accuracy is by the measure ments of a Stark-broadene d line pro® le of an isolated atom or singly charge d ion.26,27 For the estimation of electron density, the Stark-broadened pro® le of the Ba(I) transition (6p 1 P21 ± 6s 1 S0 ) at 553.5 nm was charted, with the monochromator kept at its maximum resolution. Three broadening mechanisms are likely to contribute signi® cantly to linewidths observed in plasmas produced during pulsed laser ablation, viz., Doppler broadening, resonance pressure broadening, and Stark broadening. Doppler broadening arises because of different Dopple r shifts (i.e., D l 5 l y z/c) experienced by the ablated species in differe nt regions of the plume having differe nt velocity components y z in the direction of observation. Since the expansion velocities 40 of Ba(I) are found to be ; 5 3 10 5 cm s2 1 , which corresponds to Doppl er linew idths [ full w idth at half-max imum (FWHM)] ; 0.1 A0 , the effect due to Doppler broadening can be ignored here. The pressure broadening is proportional to the ground-state number density of the corresponding species and transition oscillator strength. The reported value for resonanc e broadening for Ba(I) at 553.5 nm is relatively small,41 and hence the contribution due to this type of broadening can be neglected. Under these conditions Stark broadening is the dominant broadening process. Stark broade ning of spectral lines in plasmas results from collisions with charged species resulting in both broadening of the line and shift in the peak wavelength. The full width at half maximum of the Stark-broadened lines D l 1/2 is related to the electron density by the expression26
D l
1/2
5
1/4
[ ] [ ][
ne 2W 16 1 10
ne 3.5A 10 16
1 2
][ ]
3 2 1/3 ne N D W 16 A0 4 10 (1)
where W is the electron impact parameter, which can be incorporated with different temperatures; A, the ion broadening paramete r; and ND, the number of partic les in the Debye sphere. The ® rst term on the right side of Eq. 1 represents the broadening due to the electron contribution, and the second term is the ion correction factor. For nonhydrogenic ions, Stark broade ning is predominantly cause d by electron impact. Since the perturbations caused by ions are negligible compared with those from electrons, the ion correction factor can safely be neglected. Therefore Eq. 1 reduce s to
D l
1/2
5
2W
[ ]
ne A0 . 10 16
(2)
The electron impact parame ter (W) values for the Ba(I) 553.5 nm transition are not available in the literature, but values are available for the corresponding nsnp1 P01 ® ns 21 S0 transitions of the elements Mg, Be, and Ca from the same periodic group. 42 The latter values increase approximately linearly with n 2 , and this dependence was extrapolated to yield a W value of ; 1.6 3 10 2 2 A0 for the Ba(I) 553.5 nm transition at a temperature of 10 000
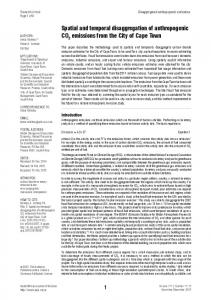
FIG. 2. Electron density as a function of distance. Laser irradiance, 42 GW cm2 2 . The dotted line in the ® gure represents the ® tted 1/z curve. FIG. 1. Typical Stark-broadened pro® le of the Ba(I) transition at 553.5 nm. The FWHM of this line is used to infer electron density. The dotted line in the ® gure represents a ® tted Lorentzian curve.
K. Since W values are weak functions of temperature and vary by a factor less than 2 over the temperature range 10 000 K± 80 000 K, the determination of electron density deduce d with the use of this W value can be considered as reliable. We have measure d electron density using the Stark broadening method as functions of separation from the target, time after the elapse of laser pulse, and laser irradiance . A typical Stark-broadened pro® le of Ba(I) at the 553.5 nm line with a theoretically ® tted Lorentzian curve is given in Fig. 1. Relative line intensities from the same element and ionization state usually do not provide accurate temperatures. The principal reason for this limitation is the relatively small separation between the uppe r levels of two lines. Considerable improve ment in sensitivity can be obtained by selecting lines from successive ionization states of the same element, because the effective energy difference is now enhanced by the ionization energy, which is much larger than the thermal energy. In local thermodynamic equilibrium (LTE), the ratio of such line intensities is given by 26 I9 I
D E` 5
3z
1/3
[ ]
e 2 4p n e 4p Î 0 3
(4)
where z 5 2 for the lower ionization state. 26 For temperature calculations, we made use of recorded intensitie s for the Ba(II) 614 and 649.8 nm lines and Ba(I) 577.7 and 553.5 nm lines. Details of the spectroscopic constants of these lines were taken from Griem.26 Sp atial Dep en d en ce. When the laser is focused onto the YBCO, which is placed in vacuum, a rapid expansion take s place because of density gradients in the plasma. Figures 2 and 3 represent plots of electron density and temperature, respectively, as a function of distanc e. The Stark-broade ned pro® le of the Ba(I) transition at 553.5 nm was used for density calculations, while line intensities of successive ionization stages were used for the electron temperature measurements. All the results were obtained in a direction of the expanding plasma plume axis at different distances from the target surfac e and at a laser irradiance of 42 GW cm 2 2 . The estimation of n e and Te of the laser-produce d YBCO plume was carried out for distances up to 12 mm from the target surface in
5
f 9g 9 l 3 [4 p fg l 9 3
[ ]
3/2
3
a0 ne]
2 1
3/2
2 (E 9 1 E ` 2 E 2 D E ` ) kT
[] [ kTe EH
exp
]
(3)
where the primed symbols represe nt the line of the atom with higher ionization state and where f is the oscillator strength; g, the statistic al weight; a 0 9 , the Bohr radius; E H, the ionization energy of the hydrogen atom; E, the excitation energy; and D E ` , the correction to the ionization energy E` of the lower ionization stage due to plasma interac tions. The correction factor in the ionization energy is given by
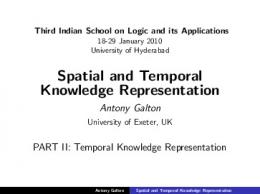
FIG. 3. The variation of electron temperature with distance from the target surface at a laser irradiance of 42 GW cm 2 2 . The dotted line in the ® gure represents the ® tted z2 0.8 curve.
APPLIED SPECTROSCOPY
451
FIG. 4. Electron density as a function of lase r irradiance. The spectra were sampled at a distance 3 mm from the target surface.
FIG. 5. Electron temperature as a function of laser irradiance (distance 3 mm).
a time-integrated manne r. The electron density was found to decrease rapidly from 2.4 3 10 17 cm 2 3 at 1 mm to 1.55 3 10 17 cm 2 3 at 3 mm and to level off at higher distance s. The density gradients of the plasma at a point z and at a time t can be expressed as 1,43
teristics of the laser-produc ed plasma strongly depend on the laser irradiance levels used. Figures 4 and 5 give the variation of electron density as a function of laser irradiance used for the ablation. The Stark-broade ned spectra are recorded in a time-integrated manner in which the plasma plume is sampled at a distance 3 mm from the target surface. As laser irradiance increases from 28 GW cm 2 2 to 55 GW cm 2 2 , electron density varies rapidly from 1.42 3 10 17 cm 2 3 to 1.8 3 10 17 cm 2 3 , and then it remains more or less at a constant value. As the laser irradianc e increases, the number of free electrons increases and consequently the electron density as well. With increase in laser irradiance, the electron temperature is also found to increase up to a threshold irradiance and then to saturate. The saturation in electron density and temperature at high irradiance levels is presumably due to plasma shielding, i.e., absorption and/or re¯ ection of the laser photons by the plasma itself.37 The re¯ ection of the incident laser photon depends on the plasma frequenc y n p, which should be lower than the laser frequency. A Nd:YAG laser with its fundamental wavelength (1.06 m m) corresponds to a frequency n l 5 2.828 3 10 14 Hz. The plasma freque ncy is given by n p 5 8.9 3 10 3 n 0.5 e , where n e is the electron density. Calculations show that, with n e ; 10 17 cm 2 3 , n p 5 6.5 3 10 12 Hz, which is much smaller than the laser frequency. So the energy losses due to re¯ ection of the Nd:YAG laser beam from the plasma can be assumed to be insigni® cant. The absorbing plasma generate d by the leading edge of the laser pulse prevents light from reaching the surface. Therefore , most of the energy in the remaining part of the laser pulse will be absorbed by material in front of the surfac e. The surface is effectively cut off from the trailing edge of the incoming laser pulse. Thus the given amount of energy delivered at high pow er is less effective in causing vaporiz ation than the energy delivered at lower pow ers. The prominant mechanism responsible for plasma absorption at these laser irradiance levels used is inverse bremsstra hlung.44 The saturation in Te and n e at highe r irradiance s cannot be explained by conside ring only the promine nt absorption mechanisms via inverse bremsstrahlung. Such temperature and density behavior can be explained by assuming the formation of a self-
n e (z, t) 5
[ ]
n 0 (t) 1 2
z Z(t)
(5)
where n 0 is the density at the center of the laser-irradiated spot (z 5 0) at time t; z is the coordinate perpendicular to the target; and Z(t) refers to the spatial coordinate of the leading edge of the plasma. According to Eq. 5, the electron density should be decreased linearly with distance from the target surfac e. How ever, in actual practic e the density gradient does not decrease linearly. The decrease of electron density as a function of distance shows a z2 1 dependence. The electron density in the plasma core decreases with distanc e because of the expansion of the plasma and also because of recombination and diffusion within the plasma volume. The much faster decrease near the targe t surfac e may be cause d by plasma cooling due to condensation and recombination. The variation of n e as a function of distance follow s approximately a 1/z law at short distances, indicating that the initial expansion of the electron gas is one-dimensional, in good agreement with the predictions of the plume expansion model given by Singh and Narayan. 1 The electron temperature close to the target is about 1.2 eV and it decreases with increasing separation from the target surface; at 5 mm distance, the electron temperature drops to 0.18 eV. At distanc es greater than 5 mm from the target surface, the electron temperature is almost constant. At distances close to the targe t, the thermal energy is rapidly converted into the kinetic energy, with plasma attaining maximum expansion velocities and thereby causing the temperature to drop off rapidly as the plasma expands. But at greater distances, the temperature drop is smaller and a saturation is observed because of energy gained in the recombination of ions. The variation of electron temperature show s a z2 0.8 dependence with distance. Effect of Laser Ir r ad ian ce. The nature and charac-
452
Volume 52, Number 3, 1998
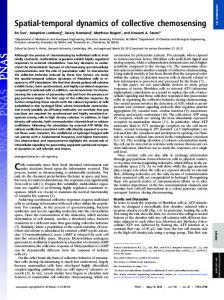
FIG. 6. Temporal evolution of electron density at a distance 3 mm from the target surface. Laser irradiance , 42 GW cm2 2 .
regulating regime at higher irradiances. 43 At high irradiance levels, when an appreciable amount of energy is absorbed by the plasma, a self-regulating regime may form near the target surface. If the absorption of the laser photons by the plasma becomes higher because of high plasma density, the evaporation of the species from the target becomes less, which in turn decreases the density of the charge d species. This behavior consequently increases the absorption of the laser photons by the target, which in turn increases the temperature of the plasma. On the other hand, when the absorption of the laser energy is less, the process is reversed, with similar results. It has been theoretically proved that45 the density, temperature, and dimensions of the plume adjust in such a manner that the plasma absorbs the same amount of laser radiation to maintain a self-re gulating regime. This assumption was found to be valid in laser-generated plasma, where thermalization time is signi® cantly less than the plasma expansion time, resulting in an establishment of uniform temperature in the plasma. The thermalization time t ei of energy exchange betw een electron and ions during collision can be estimated from the relation 46
t
5
ei
252MT 3/2 e ln( L )n e
(6)
3(kT) 3/2 4( p n e ) 1/2 e 3
(7)
where
L
5
and ln( L ) stands for the Coulomb logarithm, which involves dynamical information about ion± electron collisions, and M is atomic weight. With n e 5 10 17 cm 2 3 , Te ø T (vapor temperature) 5 1 eV, the relaxation time is on the order of a few picoseconds, which is much smaller than the expansion time or pulse width of the laser beam, which is on the order of a few nanoseconds. We have also observe d a peak shift in the line center with increasing irradiance. The observed asymmetry of our time-integrated emission line shapes is consistent with what would be expected for a convolution of various Stark shifts tow ards the red, which will arise from differing electron densities within the plume volume sampled, caused by different irradiance levels.
FIG. 7. The variation of electron temperature with time. These spectra were recorded at distance 3 mm and at a laser irradiance of 35 GW cm2 2 .
Tim e Dep en d en ce. The variation of electron temperature and electron density with respect to spatial position and laser irradiance described in the previous sections was studie d with the use of time-integrated emission spectroscopy. The calculated time-integrated electron temperature and density represent the average behavior of these parame ters at different times. These measurements may be in¯ uenced by the expansion of the plasma relative to integration time.47 We studied temporal variation of electron temperature and density with an integration time of 10 ns. For an integration time of 10 ns, the spatial distance traversed by Ba ions is 0.07 mm, taking the average expansion velocity 47 as 7 3 10 5 cm s2 1 at a laser irradiance of 42 GW cm 2 2 , which is much smaller than the successive spatial steps of 1 mm. Hence, there will not be any signi® cant mixing of spatial and temporal aspects of the plasma, and an effective separation of spatial and temporal effects can be achieved. The temporal evolution of electron density deduce d from Stark broadening of the Ba(I) 553.5 nm transition is show n in Fig. 6 (distance 3 mm, laser irradiance 42 GW cm 2 2 ). Since the spectral line emission front is masked by the continuum emission, the electron density for time , 200 ns could not be measured by this method. The continuum stems from the elastic collision of electrons with ions and black-body emission by plasma. The intensity of the continuum decreases with increasing delay time. Nevertheless, we can characterize the temporal evolution of n e , which is found to diminish rapidly with time up to 500 ns and then to level off. The fast decay rate can be attributed to the plasma propagation, while the slowing and leveling off at longer times are probably due to recombination. It may also be noted that electron density show s a t2 2 dependence on time. The calculated plasma temperature and its variation as a function of time after the initiation of the plasma are show n in Fig. 7. In the early stage of plasma evolution, the electron temperature is very high and is changing very rapidly. How ever, at greater duration times ( . 1 m s), the plasma is found to be cooled to much lower temperatures, and thereafter temperature continues to remain very stable, around 0.6± 0.7 eV for a long period.
APPLIED SPECTROSCOPY
453
The electron temperature follow s a t2 2 dependence on time during the initial periods up to ; 1 m s, which is in accordance with the theoritical adiabatic model by Rumbsy and Paul.48 Local Th er m od yn am ic Eq u ilib r iu m . For our analysis of electron temperature, we have assumed that the plasma is in local thermodynamic equilibrium. In a transient system such as the plasma formed by a pulsed laser beam, for LTE to hold good, the electron± atom and electron± ion collision processes must be extre mely rapid and must dominate the radiative processes. In a system that is at LTE, particle s will have Maxw ellian velocity distributions, populations in the energy levels will follow Boltzmann statistics, ionization processes will be described by Saha’ s equation, and radiation density will obey Planck’ s law. Along the boundary of the plasma, where the number densitie s are low and movement of the boundary region is rapid, LTE is probably not a good assumption. How ever, slightly deeper into the plasma volume, where conditions change more slowly and collisions occur more frequently, this assumption is valid. In our experiment the apparent length of the plasma is ; 3 cm, and studies were made for distances up to 11 mm from the target. Similar conditions are also valid in the case of time elapsed after the laser pulse (i.e., for time intervals on the order of few microseconds ). Clearly for LTE to hold, the electron density must be suf® ciently high. It is worthwhile to check the minimum density condition for LTE,49 viz., ne $
1.4 3
10 14 T 1/2 ( D E) 3 cm 2 3 . e
(8)
For the transition with the largest gap (553.5 nm), D E 5 2.24 eV and at the highest temperature, 2.5 eV, the lower limit for n e is 2.5 3 10 15 cm 2 3 . Our observe d values of n e are always greater than this limit, implying that the LTE approximation assumed for our analysis is valid. CONCLUSION The YBa2 Cu3 O 7 target is laser ablated, and the estimations of electron temperature and electron density of the resultant plasma plume have been carried out by spectroscopic means. The line intensities of the successive ionization state s were used for the determination of the electron temperature, and the Stark-broadened pro® le of the Ba(I) transition at 553.5 nm was used for the measurement of electron density. Measurements of the line intensities of electronically excited Ba atoms and Ba ions were used to infer electron temperature at several positions located away from the target surface and its variation as a function of time elapsed after the initiation of plasma. The electron temperature has z2 0.8 and t2 2 depende nce on distance and time, respectively. The variation of electron temperature with laser irradiance show s a saturation at high irradiance levels, and this observation can be explained by assuming the formation of a self-re gulating regime. The Stark-broadened pro® le was exploited for the determination of electron density and its variation with distance from the targe t surface, time after the initiation of plasma, and laser irradianc e. The electron density variation show s z2 1 dependence on distanc e from the target surface, while a t2 2 type variation is found to hold good
454
Volume 52, Number 3, 1998
with respect to the time elapsed after the laser pulse. At highe r irradiance levels, a saturation effect on electron density was also observed due to plasma shielding. ACK NOWLEDGMENTS The present work is partially supported by the Department of Science and Technology, Government of India. S.S.H. and C.V.B. are grateful to the Council of Scienti® c and Industrial Research, New Delhi and the University Grant Commission, New Delhi for their fellowships.
1. R. K. Singh and J. Narayan, Phys. Rev. B 41, 8843 (1990). 2. Pulse d Laser Deposition of Thin Films, D. B. Chrisey and G. K. Hubler, Eds. (Wiley, New York, 1994). 3. E. N. Sobol, Phase Transformations and Ablation in Lase r Treated Solids (John Wiley and Sons, New York, 1995). 4. D. B. Geohegan, Thin Solid Films 220, 138 (1992). 5. S. S. Harilal, P. Radhakrishnan, V. P. N. Nampoori, and C. P. G. Vallabhan, Appl. Phys. Lett. 64, 3377 (1994). 6. Y. Nakata, W. K. A. Kumuduni, T. Okada, and M. Maeda, Appl. Phys. Lett. 64, 2599 (1994). 7. A. Mele, A. G. Guidoni, R. Kelly, A. Miotello, S. Orlando, and R. Teghill, Appl. Sur. Sci. 96± 98, 102 (1996). 8. S. I. Anisimov, B. S. Lukyanchuk, and A. Luches, Appl. Sur. Sci. 96± 98, 96 (1996). 9. S. S. Harilal, R. C. Isaac, C. V. Bindhu, V. P. N. Nampoori, and C. P. G. Vallabhan, Jpn. J. Appl. Phys. 36, 134 (1997). 10. S. S. Harilal, R. C. Issac, C. V. Bindhu, V. P. N. Nampoori, and C. P. G. Vallabhan, J. Appl. Phys. 80, 3561 (1996). 11. S. S. Harilal, R. C. Issac, C. V. Bindhu, V. P. N. Nampoori, and C. P. G. Vallabhan, J. Appl. Phys. 81, 3637 (1997). 12. G. Padmaja, A. V. Ravikumar, V. P. N. Nampoori, and C. P. G. Vallabhan, Bull. Mat. Sci. 14, 545 (1991). 13. H. Chiba, K. Murakami, O. Eryu, K. Shihoyama, and K. Masuda, Jpn. J. Appl. Phys. 30, L732 (1991). 14. O. Eryu, K. Murakami, K. Masuda, K. Shihoyama, and T. Mochizuki, Jpn. J. Appl. Phys. 31, L86 (1992). 15. T. Venkateshan, X. D. Wu, A. Inam, Y. Jeon, M. Croft, E. W. Chase, C. C. Chang, and J. Wachtman, Appl. Phys. Lett. 53, 1431 (1988). 16. A. V. Bulgakov, M. R. Predtechensky, and A. P. Mayorov, Appl. Sur. Sci. 96± 98, 159 (1996). 17. L. Lynds, B. R. Weinberger, B. M. Potrepka, G. G. Peterson, and M. P. Lindsay, Physica C 159, 61 (1989). 18. H. S. Kwok, P. Mattocks, L. Shi, X. W. Wang, S. Witanachchi, Q. Y. Ying, J. P. Zheng, and D. T. Shaw, Appl. Phys. Lett. 52, 1825 (I1988). 19. A. Richter, Thin Solid Films 188, 275 (1990). 20. D. B. Geohegan, Appl. Phys. Lett. 60, 2732 (1992). 21. W. K. A. Kumudini, Y. Nakata, T. Okada, and M. Maeda, Appl. Phys. B. 58, 289 (1994). 22. J. Gonzalo, C. N. Afonso, and J. Perrie re, J. Appl. Phys. 79, 8042 (1996). 23. W. A. Weimer, Appl. Phys. Lett. 52, 2171 (1988). 24. H. C. Le, J. Vuillon, D. Zeitoun, W. Marine , M. Sentis, and R. W. Dreyfus, Appl. Sur. Sci. 96± 98, 76 (1996). 25. V. I. Maz hukin, I. Smurov, and G. Flamant, Appl. Sur. Sci. 96± 98, 89 (1996). 26. H. R. Griem, Spectral Line Broadening by Plasmas (Academic Press, New York, 1974). 27. H. R. Griem, Plasma Spectroscop y (McGraw -Hill, New York, 1964). 28. J. N. Leboeuf, K. R. Chen, J. M. Donato, D. B. Geohegan, C. L. Liu, A. A. Puretzky, and R. F. Wood, Appl. Sur. Sci. 96± 98, 14 (1996). 29. D. B. Geohegan and A. A. Puretzky, Appl. Sur. Sci. 96± 98, 131 (1996). 30. M. A. Heald and C. B. Wharton, Plasma Diagnostics with Microwaves (Wiley, New York, 1965). 31. G. K. Varier, R. C. Isaac, C. V. Bindhu, S. S. Harilal, V. P. N. Nampoori, and C. P. G. Vallabhan, Spectrochim. Acta B 52, 657 (1997). 32. T. Mochizuki, K. Hirata, H. Ninomiya, K. Nakamura, K. Maeda, S. Horiguchi, and Y. Fujiwara, Opt. Commn. 72, 302 (1989). 33. M. C. M. Van de Sanden, J. M. de Regt, G. M. Janssen, J. A. M.
34. 35. 36. 37. 38. 39.
40.
Van der Mullen, D. C. Schram, and B. Van der Sijde, Rev. Sci. Instrum. 63, 3369 (1992). S. B. Cameron, M. D. Tracy, and J. F. Camacho, IEEE Trans. Plas. Sci. 24, 45 (1996). C. C. Smith and N. J. Peacock, J. Phys. B 11, 2749 (1978). M. Galanti and N. J. Peacock, J. Phys. B 8, 2427 (1975). J. F. Ready, Effect of High Power Laser Radiation (Academic Press, New York, 1971). S. S. Harilal, R. C. Isaac, C. V. Bindhu, V. P. N. Nampoori, and C. P. G. Vallabhan, Pramana 46, 145 (1996). S. S. Harilal, R. C. Isaac , C. V. Bindhu, P. Gopinath, V. P. N. Nampoori, and C. P. G. Vallabhan, Spectrochim. Acta A 53, 1527 (1997). S. S. Harilal, Ph.D. thesis, Cochin University of Science & Technology, Cochin, India (1997).
41. D. B. Geohegan, in Pulsed Laser Deposition of Thin Films, D. B. Chrisey and G. K. Hubler, Eds. (Wiley, New York, 1994). 42. A. H. El-Astal and T. Morrow, J. Appl. Phys. 80, 1156 (1996). 43. R. K. Singh, O. W. Holland, and J. Narayan, J. Appl. Phys. 68, 233 (1990). 44. S. S. Harilal, C. V. Bindhu, R. C. Isaac, V. P. N. Nampoori, and C. P. G. Vallabhan, J. Appl. Phys. 82, 2140 (1997). 45. A. Caruso and R. Gratton, Plasma Phys. 10, 867 (1968). 46. Y. B. Zeldovich and Y. P. Raizer, Physics of Shock Waves and HighTemperature Hydrodynamic Phenomena (Academic Press, New York, 1966). 47. X. L. Mao, M. A. Shannon, A. J. Fernandez, and R. E. Russo, Appl. Spectrosc. 49, 1054 (1995). 48. P. T. Rumsby and J. W. M. Paul, Plasma Phys. 16, 247 (1974). 49. G. Beke® , Principles of Laser Plasmas (John Wiley and Sons, New York, 1976).
APPLIED SPECTROSCOPY
455