Temporal Classifiers for Predicting the Expansion of Medical Subject Headings George Tsatsaronis1 , Iraklis Varlamis2 , Nattiya Kanhabua3 , and Kjetil Nørv˚ag4 1 Biotechnology Center, Technische Universit¨at Dresden
[email protected] 2 Department of Informatics and Telematics, Harokopio University of Athens
[email protected] 3 L3S Research Center, Leibniz Universit¨at Hannover
[email protected] 4 Department of Computer and Information Science, Norwegian University of Science and Technology
[email protected]
Abstract. Ontologies such as the Medical Subject Headings (MeSH) and the Gene Ontology (GO) play a major role in biology and medicine since they facilitate data integration and the consistent exchange of information between different entities. They can also be used to index and annotate data and literature, thus enabling efficient search and analysis. Unfortunately, maintaining the ontologies manually is a complex, error-prone, and time and personnel-consuming effort. One major problem is the continuous growth of the biomedical literature, which expands by almost 1 million new scientific papers per year, indexed by Medline. The enormous annual increase of scientific publications constitutes the task of monitoring and following the changes and trends in the biomedical domain extremely difficult. For this purpose, approaches that try to learn and maintain ontologies automatically from text and data have been developed in the past. The goal of this paper is to develop temporal classifiers in order to create, for the first time to the best of our knowledge, an automated method that may predict which regions of the MeSH ontology will expand in the near future.
1
Introduction and Motivation
The biomedical domain is characterized by an exponential growth in the produced data volumes, primarily scientific published articles, knowledge and databases, nucleotide sequences and protein structures [6]. For instance, the number of the scientific articles that are published and indexed by PubMed5 is nowadays approximately close to 23 million, with an average of almost 15, 000 new articles being added each week. 5
The main search engine for the life sciences developed by the US National Library of Medicine. http://www.ncbi. nlm.nih.gov/pubmed
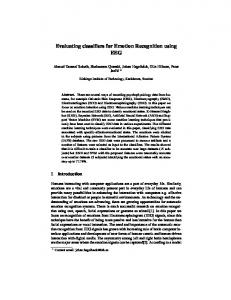
Fig. 1. Growth of the biomedical scientific literature (indexed by Medline) in absolute number of articles over the past 45 years.
This overwhelming amount of information constitutes the task of monitoring and following the trends in the biomedical domain almost impossible for researchers without the aid of automated tools and efficient search engines. In this direction, we have experienced in the last decade large activity in the area of semantic-enabled technologies. Semantic search technologies, e.g., ontology-based search of articles, achieve the goal of analyzing efficiently the textual information which lies inside the scientific publications, and index the articles using domain ontology concepts so that researchers can browse thematically the new citations, and filter out easily the irrelevant results. Two such popular search engines for the life sciences are PubMed and GoPubMed6 [4]. Both of these engines are based on annotating the scientific publications indexed by Medline7 with ontology concepts. The former engine uses the Medical Subject Headings8 , while the latter uses in addition the Gene Ontology9 and the Universal Protein Resource10 . Within the process pipeline of semantic search engines for the biomedical domain, such as the aforementioned examples, there are two major issues that need to be addressed efficiently. The first issue pertains to the ability of the engine to annotate timely and accurately the new scientific articles using concepts of the underlying ontologies. The latest advances in the field of text classification and text alignment have pro6
A semantic search engine for the life sciences. http://www.gopubmed.org/web/gopubmed/ The U.S. National Library of Medicine’s (NLM) premier bibliographic database. 8 http://www.nlm.nih.gov/mesh/ 9 http://www.geneontology.org/ 10 http://www.uniprot.org/ 7
vided the respective research communities of semantic search with novel methodologies which can address efficiently this task. For example, in Figure 1 we show how the PubMed engine is able to follow the exponential increase of published research articles (blue line) by annotating almost all of the new articles (red line) with MeSH concepts in a timely fashion. In addition, there have been several recently published methodologies, e.g., [13], which claim that can address efficiently the specific task of annotating scientific literature text with MeSH concepts using machine learning techniques, which in this case were shown to be robust to the ambiguity of MeSH terms. Thus, maintaining the pace of the annotations in a level that can follow the increasing amount of newly published articles is an issue that has been sufficiently addressed in the bibliography and can be conducted in a satisfactory manner with automated methods. The second problem faced by the biomedical semantic search engines is the maintenance of the underlying ontologies, so that the changes and advances of the biomedical domain are depicted in the used conceptualizations. Though the problem, also known in the literature as ontology evolution[8], has been studied for a long time, in the biomedical domain it is far from being solved. The intrinsic difference of the biomedical domain compared to other disciplines is the exponential pace with which new facts and findings are communicated via newly published articles. Thus, the cost of maintaining manually the underlying ontologies is extremely large, given the tens of thousands of new articles indexed weekly by PubMed. Motivated by this problem, in this paper we present a new methodology that may aid in an automated manner the maintenance of MeSH. We approach the problem, for the first time to the best of our knowledge, using temporal classifiers. More precisely, we construct classifiers that learn to predict which headings may be expanded in the near future, based on a feature set that contains both static and temporal features pertaining to the structure of MeSH, the appearance of the headings in the PubMed indexed articles’ major and minor annotations, and the PubMed results retrieved when querying with the specific heading. As a result of this process, we may then use the learned classifiers to predict in an unseen instance of MeSH which headings will be expanded, and evaluate the performance of the classifiers based on the success of the predictions. The rest of the paper is organized as follows. Section 2 presents some background knowledge regarding the Medical Subject Headings, as well as related work and methodological background in techniques for automated biomedical ontology extension. Section 3 presents in detail the suggested methodology. Section 4 analyzes the experimental evaluation and the produced results, and, Section 5 concludes and provides pointers to future work.
2
Background and Related Work
In the following we provide background information on the structure and properties of MeSH, as well as discussion of the related work with regards to automated methods that suggest biomedical ontologies’ extensions.
Year
Number of MeSH Headings Difference from Previous Year Average Min. Depth Average Max. Depth
1999 19, 354 2000 19, 537 183 4.61 5.26 2001 20, 374 837 6.12 6.61 2002 21, 624 1, 250 6.35 6.76 2003 22, 281 657 5.00 5.69 2004 22, 767 486 5.18 5.94 2005 23, 709 942 5.38 6.02 2006 24, 200 491 4.96 6.02 2007 24, 656 456 5.05 6.16 2008 25, 102 446 4.07 4.68 2009 25, 523 421 4.21 4.95 2010 26, 095 572 4.44 5.17 2011 26, 549 454 4.10 4.85 2012 26, 850 301 4.33 5.24 Table 1. Changes in the MeSH hierarchy from 1999 until 2012. Difference from the previous year, and the average minimum and maximum depths of the changes are presented.
2.1
The Medical Subject Headings Hierarchy
Medical Subject Headings (MeSH) is a hierarchy of terms maintained by the United States National Library of Medicine and its purpose is to provide headings (terms) which can be used to index scientific publications in the life sciences, e.g., journal articles, books, and articles in conference proceedings. The indexed publications may be then searched through popular search engines, such as PubMed or GoPubMed, using the MeSH headings to filter semantically the results. It has been reported in the past that such a retrieval methodology is beneficial, especially for the precision of the retrieved results [4]. MeSH includes three types of data: (i) descriptors, also known as subject headings, (ii) qualifiers, and, (iii) supplementary concept records. Descriptors are the main terms that are used to index scientific publications. They are organized into 16 trees, and as of 2013 they number 26, 853MeSH 11 . They include a short description or definition of the term, and they frequently have synonyms, known as entry terms. Qualifiers, also known as subheadings, may be used additionally to the descriptors to narrow down the topic of each of the descriptors. In total there are approximately 80 qualifiers in MeSH. Supplementary concept records, approximately 214, 000 in the most recent MeSH release, describe mainly chemical substances and are linked to respective descriptors in order to enlarge the thesaurus with information for specific substances. In this work we focus only on MeSH descriptors12 , and more precisely we aim at learning classifiers, using both static and temporal features, which may predict the MeSH headings that will be expanded in the next MeSH releases. In Tables 1 and 2 11 12
The most recent MeSH version is released as MeSH 2013. For the remaining of the paper, MeSH headings, MeSH descriptors and MeSH terms may be used interchangeably, referring always to the descriptors of MeSH.
Year
Tree A Tree B Tree C Tree D Tree E Tree F Tree G Tree H Tree I Tree J Tree K Tree L Tree M Tree N Tree V Tree Z
2000 32 18 14 70 26 2 20 2 2 1 0 2 0 3 2001 11 448 44 222 40 10 30 3 9 8 20 8 2 15 2002 46 716 41 250 58 28 52 16 26 10 17 17 11 36 2003 28 242 45 266 24 4 39 3 3 9 0 1 7 3 2004 12 169 53 139 39 4 38 2 4 1 24 11 0 8 2005 35 93 58 684 24 2 42 1 2 5 0 4 0 3 2006 27 60 70 255 35 6 43 8 4 7 0 1 1 3 2007 39 15 73 218 31 2 25 5 27 6 1 1 5 36 2008 28 57 57 101 51 13 95 15 7 8 4 3 3 28 2009 23 45 90 101 66 20 35 13 11 12 2 11 3 30 2010 32 62 90 167 110 21 70 8 10 23 0 11 3 40 2011 30 25 83 112 82 21 75 3 4 13 2 6 8 30 2012 8 4 24 107 74 18 28 5 11 16 1 8 4 46 Total 351 1, 954 742 2, 692 660 151 592 84 120 119 71 84 47 281 Depth 11 12 10 11 10 7 10 7 9 10 6 9 7 9 Table 2. Changes in the MeSH hierarchy per MeSH tree, from 1999 until 2012. Difference from the previous year, and the total number of heading additions is presented. Also the depth of each tree in the latest release is presented in the last line.
we present some statistics for the MeSH hierarchy over the past years that showcase the prediction problem we are addressing. Table 1 shows the number of MeSH headings per year from 199913 until 2012. It shows additionally the difference in number of headings compared to the previous year, and the average minimum and maximum depths that the changes (insertions) of MeSH headings occurred. Each of the MeSH headings may appear in different locations in the MeSH hierarchy of the 16 trees, and this is why in Table 1 we show both the average minimum and the average maximum of the changes occurred. A first view of the prediction problem we address can be formed by examining thoroughly Table 1. Annually, the past 12 years there is an average addition of 576 new MeSH headings. The changes occur on average between the levels of depth 4 and 6 in the MeSH trees. Thus, taking structural features into account, such as depth of MeSH headings and number of children and siblings of each heading, can be easily motivated by the statistics shown in Table 1. Table 2 shows the added MeSH headings per year and per tree. Also the total number of additions is presented from 1999 till date. The last line of the table presents the maximum depth of each tree, at the latest MeSH release. The depth is computed by finding the shortest path to the root, as there might be several paths leading to the root of a MeSH tree, starting from any given node, due to the fact that each heading may appear in several different positions in the MeSH tree. The letters of the MeSH trees correspond to thematic categories as follows: (A) Anatomy, (B) Organisms, (C) Diseases, (D) Chemicals and Drugs, (E) Analytical, Diagnostic and Therapeutic Techniques and Equipment, (F) Psychiatry and Psychology, (G) Phenomena and Processes, (H) Disci13
MeSH exists since 1963. However, is it only since 1999 that it has been systematically maintained and the changes are thoroughly tracked.
7 1 0 0 0 6 0 3 3 4 4 0 1 29 4
0 0 0 2 1 0 0 1 4 4 2 2 2 18 7
plines and Occupations, (I) Anthropology, Education, Sociology and Social Phenomena, (J) Technology, Industry, Agriculture, (K) Humanities, (L) Information Science, (M) Named Groups, (N) Health Care, (V) Publication Characteristics, and (Z) Geographicals. Several of the aforementioned MeSH trees neither evolve fast, nor frequently. For example the MeSH trees V and Z have been expanded by only 29 and 18 new MeSH headings respectively in the past 13 years. In addition, there are trees that evolve constantly, but extremely slowly, like for example the MeSH trees K and M, for which there are even years that no new MeSH headings are added. We believe that the approach in this paper may be beneficial and meaningful for the MeSH trees that have a large number of new MeSH headings, are updated yearly, and the changes are usually large, at least enough to provide sufficient number of positive training examples for the temporal classifiers. For this purpose, in this study we focus only in the three largest MeSH trees, namely trees B, C and D, which change annually and usually there are minimum tens of new MeSH headings added in them in each new MeSH release. These three trees number approximately 17, 000 MeSH headings, constitute almost 64% of the MeSH hierarchy, and contain approximately the 68% of all new MeSH headings additions since 1999. 2.2
Biomedical Ontology Evolution and Extension
Ontologies in the biomedical domain are the main tools for information and data integration. Gene product annotations[1], analysis of high-throughput data[16] and search[14] are just three examples of processes in which biomedical ontologies are used. However, maintaining the high degree of coverage of biomedical ontologies constitutes a major problem in the biomedical domain, since to keep up with new information, ontologies must be revised and newly added terms need to be enriched with definitions, cross-references and additional properties. In the biomedical domain, ontologies are manually curated, and, thus, developing and maintaining them is often a slow, tedious and error-prone process. Alleviating the bottleneck of automated maintenance requires the application of advanced text mining and related techniques. In the past, in the majority of the cases the developed techniques utilized term recognition and pattern-based relationship extraction [9] algorithms. Perhaps closer to our work are the approaches that either apply analysis of Web search results and PubMed articles [5], or machine learning to predict the regions that may be expanded [12]. Fabian et al. [5] developed an approach for automated sibling generation for MeSH. The approach has two main directions. First, it examines the possibility to extract MeSH term siblings by analyzing the structure of Web documents, and more precisely the HTML divisions or paragraphs that the terms are mentioned. The motivation behind this direction lies in the hypothesis that terms which are in a sibling relationship to each other are often located together in tables, lists, or headings in Web documents. Second, they examine a text-based approach by analyzing enumerations in sentences using natural language processing. For example, in the following sentence which is part of a PubMed article, there are enumerations of endocrine cells: ’...several adenohypophysial
endocrine cells such as somatotrophs, thyrotrophs, and gonadotrophs’.14 Finally, they also examined the benefits of an approach that combines the two aforementioned approaches for sibling generation. In experimental evaluation that they conducted using 1, 000 MeSH terms, the authors report that they are able to recover 79.3% of the terms’ siblings, when the system is given as input an initial seed of example siblings, e.g., three seed siblings. With regards to precision, using only the top-10 returned suggestions as siblings, e.g., using 10 as a cut-off threshold in the returned sibling list, the combined approach achieves 60.8%, the structure-based 53% and the text-based 48%. The aforedescribed sibling generation approach exists as part of the DOG4DAG system [15] which supports the semi-automated creation and extension of OBO ontologies. Pesquita and Couto [12] very recently published a new methodology for predicting the extension of the Gene Ontology. The idea is to use supervised learning in order to predict areas of an ontology that will undergo extension in a future version. The basic sets of features that are used for the learning process are: structural, e.g., number of all descendants of a term, annotation, e.g., all manual annotations for the term as they are given by the Gene Ontology, citation, e.g., number of PubMed articles mentioning the term, and hybrid, e.g., ratios of features that belong to the rest of the sets. In their experimental evaluation, after tuning of the parameters they report an F-Measure of approximately 79% in predicting the regions of the Gene Ontology that will undergo refinement in future versions. In this paper we suggest a method that is absolutely complementary to the two aforedescribed approaches. With regards to the method in [5], our approach may constitute a first step for the selection of the terms to be expanded. For instance, our predicting methodology can suggest which MeSH terms may be expanded in future versions of MeSH, and for the descendants of these terms, the approach in [5] can be used to extract sibling terms. With regards to the approach in [12], our method adds a complementary insight to the role of temporal features in the learned classifiers. Thus, a major difference of the current approach with the approach in [12] is that the authors in the latter work do not examine the potentiality of adding temporal features in the classifiers that are learned, e.g., acceleration in their appearance in the PubMed corpus. In this direction there are several approaches that may be considered in order to include time-based features in the learning of language models and classifiers, e.g., the reader may wish to consult the work in [7]. Furthermore, the target ontology in the work of Pesquita and Couto is the Gene Ontology, while in our case the feature set and the tuning is optimized for the MeSH hierarchy. These two knowledge-bases have significant differences, with the main difference being that Gene Ontology offers manual annotations of gene products, with respective evidence codes that support this annotation. In contrast, MeSH is basically a hierarchy rather than an ontology, and the only annotations for the terms that exist refer to annotations that may be used for the indexing of PubMed documents. Finally, the two knowledge-bases are designed for totally different purposes, with the former being an ontology to describe functional aspects of gene products and the latter being a hierarchy to provide headings that can be used as indexing indicators for scientific citations with application to retrieval of documents. 14
http://www.ncbi.nlm.nih.gov/pubmed/11478270
Fig. 2. Illustration of the introduced time parameters. Tr is the number of years used for training, Pr the prediction time frame, and ∆ the training/testing time gap to avoid bias and overlap between the training and the testing process.
3
Temporal Classifier Models for MeSH Terms
In this section we provide in detail the components and the steps of our methodology to construct temporal classifiers in order to predict MeSH headings that are going to be expanded in future MeSH releases. More precisely, we give all the details with regards to the three aspects of our approach, namely the time parameters and class labels, the feature engineering of the classifiers, and the actual methodology of building the temporal classifiers. 3.1
Formulation of the Classification Problem and Time Parameters
The basic time unit in our approach is the notion of a year, since every new release of MeSH is distributed annually. However, the suggested approach may be generalized to cover time units with different granularity in other applications. Based on the year unit, we can formally define our classification problem as follows; let C be the class label based on which the training of the classifiers takes place. C in our case is a binary value, with the value of 1 denoting a positive example and the value of 0 a negative example. Each example (instance) in our case is a MeSH heading, denoted with I, at a given year t, and for which a set of features X has been computed, which are explained in the next subsection, thus I = [X1 , ..., XN ]. If I is a MeSH heading that is going to be expanded in the next n years, e.g., a heading for which direct children will be added in the MeSH hierarchy, then I is a positive example, and, hence C = 1 in this case, where n is a time parameter that we will denote as Pr (Prediction Time Window). In the opposite case, I is a negative example, and, hence, C = 0 in this case. Given Pr = n, the classification problem we are solving is thus formulated as shown in Equation 1. M : I × C −→ 0, 1
(1)
where M (I, C) = 1 if I ∈ C, and M (I, C) = 0 otherwise. The class label is formulated parametrically in our case based on Pr, as shown in Equation 2.
( 1, if I obtains new direct children in the next Pr years C(Pr, I) = 0, otherwise
(2)
Thus, we are learning a classifier which attempts to capture based on the feature values, the pattern based on which the MeSH headings are expanded in future MeSH releases. Besides the parameter Pr, which defines the time window of the prediction in years, we are also introducing one more parameter, namely Tr (Training Time Window). Tr represents the number of years that are going to be used for producing the training examples of the classifier. Thus, a Tr value of 1 denotes that the MeSH version of only one year is used for the training of the classifier. In theory, Tr and Pr can have any positive integer values; however, to avoid the mixing of training and testing examples during the training, and, thus, securing that there is no bias inserted in the training, towards test examples that have actually been seen, there has to be a time gap between the years of MeSH selected for training, and the years of MeSH selected for testing and evaluation. We define this gap as ∆ (Training/Testing Time Gap), and it is defined as a function of Pr as follows: ∆ = Pr − 1. The rationale behind this definition is straightforward, and we will explain it through the following example; let Tr = 1, and Pr = 2, which means that we use a single year of MeSH to produce training examples, let it be y1 . Then, the class labels are 1 if the respective headings are going to be expanded in the next two years (y2 or y3 ), and zero otherwise. If we did not leave any time gap between training and testing, we could use y2 for testing. Assume in y1 there is an instance I that has C = 1, because it is expanded in y3 . The classifier has been trained also from this instance’s feature values, and, thus, using y2 for testing where I would still have C = 1, is repetition of the positive training example from the training set to the test set, and, hence, it introduces bias. However, adding a time gap ∆ = Pr − 1 = 1 in this case, does not allow us to select y2 as testing. In fact in this case the testing can start from y3 and on. It may be the case that I has again C = 1 in y3 , but this is something the classifier has not learned from y1 , because in this case C = 1 means that I can only be expanded in y4 or y5 . Thus, introducing ∆ as explained, ensures that there is no bias in the training of the classifier. The three parameters (Tr, ∆, Pr) and their relation are also illustrated in Figure 2. 3.2
Feature Engineering
The feature set that we have designed for learning the classifier explained in Equations 1 and 2 are of five different categories, namely structural, citation, annotation, hybrid and temporal. In the following we explain the rationale behind the engineering of these features. Each of the following features may be computed at a specific time point (year), let it be yn , and, thus, the values from year to year may change. This latter behavior of the feature values is captured by the temporal features. For the shake of description we assume that each of these features is, thus, computed at year yn for MeSH heading I. Structural Features Motivated by the findings shown in Table 1, we introduce five structural features, namely minDepth, maxDepth, siblings, direct children, and all children. The first two features refer to the minimum and the maximum depth of I in year
Category
Feature
Name
Description
X1 minDepth Minimum depth I appears X2 maxDepth Maximum depth I appears Structural X3 siblings # MeSH heading siblings to I X4 direct children # MeSH heading direct children of I X5 all children # MeSH heading descendants of I X6 PubMed results # PubMed results with I as query Citation X7 direct children results # PubMed results with I’s children as query X8 all children results # PubMed results with I’s descendants as query X9 PubMed annotations # major/minor PubMed annotations with I Annotation X10 direct children annotations # major/minor PubMed annotations with I’s children X11 all children annotations # major/minor PubMed annotations with I’s descendants all children annotations X12 annRatioAll all children direct children annotations X13 annRatioDir direct children all children results Hybrid X14 resRatioAll all children direct children results X15 resRatioDir direct children PubMed annotations X16 annRatioResults PubMed Results Xi,y −Xi,y
n n−1 Temporal Xi 0 temporal Xi Xi,yn Table 3. Summary of the used features. Features are computed for MeSH heading I in time point yn .
yn as this is computed from the MeSH hierarchy in the MeSH version of year yn . The siblings is the number of MeSH headings that share at least one common parent with I. The direct children is the number of all MeSH headings that have I as a parent, and all children is the number of MeSH headings that have I as an ancestor. Citation Features One of the basic hypothesis behind the introduction of citation features lies from the need of the ontologies to cover as widely as possible the topics that are heavily discussed in the literature of the domain, e.g., in scientific publications. Based on this, we introduce three citation features that are computed using the PubMed corpus (cf. Section 4.1 for more details on the used data sets). PubMed results computes the number of scientific citations returned using the heading I and its synonyms as query and the PubMed indexed documents as a corpus. For the computation of PubMed results only the indexed documents up to year yn are considered. Respectively, direct children results and all children results are the sum of the number of the PubMed results returned for all direct children of I, or for all descendants of I. Annotation Features MeSH is used as a controlled vocabulary to index Medline documents. The annotation Medline documents with MeSH terms is done by curators, and the product is high quality annotations that may be used for text mining. In order to embed this knowledge in our features, we introduce three annotation features, similar to the citation features, namely PubMed annotations, direct children annotations and all children annotations, which compute respectively the number of times I was used
as a major or minor heading in PubMed documents, the sum of the number of times any of I’s direct children was used, and the sum of the number of times any I’s descendant was used. Hybrid Features Several of the aforementioned features may receive very high integer values, like for example the all children results feature, given the volume of the MeSH headings. For this purpose we introduce a set of hybrid features that normalize the value of some of the aforementioned features, using their ratios. These features are: annRatioAll, the ratio between all children annotations and all children, annRatioDir, the ratio between direct children annotations and direct children, resRatioAll, the ratio between all children results and all children, resRatioDir, the ratio between direct children results and direct children, annRatioResults, the ratio between PubMed annotations and PubMed results, and, dirRatioAll, the ratio between direct children and all children. Temporal Features All the categories of the aforedescribed features are static, in the sense that they do not take into account the evolution of the feature values over a certain period of time, e.g., the changes from the last year. For this purpose, we introduce a series of temporal features, based on all of the aforementioned feature categories, to capture the change of the feature values from year to year. Formally, let Xi be any of the introduced features, and year yn the examined time point. For each Xi we introduced Xi 0 defined in Equation 3. Xi 0 =
Xi,yn − Xi,yn−1 Xi,yn
(3)
where Xi,yn is the feature value for feature Xi at time point yn , and Xi,yn−1 at the previous time point, e.g., yn−1 , respectively. The aim of each feature Xi 0 is, thus, to quantify the feature value changes, compared to the previous time unit. The summary of all of the aforedescribed features can be found in Table 3. 3.3
Implementing Classifiers to Predict Expansions of MeSH Terms
Given the asymmetrical expansion of the MeSH hierarchy per tree, and also the large imbalance between positive (headings that will be expanded) and negative examples, as it was shown in Table 2, here we explain how we implement the classification that was described in the previous sections. The basic idea is that a classifier is constructed per tree. The goal is to train an expert for each of the MeSH trees, since every tree expands with a totally different pattern, and, thus, mixing training examples from different trees might lead to inconsistencies, e.g., training examples that in one tree might have C = 1, in another tree with similar feature values might have C = 0, because of the different patterns that the the MeSH trees expand. Thus, to avoid such inconsistencies, a classifier Ci is trained for each of the trees Ti . More formally, for a given set of parameters Tr, Pr, T , where Tr is the number of MeSH versions (one per year) to use in order to draw the training examples, Pr determines the time window of the prediction, and T is the letter of a specific MeSH tree, a
training instance is built from each I ∈ T that was present in MeSH in the respective year, with a class label that is determined by Equation 2 and feature values computed as summarized in Table 3. Hence, if Tr = 2, there will be two instances in the training examples for any I that was present in both examined years. The years in our case start from 1999 and run until 201115 . Finally, given the ∆ time gap, a test set can be built for purposes of evaluation, where for all headings I in the respective MeSH version, features can be computed again as described in Table3. The reader may wish to note, however, that a test year cannot be larger than the maximum allowed year (2011) in our case. Thus, if Pr = k, and yn is the examined test year, evaluation cannot take place if yn + k > 2011. With regards to the used learner, we are using Random Forests, which have been shown to be among the state of the art machine learners available [2]. As our data set is highly imbalanced, we are using on top of the Random Forests, cost sensitive classification, using the MetaCost method [3]. In practice, every classifier may be transformed into a cost-sensitive classifier. In our case, we use in every training set, a series of preconstructed cost matrices to be given as input into the MetaCost approach. The used cost matrices start with the two class assignment [0.0 1.0; 5.0 0.0] of costs, e.g., the penalty for for false negatives is twice as double as for false positives in order to handle the imbalance of the data sets, and increase the penalty of false negatives with a step of 5.0 units until [0.0 1.0; 30.0 0.0]. With 10-fold cross validation on the training, we identify the best cost matrix set up, and use this for the testing, e.g., we tune the cost matrix values on the training set. Eventually, for each parameter Pr, and for each tree, there may be a different cost matrix used.
4
Experimental Evaluation
In this section we present the results of our experimental evaluation. We describe in detail the data sets used and the setup of our experimental evaluation, and we discuss analytically the importance of the findings. 4.1
Data Sets and Overall Experimental Setup
For our evaluation we are using all the MeSH releases from 1999 until 2011 (inclusive). As our corpus, we are using all of the PubMed indexed articles that were indexed until 31/12/2011, which number approximately 22 million scientific publications. The titles, abstracts, years, MeSH major and minor annotations of the articles are indexed locally in a Lucene index16 . The versions of the MeSH hierarchy are indexed separately, also in a Lucene index. Table 4 shows the experimental setup regarding the parameters Tr and Pr. More precisely, in each cell we show the number of test years we can evaluate the classifiers, if we use Tr years of MeSH as training, and aim to capture MeSH expansions in the following Pr years. In parenthesis, the respective time gap between training and testing sets is also presented (∆), which is computed as described in Section 3.1. All the 15
16
The 2013 release of MeSH contains the full 2012 MeSH, however, the PubMed files for the whole of 2012 are not yet available. Thus, we stop in year 2011. http://lucene.apache.org/core/
Tr PR= 1(∆ = 0) PR= 2(∆ = 1) PR= 3(∆ = 2) PR= 4(∆ = 3) PR= 5(∆ = 4) PR= 6(∆ = 5)
1 11 9 7 5 3 1 2 10 8 6 4 2 − 3 9 7 5 3 1 − 4 8 6 4 2 − − 5 7 5 3 1 − − 6 6 4 2 − − − 7 5 3 1 − − − 8 4 2 − − − − 9 3 1 − − − − 10 2 − − − − − Table 4. Experimental setup of the parameters Tr and Pr. Each cell shows the number of test years in which we can evaluate the classifier, for the respective Tr as training years and the respective Pr as the prediction years.
features are computed as described in Table 3, and the resulting instances are stored per year and per tree separately in Weka17 file format, which is the data mining tool we use to perform our evaluation. Regarding the learners used, as discussed, we are using the cost sensitive classification approach on-top of Random Forests, which constitute our base learners. In practice, for each Pr value, as shown in Table 4, we generate respective instance files per year and per tree, e.g., for PR= 1 we have 12 Weka files for each of the MeSH trees B, C, and D (total of 36 files), which we then use according to the setup of Table 4 to conduct the evaluation18 . The training files always start from year 1999. 4.2
Evaluation and Analysis of Results
Tables 5, 6, and 7 show respectively the results of the testing for the MeSH tress B, C, and D, following the experimental set-up shown in Table 4. The tables present the micro-averaged Precision (P), Recall (P) and F-Measure (F) for the positive class (C = 1)19 . Micro-averaging is more appropriate in our case compared to Macro-averaging due to the large discrepancies among the number of test instances present in each year. The best results for each Pr value are reported in bold. A first immediate conclusion from the reported results is that using more years for training (higher Tr), is definitely beneficial for the construction of the classifiers and always produced the best results. The reported results also show that the suggested methodology is able to predict with precision reaching up to 88.9% and respective recall of 50% (F-Measure= 63.8%) the headings that are going to be expanded in the Tree B (in this case) of the MeSH hierarchy in maximum three years from the testing year. Overall, for all three trees the results show that the prediction of expansions using Pr 17
http://www.cs.waikato.ac.nz/ml/weka/
18
The files corresponding to PR= 3 and PR= 4 are publicly available at the following URL:
19
In the majority of the cases, the results for the negative class obtained almost always an FMeasure larger than 90%
http://www.CICLing.org/2013/data/180
Tr
1 2 3 4 5 6 7 8 9 10
PR= 1(∆ = 0)
PR= 2(∆ = 1)
PR= 3(∆ = 2)
PR= 4(∆ = 3)
PR= 5(∆ = 4)
PR= 6(∆ = 5)
P R F P R F P R F P R F P R F P R F 16.7 0.5 1.0 11.5 29.1 16.5 38.1 27.1 31.7 14.9 48.8 22.8 11.9 62.3 19.9 12.1 62.8 20.3 4.8 12.0 5.6 10.8 37.6 16.8 20.8 37.6 26.7 32.9 33.1 33.0 12.9 65.0 21.5 3.2 13.5 4.7 8.7 41.0 14.3 30.8 30.7 30.7 36.7 33.6 35.1 16.4 35.0 22.3 6.5 13.2 7.2 12.9 30.2 18.1 29.1 28.6 28.8 43.5 40.4 41.9 11.4 10.3 9.3 13.1 27.7 17.7 28.1 33.5 30.6 64.9 53.6 58.7 8.0 9.8 8.5 20.1 30.6 24.3 59.3 40.0 47.8 12.5 5.6 7.7 16.1 20.7 18.1 88.2 50.0 63.8 14.3 4.8 7.1 35.3 17.9 23.8 35.0 5.4 9.0 28.4 28.1 28.3 42.9 14.3 21.4 Table 5. Experimental results for all Tr and Pr parameters for MeSH Tree B (Organisms).
in the range [2, 4] is possible with satisfactory results, if sufficient number of training MeSH years is used. In all other cases, the predictions are poor, e.g., predicting if in the immediate year a MeSH heading will be expanded. Interpreting the results, the top F-Measures, e.g., in the range 59% − 63%, and the respective precision and recall scores, mean that our methodology may suggest a list of typically few headings for the respective cases, in which more than 80% of the listed headings will be expanded in the predicted period, and in which almost half of all of the MeSH headings that will be expanded in that period may be found. As far as the difficulty of each tree is concerned, results show that the suggested methodology has higher success with the Diseases tree (F-Measure 66.4% for Pr= 4). Finally, with regards to the importance of features, we conducted 10-fold cross validation on almost all of the used training sets, and analyzed the importance of features using the information gain score. The top 5 features proved to be: temporal siblings, temporal all children, temporal direct children, annRatioAll, and, all children results, which shows that the notion of temporal features aids significantly the prediction, and also that the use of the offered PubMed annotations, and the wider use of the PubMed corpus is extremely beneficial. Analyzing the reported results from a broader view, we have shown that under conditions it is possible for the suggested methodology to predict the MeSH regions that will be expanded with a relatively high Precision, if sufficient number of training years is provided, and a lengthier prediction span is given as a parameter. This work alone may constitute a first step for automated ontology evolution, provided that it is augmented with a second step which may also suggest specific new terms to be added below the MeSH headings that are predicted as positive, i.e., that should be expanded in the next few years. In this direction, a possible expansion of the approach is to apply the extraction of temporal text rules [10, 11], annotate the rules with existing biomedical ontology concepts (e.g., UMLS), and analyze the rules the contain in the antecendents the MeSH headings that should be expanded. In these later rules, we expect that the consequents may contain important terms which could be added under the MeSH heading that requires expansion.
Tr PR= 1(∆ = 0) PR= 2(∆ = 1)
PR= 3(∆ = 2)
PR= 4(∆ = 3)
PR= 5(∆ = 4) PR= 6(∆ = 5)
1 2 3 4 5 6 7 8 9 10
P R F P R F P R F P R F P R F P R F 16.4 1.2 2.3 37.8 7.6 12.7 40.4 16.3 23.2 44.4 30.2 35.9 36.3 22.9 28.1 37 36.9 36.9 31.3 1.4 2.8 39.7 6.2 10.7 45.6 16.5 24.2 45.1 36.4 40.3 41.3 30.3 35 - 26.5 2 3.8 49.1 7.8 13.5 45.4 21.7 29.4 46.2 48.5 47.3 40.4 39.8 40.1 - 36 1.5 2.9 34.7 6.9 11.5 42.7 28.3 34 65.8 43.8 52.6 - 25 1.9 3.5 38.3 12.8 19.3 51.1 34.2 41 79.6 57 66.4 - 26.3 3.2 5.7 35.7 12.9 18.9 67.7 34.7 45.9 - 32.4 6.1 10.2 40.5 16.7 23.7 81.9 45.4 58.4 - 36.1 4.1 7.3 48.4 23.7 31.8 - 37.5 5.8 10.1 53.1 41 46.2 - 47.4 9.3 10.9 - Table 6. Experimental results for all Tr and Pr parameters for MeSH Tree C (Diseases).
Tr
PR= 1(∆ = 0)
PR= 2(∆ = 1)
PR= 3(∆ = 2)
- P R F P R F P 1 54.5 5.2 9.5 46.4 11.8 18.8 36.5 2 53.9 5.8 10.5 48.2 12.6 20 33.5 3 33.3 5.9 10 36.7 15.5 21.8 47.1 4 51.3 8.5 14.5 43.8 17.9 25.5 39 5 22.3 17.3 19.5 37.4 21.7 27.5 53.8 6 32 15.7 21.1 41.6 25.9 31.9 49.1 7 23.9 16.3 19.4 30.5 31.5 31 64.5 8 31.2 14.1 19.4 57.7 22 31.8 9 53.6 8.3 14.4 75.3 41.7 53.6 10 34.8 11 16.6 Table 7. Experimental results for all Tr Drugs).
5
PR= 4(∆ = 3)
PR= 5(∆ = 4)
PR= 6(∆ = 5)
R F P R F P R F P R F 26.8 30.9 44.1 39.1 41.4 32.4 35.6 33.9 30.4 34.1 32.1 33.9 33.7 50.1 36.7 42.3 27 38.4 31.7 28.4 35.5 59 38.5 46.6 41.4 30.9 35.4 37.8 38.4 52.9 45.9 49.2 32.7 40.7 63.2 56.5 59.7 36 41.6 51.7 57.4 and Pr parameters for MeSH Tree D (Chemicals and
Conclusions and Future Work
In this paper we presented a novel methodology for constructing temporal classifiers in order to predict the evolution of the Medical Subject Headings hierarchy. We engineered a set of of features that utilize the MeSH structure, PubMed citations, PubMed results, combinations of the aforementioned (hybrid), and temporal changes of the feature values, and applied temporal classification to make the predictions. Our results show that predicting the MeSH headings to be expanded is feasible, if a prediction window of at least 2 years is used and sufficient MeSH versions of previous years are employed for training. To the best of our knowledge, this is the first approach in the bibliography to address the issue of predicting MesH evolution, and we hope that our results motivate future work towards the use of temporal cost-sensitive classifiers for predicting ontology evolution in the biomedical domain for other ontologies as well.
References 1. M. Ashburner, C. A. Ball, J. A. Blake, D. Botstein, H. Butler, J. M. Cherry, A. P. Davis, K. Dolinski, S. S. Dwight, J. T. Eppig, M. A. Harris, D. P. Hill, L. Issel-Tarver, A. Kasarskis, S. Lewis, J. C. Matese, J. E. Richardson, M. Ringwald, G. M. Rubin, and G. Sherlock. Gene Ontology: tool for the unification of biology. Nature Genetics, 25:25–29, 2000. 2. L. Breiman. Random forests. Machine Learning, 45(1):5–32, 2001. 3. P. Domingos. Metacost: A general method for making classifiers cost-sensitive. In KDD, pages 155–164, 1999. 4. A. Doms and M. Schroeder. GoPubMed: exploring PubMed with the Gene Ontology. Nucleic Acids Research, 33:783–786, 2005. 5. G. Fabian, T. W¨achter, and M. Schroeder. Extending ontologies by finding siblings using set expansion techniques. Bioinformatics, 28(12):292–300, 2012. 6. D. Howe, M. Costanzo, P. Fey, T. Gojobori, L. Hannick, W. Hide, D. P. Hill, R. Kania, M. Schaeffer, S. S. Pierre, S. Twigger, O. White, S. Y. Rhee, and S. Y. Rhee. Big data: The future of biocuration. Nature, pages 47–50, 2008. 7. N. Kanhabua and K. Nørv˚ag. Improving temporal language models for determining time of non-timestamped documents. In Proceedings of ECDL’2008, pages 358–370, 2008. 8. P. D. Leenheer and T. Mens. Ontology evolution. In Ontology Management, pages 131–176. 2008. 9. K. Liu, W. R. Hogan, and R. S. Crowley. Natural language processing methods and systems for biomedical ontology learning. Journal of biomedical informatics, 44(1):163–179, 2011. 10. R. Neumayer, G. Tsatsaronis, and K. Nørv˚ag. TRUMIT: A Tool to Support Large-Scale Mining of Text Association Rules. In Proceedings of ECML/PKDD’2011, pages 646–649, 2011. 11. K. Nørv˚ag, T. Ø. Eriksen, and K.-I. Skogstad. Mining association rules in temporal document collections. In Proceedings of ISMIS’2006, pages 745–754, 2006. 12. C. Pesquita and F. M. Couto. Predicting the extension of biomedical ontologies. PLoS Computational Biology, 8(9), 2012. 13. G. Tsatsaronis, N. Macari, S. Torge, H. Dietze, and M. Schroeder. A maximum-entropy approach for accurate document annotation in the biomedical domain. BMC Journal of Biomedical Semantics, 3 Suppl 1:S2, 2012. 14. Y. Tsuruoka, J. ichi Tsujii, and S. Ananiadou. FACTA: a text search engine for finding associated biomedical concepts. Bioinformatics, 24(21):2559–2560, 2008. 15. T. W¨achter, G. Fabian, and M. Schroeder. DOG4DAG: semi-automated ontology generation in obo-edit and prot´eg´e. In SWAT4LS, pages 119–120, 2011. 16. P. L. Whetzel, H. E. Parkinson, H. C. Causton, L. Fan, J. Fostel, G. Fragoso, L. Game, M. Heiskanen, N. Morrison, P. Rocca-Serra, S.-A. Sansone, C. J. Taylor, J. White, and C. J. S. Jr. The MGED Ontology: a resource for semantics-based description of microarray experiments. Bioinformatics, 22(7):866–873, 2006.