This article was downloaded by: [Andrea Spinazzè] On: 22 August 2013, At: 08:21 Publisher: Taylor & Francis Informa Ltd Registered in England and Wales Registered Number: 1072954 Registered office: Mortimer House, 37-41 Mortimer Street, London W1T 3JH, UK
Journal of Occupational and Environmental Hygiene Publication details, including instructions for authors and subscription information: http://www.tandfonline.com/loi/uoeh20
Temporal variation of size-fractionated particulate matter and carbon monoxide in selected microenvironments of the Milan urban area a
b
c
A. Spinazzè , A. Cattaneo , G. Garramone & D. M. Cavallo
a
a
Dipartimento di Scienza e Alta Tecnologia , Università degli Studi dell'Insubria , Via Valleggio 11, 22100 , Como , Italia b
Dipartimento di Scienze Cliniche e di Comunità — Università degli Studi di Milano, via S. Barnaba 8 , 20122 , Milano , Italia c
International Centre for Pesticides and Health Risk Prevention - L. Sacco Hospital, via G.B. Grassi 74 , 20157 , Milano , Italia Accepted author version posted online: 12 Aug 2013.
To cite this article: Journal of Occupational and Environmental Hygiene (2013): Temporal variation of size-fractionated particulate matter and carbon monoxide in selected microenvironments of the Milan urban area, Journal of Occupational and Environmental Hygiene, DOI: 10.1080/15459624.2013.831985 To link to this article: http://dx.doi.org/10.1080/15459624.2013.831985
Disclaimer: This is a version of an unedited manuscript that has been accepted for publication. As a service to authors and researchers we are providing this version of the accepted manuscript (AM). Copyediting, typesetting, and review of the resulting proof will be undertaken on this manuscript before final publication of the Version of Record (VoR). During production and pre-press, errors may be discovered which could affect the content, and all legal disclaimers that apply to the journal relate to this version also.
PLEASE SCROLL DOWN FOR ARTICLE Taylor & Francis makes every effort to ensure the accuracy of all the information (the “Content”) contained in the publications on our platform. However, Taylor & Francis, our agents, and our licensors make no representations or warranties whatsoever as to the accuracy, completeness, or suitability for any purpose of the Content. Any opinions and views expressed in this publication are the opinions and views of the authors, and are not the views of or endorsed by Taylor & Francis. The accuracy of the Content should not be relied upon and should be independently verified with primary sources of information. Taylor and Francis shall not be liable for any losses, actions, claims, proceedings, demands, costs, expenses, damages, and other liabilities whatsoever or howsoever caused arising directly or indirectly in connection with, in relation to or arising out of the use of the Content. This article may be used for research, teaching, and private study purposes. Any substantial or systematic reproduction, redistribution, reselling, loan, sub-licensing, systematic supply, or distribution in any form to anyone is expressly forbidden. Terms & Conditions of access and use can be found at http:// www.tandfonline.com/page/terms-and-conditions
ACCEPTED MANUSCRIPT Temporal variation of size-fractionated particulate matter and carbon monoxide in selected microenvironments of the Milan urban area A. Spinazzè(a), A. Cattaneo(b), G. Garramone(c), D.M. Cavallo(a)
(a)
Dipartimento di Scienza e Alta Tecnologia, Università degli Studi dell'Insubria, Via Valleggio
Downloaded by [Andrea Spinazzè] at 08:22 22 August 2013
11, 22100 Como, Italia (b)
Dipartimento di Scienze Cliniche e di Comunità – Università degli Studi di Milano, via S.
Barnaba 8, 20122 Milano, Italia (c)
International Centre for Pesticides and Health Risk Prevention - L. Sacco Hospital, via G.B.
Grassi 74, 20157 Milano Italia.
Corresponding author:
Andrea Spinazzè
E-mail:
[email protected],
Postal Address:
Dipartimento di Scienza e Alta Tecnologia, Università degli Studi dell'Insubria, Via Valleggio 11, 22100 Como, Italia.
Telephone:
(+39) 0312386629 - (+39) 0250320147;
Fax:
(+39) 0250320111
Word count: 4860
1
ACCEPTED MANUSCRIPT
ACCEPTED MANUSCRIPT ABSTRACT
This paper focuses on air pollution in specific urban microenvironments and conditions characterized by high relative concentration levels and by possible risk to human health. For this reason, monitoring of Particle Number Concentration (PNC) with a wide,size-resolved particlesize range, and CO (an indicator of combustion sources; e.g. traffic), was performed in a variety
Downloaded by [Andrea Spinazzè] at 08:22 22 August 2013
of microenvironments. Concentrations of ultrafine particles (UFPs), size-fractionated particulate matter (PM), and carbon monoxide (CO) was measured in the central area of Milan over three week-long periods, one each during summer, autumn, and winter, with three monitoring sessions per day. Experimental data were collected continuously during each monitoring period along an established urban pathway, moving afoot or by different private and public means of transport, to assess the relevance of time and spatial factors affecting atmospheric concentrations of UFPs, PM, and CO. Measurements were divided on the basis of different microenvironments (MEs), seasons, days of the week, and periods of the day; data analysis shows statistically significant differences across MEs and monitoring periods. The highest measured median concentrations and data variability were observed for busy streets, walking or moving by motorized vehicle (CO, UFP) and in metro trains (PM); the lowest concentrations were observed in park areas and in indoor environments. The highest concentrations were measured during working-day morning monitoring sessions. Regarding seasonal variation, UFP, PM and CO showed different patterns: the highest median concentrations were observed in summer for CO, and in autumn and winter for the UFP and PM.
2
ACCEPTED MANUSCRIPT
ACCEPTED MANUSCRIPT Appreciable differences among all MEs and monitoring periods were observed: concentration patterns and variations appear related to typical sources of urban pollutants (traffic), proximity to sources, and time of day.
Keywords: ultrafine particles, traffic emission sources, particle number concentrations, personal
Downloaded by [Andrea Spinazzè] at 08:22 22 August 2013
exposure, individual exposure, urban transport microenvironments.
INTRODUCTION Milan is the second-largest city in Italy, with more than one million inhabitants. As with many large cities, it suffers from high levels of air pollution. Its urban area is characterised by a high density of residential and commercial buildings and a very high volume of vehicular traffic, while many factories are located at the city’s outskirts. Moreover, Milan is situated in the Po Valley, which experiences adverse atmospheric dispersion conditions due to its topography. Milan, especially in winter, exhibits prolonged periods of high pollution, during which air quality limits are exceeded and exceptionally high particulate matter (PM) mass concentrations are frequently measured.(1) Human exposure in transport microenvironments (MEs) is of particular interest because many residents and commuters spend a substantial proportion of their outdoor time in urban transport microenvironments. In addition, a recent review points out that time spent in transit can contribute substantially to total daily exposure.(2) Fixed monitoring stations measuring
3
ACCEPTED MANUSCRIPT
ACCEPTED MANUSCRIPT outdoor air quality are routinely used to assess general exposure levels to pollutants such as PM and carbon monoxide (CO). However, studies show that this approach significantly underestimates the exposure of particular population subgroups, pointing to the need for direct personal exposure measurements.(3-4) Further, there are indications that, as an exposure metric, particle number concentration may be more important than mass concentrations when considering impact on health.(5-6) Currently, concentrations of particles with aerodynamic
Downloaded by [Andrea Spinazzè] at 08:22 22 August 2013
diameter > 10 um (PM10) and > 2.5 (PM2.5) are regulated. The originality of the present work lies in its integrated measurement of PNC for both UFPs and size-resolved PM (and CO, as a co-pollutant), with a study design aimed at analyzing space and time variations (different seasons, three daily monitoring periods, many urban indoor and outdoor MEs). Research is not directly comparable to this study design; as they assessed the variability of a single, specific fraction of particles, such as UFPs(7) or PM2,5(8). Studies(9-12) focused on the analysis of the variations of exposure to UFPs (PNC), in association with different fractions of particulate matter (PM1, PM2.5, PM5, PM10), but these latter are expressed as mass concentrations. When attention is focused only on the PNC, typically, only a single fraction of particle is considered(7). Further, when the research is focused on size-fractioned PM, only a few fractions are considered(13,14) and usually UFPs are not monitored. The number concentration metric was selected because of its better accuracy in continuous monitoring, compared to continuously measured mass concentrations, if these latter are not properly corrected using simultaneous gravimetric data.
(15)
.For this reason, a
continuous, individual and time-resolved monitoring of PNC (with a wide, size-resolved dimensional particle-size range) and CO (an indicator of combustion sources; e.g. traffic), was
4
ACCEPTED MANUSCRIPT
ACCEPTED MANUSCRIPT performed in a variety of microenvironments; the choice of PNC as measurement metric was made because of its better accuracy in the measurement of spatial and temporal variations of concentration levels, compared to photometric mass concentration, The ultimate goal is to provide useful information for the interpretation of possible sources of high levels of in urban transport microenvironments.
Downloaded by [Andrea Spinazzè] at 08:22 22 August 2013
Particulate Matter High concentrations of airborne particles are associated with increased pulmonary and cardiovascular mortality(16-17)., mostly for fine particle (i.e., particles < 2.5 micron in aerodynamic diameter; PM2.5)(18).PM of particular concern for adverse impacts on human health ranges in size from the largest PM10 (aerodynamic diameter < 10µm) and PM2.5 (diameter < 2.5µm), to ultrafine particles (UFPs), (aerodynamic diameter < 0.1µm). Particle size defines the capacity for penetration in the respiratory system. ‘Inhalable fraction’ includes all particles that can be inhaled from the nose and mouth. The UFP and the finer PM fractions (PM2,5) can reach the deeper region of the respiratory system(19) and recent studies assess the possibility that nanoparticles may overcome the alveolar barrier and enter the bloodstream, contributing to increased risk of cancer, thrombosis, and cardiovascular diseases.(20,
21)
Further, there are indications of a specific toxicological role for UFPs in
respiratory diseases.(6) For example, UFP may induce inflammatory and prothrombotic responses, promoting atherosclerosis, thrombogenesis, and other cardiovascular events.(22) Human data suggest that inhaled UFPs influence lung physiology and may affect the autonomic nervous system or act directly on cells in various organs, inducing mutations.(23-27),
5
ACCEPTED MANUSCRIPT
ACCEPTED MANUSCRIPT These findings have, in the last few years, led to international guidelines and standards, and exposure assessment studies focused on specific, health-relevant fractions of PM. The impact on human health from exposure to PM and UFPs is strongly associated with particle chemical composition, and in particular with the presence of trace metal (Pb, Cd, Cr, As, Zn, Hg, among others) and of organic compounds classified as carcinogenic (e.g., Polycyclic aromatic hydrocarbons, dioxins). Typical sources of these pollutants include
Downloaded by [Andrea Spinazzè] at 08:22 22 August 2013
combustion processes (e.g., road traffic) and industrial processes, as well as natural sources (e.g., wind erosion, sea-spray, spores, and pollen). Road transport is recognised as a principal source of primary PM, and combustion of fuel is the main source of precursor gases in the urban environment.(28) Motor vehicle emissions are the major contributors out of all other combustion and non-combustion sources in urban areas. With decreasing particle size the contribution of road transport to the total emissions increases. Contributions from other combustion sources tend to decrease with decreasing particle size(29) . PM concentrations in Milan have been widely investigated, and seasonal trends, chemical compositions, and sources have been described.(1,7,30-35) Chemical speciation analyses enabled the identification and quantification of PM10 and PM2.5 sources: secondary aerosol contribution was found to be most prevalent and this was ascribed to nitrates and secondary organic compounds originating primarily from NOx, Volatile Organic Compounds (VOCs) emissions, which are typically traffic-related pollutants, as well as from NH3, typically emitted in farming activities.(32) Road traffic turns out to be the most important source of PM10 pollution in Milan, accounting for approximately 60% of the PM10 mass. PM2.5 appears strictly related to anthropogenic activities such as combustion processes,
6
ACCEPTED MANUSCRIPT
ACCEPTED MANUSCRIPT industrial processes, and traffic emissions; while the coarse PM(2.5-10) fraction is dominated by soil-related elements such as Al, Si, Ca, Ti, and Fe. Despite background UFPs concentrations ascribed to natural processes, processes such as ossil fuel combustion was shown to be the dominant source in urban areas(1,36,37), with heavy-duty diesel powered vehicles making a disproportionately large contribution to UFP
Downloaded by [Andrea Spinazzè] at 08:22 22 August 2013
concentrations.(38) Previous studies estimate a daily average exposure to UFPs (20-1000 nm) of 1.6 x 10⁴ particles/cm3 for people commuting in Milan, with indoor home exposure providing about 46% of total daily exposure, indoor office exposure about 30%, and transport environments about 24% (almost insensitive to transportation mode)(30). Moreover, the average particle number concentration measured in the 20–1000 nm size range was usually on the order of 1.0 x 10⁴ up to 4.0 x 10⁴ particles/cm3 in different indoor MEs and on the order of 3 x 10⁴ particles/cm3 (with a maximum up to about 105 particles/cm3) in different transport MEs; thus, the transport ME represents a significant component of exposure to UFPs in urban areas.(7, 30) Carbon Monoxide Some studies show that exposure to CO in urban populations can be variable and dependent on several factors.(39) This can be relevant in particular MEs, such as congested roads or tunnels, where the presence of road traffic at moderate speeds can contribute to high concentrations of CO. Other important determinants of exposure to CO may be distance from
7
ACCEPTED MANUSCRIPT
ACCEPTED MANUSCRIPT emission sources, season (higher values of CO are found in winter), or even day of the week (which can affect traffic fluxes). Moreover, a study in England finds a moderately strong correlation between personal exposure to UFPs and CO.(8) Further, there is a notable difference between ambient levels and personal exposure to CO, with the latter much higher particularly when walking near roads or in traffic. These differences should not be neglected
Downloaded by [Andrea Spinazzè] at 08:22 22 August 2013
when determining impact on health.(40) There is growing evidence that exposure to low concentrations (e.g., from less than 10 ppm) of CO can affect organ systems. However, the effects on health of prolonged low-level exposure to CO are unclear. It is suggested that chronic exposure to CO may produce mild neurological effects, although there are as yet no conclusive studies showing such a correlation.(41) Experimental studies show that those most affected by increases of ambient CO concentrations are those already prone to heart disease, and that low levels of CO adversely affect patients with heart disease when exercising. (42) There is also consistent epidemiological evidence that exposure to CO increases risk of cardiovascular mortality and cardiovascular disease hospitalization, even at ambient levels.(43-46) In Italy, the change in mortality for all natural causes associated with a 1 mg/m³ increase in CO was found to be 0.93%.(47) METHODS As discussed above, urban areas are characterised by a variety of MEs, in which airborne particle levels and CO concentrations may strongly vary, yielding different
8
ACCEPTED MANUSCRIPT
ACCEPTED MANUSCRIPT contributions to personal daily total exposures. The aim of this study is to measure concentrations of size-fractionated PM, UFPs, and CO, as a function of environmental settings (investigating selected MEs in the Milan urban area) and time (examining different periods of the year and days of the week). Study Design
Downloaded by [Andrea Spinazzè] at 08:22 22 August 2013
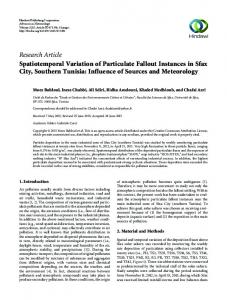
Experimental data were collected within the central area of Milan over three one-week periods in three different seasons (July 2008, October–November 2008, February–March 2009). This study followed the same procedure used in a previous study investing exposure to airborne UFPs in the same area.(7) Monitoring was performed only in the absence of rainfall. The monitoring strategy involved data collection while walking along busy streets (code ‘W1’ and ‘W2’), travelling by bus (code ‘B’), car (code ‘C’), and metro (code ‘UG’). Concentrations inside a car (2001 FIAT Punto) were measured while driving a vehicle fuelled by petrol along a very busy street, turning off the mechanical ventilation system and with windows closed. The car was equipped with a cabin pollen filter,and a three-way catalytic converter. Measurements were collected along the route represented in Figure 1, according to a sequential protocol that started and finished at the Department of Clinical Sciences and Community of the University of Milan, also used as an office sampling area (code ‘IN’). The protocol also includes investigation of a urban park (code ‘P’) and a large, multi-road intersection (code ‘CR’). All environments in which the operator was exposed to the study
9
ACCEPTED MANUSCRIPT
ACCEPTED MANUSCRIPT pollutants in other unspecified situations (e.g., waiting in the metro station) are classified as ‘transition environments’ (code ‘T’). The monitoring protocol is designed to collect data for at least 15 minutes in each selected ME. Data were collected at three times: morning (‘AM’: 08:00–10:30 am), lunchtime (‘EA’: 12:00–14:30), and afternoon (‘LA’: 16:00–18:30). A time-activity diary was
Downloaded by [Andrea Spinazzè] at 08:22 22 August 2013
completed in order to accurately separate the concentration data as a function of the different monitored environments; data were collected with a frequency of measurement of 30 seconds (averaging time). The instruments were placed into a backpack and carried by one investigator. Since the sampling inlets were not placed in strict correspondence with the breathing zone (the hemisphere of 30 cm radius extending in front of the face)(48), the study results refer to the so-called ‘individualmeasurement (in proximity of subjects – within 3 m), as discussed in Cattaneo et al.(49) The ‘individual measurements’ approach allows measurement of concentrations without losing accuracy with respect to breathing zone (personal) measurements, except for coarse particles.(49) Size-resolved PM Numeric concentrations of airborne PM were measured using an optical particle counter (OPC) and a condensation particle counter (CPC). Both OPCs and CPCs are able to provide real-time measurement of particles, although each type of instrument has its own
10
ACCEPTED MANUSCRIPT
ACCEPTED MANUSCRIPT sensitivity to specific particle characteristics. Immediately before the study, these instruments were calibrated by factory-supplied services. OPCs allow measurement of particle number concentration (PNC) separated as a function of their size, by detecting the light scattered by individual particles. The size range normally measured by OPCs is 0.3 to 20 µm, while the maximum number concentration is
Downloaded by [Andrea Spinazzè] at 08:22 22 August 2013
dependent on particle size. OPCs are usually used for clean room monitoring, although they have recently been updated for new applications in outdoor environmental monitoring and indoor air quality studies. The OPC used in this study (mod. Handheld 3016, Lighthouse Worldwide Solutions, Fremont, CA; Counting Efficiency: 50% @ 0.3 µm; 100% for particles > 0.45 µm) uses an active sampling mode (flow rate = 2.83 L/min). It is based on the principle of light scattering of a linear radiation produced by a diode laser focused on the air flow to measure PNC. Each signal is counted and classified into 6 different dimensional fractions (0.3–0.5, 0.5–1.0, 1.0– 2.5, 2.5–5.0, 5.0–10.0, > 10.0 µm). The timing of signal processing is extremely fast and allows measurements with high monitoring frequency (30 second-weighted average concentration). The CPC quantifies the PNC, using isopropanol to artificially enlarge particles through condensation of vapours on the particle surface. Unlike OPCs, however, this instrument does not allow differentiation of particles into different dimensional classes; so it is not possible to obtain information about the size distribution of PM.
11
ACCEPTED MANUSCRIPT
ACCEPTED MANUSCRIPT The CPC used in this study (P–Trak Ultrafine Particle Counter model 8525; TSI Inc., Shoreview, MN, USA; Concentration Range 0 to 5 x 10⁵ particles/cm3) measures particles ranging from 0.02 to > 1 µm in size (so for this study the ‘UFP’ fraction includes particle with dimension >100 nm, although their number concentration is negligible with respect to those in the 0-100 nm interval). This instrument is not equipped with a flow control system. The P– Trak operated with batteries at an inlet flow rate of 700 cm3/min; 100 cm3/min of the total
Downloaded by [Andrea Spinazzè] at 08:22 22 August 2013
sampled volume was automatically analyzed. Usually, portable and easy–to–use devices are characterised by worse metrological performance than counters well–suited for basic aerosol research in terms of measurement accuracy, minimum detectable particle diameter, and maximum measurable concentrations(50). The portable rapid-response instruments used in this study have shown adequate capacity to measure short-term variation of PNC in urban environments(7) Carbon Monoxide CO concentrations were measured via a passive analyzer (CO Measurer mod. T15v; Langan Products, Inc. San Francisco, CA, USA - Nominal concentration range: 0-200 ppm; Resolution: 0,05 ppm) consisting of an electrochemical cell that allows continuous monitoring over several days. Measured concentrations and temperature were recorded via an internal data logger with an acquisition time of 30 seconds. The instruments were calibrated in a glove bag before every monitoring campaign with two different certified–concentration standard gases (< 0.5 ppm and 10.3 ppm). Data were downloaded using the factory–supplied software and corrected as a function of temperature using an experimental quadratic equation.
12
ACCEPTED MANUSCRIPT
ACCEPTED MANUSCRIPT Data Analysis For this study, the data were gathered in 4 dimensional classes: UFPs (0.02–1 µm), 2 different classes of fine particles (FP’: 0.3–1 µm; FP: 1–2.5 µm) and coarse particles (CP: > 2.5 µm); this classification was implemented on the basis of the high correlation defined between the various dimensional classes determined by the OPC. The collected data were
Downloaded by [Andrea Spinazzè] at 08:22 22 August 2013
examined and handled to provide for the exclusion of zero values and missing data (casewise deletion), and synchronized in function of their acquisition interval following good practice in statistics(51-53) Statistical analysis of collected data was performed via PASW Statistics 18.0; analysis consists of non–parametric tests to analyze data distribution (Kolmogorov–Smirnoff test – KS) and to assess the differences among groups (Kruskal–Wallis one–way ANOVA – KW). To refine data analysis, we performed a non–parametric significance test (Mann– Whitney U–test – MW) to point out statistically significant differences among groups of variables and to determine whether the observations from both groups are independent of each other. Finally, another non–parametric test (tau test) was used to evaluate the association between measured pollutants in each ME. RESULTS In total, N = 17,562 data observations were collected using the three instruments, of which, respectively, N = 16,264 were valid for CPC, N = 16,983 for OPC, and N = 13,341 for the CO analyser (a more detailed summary is shown in table I); some samples were lost due to data–logging errors or alcohol wick depletion. Analysis of Measured Data
13
ACCEPTED MANUSCRIPT
ACCEPTED MANUSCRIPT Measurements were analyzed on the basis of the considered variables (MEs, seasons, days of the week, and period of the day); statistically significant differences were found (pKW < 0.05) for every variable and group of variables (pMW < 0.05). Thus, data analysis shows that concentrations was specific to each sampled ME and time period. Microenvironmental variations
Downloaded by [Andrea Spinazzè] at 08:22 22 August 2013
The highest median concentration and the widest data variability (Table II) were observed for CO and UFPs while walking along busy streets (‘W1’ and ‘W2’), and moving by motorized vehicles, like buses (B) and cars (C). The highest concentrations of FP’, FP, and CP were measured in metro trains. In particular, the FP fraction shows the highest median value and widest difference among the considered MEs (always with pMW < 0.05). On the contrary, the lowest median concentrations were typically observed in green areas (P) and in the indoor environment (IN), both for particles and CO (pMW < 0.05 compared to all the other MEs). The variability and mean concentrations obtained in the other MEs generally fall between these values and are comparable to each other. Measured particle concentrations within a variety of indoor and outdoor MEs were affected by significant variability among some indoor MEs and relative homogeneity in outdoor MEs, as outlined in Levy et. al.(13). It has already been shown that the mode of transport has a very large influence on personal exposure to UFP(54-55,), and CO(56). Further, route choice and behavioural factors are likely to also be important determinants of exposure.(54,57-58) As expected, road traffic appears to be the most relevant determinant of PM (especially the finer fractions) and CO, as the highest concentrations were detected in traffic–
14
ACCEPTED MANUSCRIPT
ACCEPTED MANUSCRIPT related environments (‘B’, ‘C’, ‘W1’, ‘W2’). As outlined in a recent review article, vehicle emissions are the dominant source of UFPs(38). Further, whereas some studies report higher levels of PM in metro systems compared to other modes of transport and street canyons or ambient air, (31,59) other studies report lower levels in metro systems.(60) The main explanation given for the high levels in metro systems in most cases is the wear of steel from friction between wheel and rail, wear of brakes, and vaporization of metals due to sparking involving
Downloaded by [Andrea Spinazzè] at 08:22 22 August 2013
the third rail. Further, other sources were identified including brake shoes, passenger activities, the train piston effect (airflow at the front of the platform), and floor cleaning. Tunnels, ventilation, and traffic of trains were suggested to be other important determinants of high levels of exposure to PM. Regarding coarse PM, the role of resuspension of particles from the floor and of personal clouds should not be neglected, owing to the high density of occupants in some transport modes(61). This hypothesis seems to be confirmed by the high concentrations measured not only in UG, but also in the T and B MEs. Thus, as outlined by several studies,
(62-63)
measured concentrations in transport MEs are clearly dependent on
mode of transport, time of day, and proximity to sources, as well as source characteristics. Seasonal variation Analysis of seasonal variation of concentrations reveals several trends among PM size fractions (Table III). The highest median concentrations and variability of measurement were observed during winter and autumn for UFPs andPM, while the lowest values were measured in summer. With respect to CO, the highest concentration and variability of measurements were observed during summer, while lower values were measured in autumn.
15
ACCEPTED MANUSCRIPT
ACCEPTED MANUSCRIPT Published studies for Milan show a strong seasonal effect in PM concentration values, mainly due to differences in average dispersion conditions of the atmosphere in summer and winter.(32, 34) PM mass concentrations show strong seasonal variability, which is more evident for the finer particle–sizes, with higher values in winter. This seasonal modulation is, essentially, more linked to differences in average thermodynamic and meteorological conditions of the atmosphere than to variations of the type or number of emitting sources.
Downloaded by [Andrea Spinazzè] at 08:22 22 August 2013
However, the observed seasonal behaviour of particulate concentrations may also be ascribed to the presence of additional emission sources (i.e., domestic heating) during the cold season, which contributes to primary PM as well as to secondary aerosol production because of the large emission of gaseous precursors. This seasonal trend is confirmed in a study conducted in residential premises near Milan, with findings of higher CP concentrations in summer than in winter.(64) Daily variation Concentrations measured during working days (Table IV) show higher mean values and wider data distributions in comparison with those collected on non–working days for UFPs, PM and CO. The highest particle concentrations were observed during the monitoring sessions on Tuesdays (UFPs and PM), while the highest median concentration of CO was reached on Mondays (This latter result, however, may be due to the small number of data collected during the Monday session - table 1 -, which could have resulted in a bias for median CO levels). The lowest median values were measured, as expected, on Saturdays or Sundays both for particles and for CO. Differences between non–working days and working
16
ACCEPTED MANUSCRIPT
ACCEPTED MANUSCRIPT days were always statistically significant (pMW < 0.05), while differences among working days showed higher values of significance (0.096 < pMW < 0.968). The lower concentration measured during non–working days may be interpreted in light of the decrease in traffic volumes (especially heavy–vehicles) and reduced contributions from industrial emissions on those days. In the case of coarse particles, a reduced contribution
Downloaded by [Andrea Spinazzè] at 08:22 22 August 2013
from tire abrasion products and soil dust resuspension from streets can explain the low concentration measured on non–working days, as previously observed for PM mass concentrations.(32) Variation among periods of the day Analysis of concentrations collected during three different periods of the day (Table V) reveals statistically significant differences (pMW < 0.05) between the morning sessions (AM) and the remainder of the day for UFP, PM, and CO. Data variability and mean concentrations obtained during the afternoon sessions (Early Afternoon – EA, and Late Afternoon – LA) were generally lower (and comparable to each other (pMW > 0.05). It should be remembered that PM mass concentrations show great daily variability related to meteorological variables and thermodynamic conditions of the atmosphere and, in particular, to the height of the mixing layer.(32) However, the AM monitoring sessions were performed during rush hours characterised by heavy traffic and commuting, in contrast with the afternoon sessions, in which commuting flows and traffic were less intensive. Thus, daily variations in concentrations are likely influenced by differences in traffic volumes and
17
ACCEPTED MANUSCRIPT
ACCEPTED MANUSCRIPT corresponding emissions: this is in agreement with the behaviour shown by CO and UFP (lower median concentrations in EA); while for size–resolved particles, this trend is only partially observed. This finding is reported in several studies that identify traffic–related parameters as significant determinants of exposure to PM and CO. (62, 63,-66-67) Relationships among air pollutants
Downloaded by [Andrea Spinazzè] at 08:22 22 August 2013
Finally, a non–parametric hypothesis test (Tau test) is used to measure the association between the measured pollutants in each ME; the results are generally always statistically significant (p < 0.01) and are shown in Table VI. The strongest correlations are determined for CP vs. FP and for FP’ vs. FP, while the correlations among other dimensional fractions and between particles and CO are weaker, due probably to the different physical states. UFPs may be not strongly correlated with the different PM size fractions, as they are the result of nucleation of low vapour pressure compounds, while fine particles and CP are typically formed through other processes (e.g., coagulation–accumulation, atmospheric chemical reactions, mechanical–abrasion processes, resuspension from the ground). On the contrary, FP, FP’, and CP are better correlated, as they are partially composed of particles with the same origin, such as nitrates and crustal elements.(68) UFPs may be not strongly correlated with the different PM size fractions, as they are the result of nucleation of low vapor pressure compounds, while fine particles and CP are typically formed through other processes (e.g., coagulation–accumulation, atmospheric chemical reactions, mechanical–abrasion processes, resuspension from the ground). On the
18
ACCEPTED MANUSCRIPT
ACCEPTED MANUSCRIPT contrary, FP, FP’, and CP are better correlated, as they are partially composed of particles with the same origin, such as nitrates and crustal elements(68). It is possible to observe that some MEs show similar behaviour: the MEs typically associated to urban traffic (W1, W2, B, C) show similar correlations and the strongest correlations between UFPs and CO, pointing out these two pollutant are mainly produced
Downloaded by [Andrea Spinazzè] at 08:22 22 August 2013
from urban traffic(29). UG shows the highest correlation recorded between the FP and CP, highlighting the presence of a localized source of coarse particles, as already discussed earlier. Finally, the indoor ME (IN), shows levels of correlation between the pollutants to be substantially different and lower from those observed at the other microenvironments, while P and CR show correlation values very similar to each other, and intermediate with respect to the correlations determined for the other MEs, probably due to the presence of non-localized sources for these MEs. DISCUSSION The highest concentrations CO and UFPs occurs while moving along busy streets or in their immediate environs, either afoot (‘W1’) or by motorized vehicle (‘B’ and ‘C’), as shown in recent studies.(7,56) Different considerations are required for PM: highest concentrations to FP’, FP, and CP is detected during time spent in the metro (‘UG’). For all pollutants considered, the lowest concentrations are detected in an office environment (‘IN’) and in a green area (‘P’). The concentrations measured in vehicles with instruments and in conditions similar to those adopted in this study (driving along a very busy street with closed windows) are comparable to the ones reported in similar international researches and consistent with
19
ACCEPTED MANUSCRIPT
ACCEPTED MANUSCRIPT literature(11,13) implying that individual exposures can depend on ME’s concentration condition. Considering the variation of concentration as function of time, an appreciable and statistically significant difference between working and non–working days is observed for CO, UFPs, and PM: all the highest concentrations are observed during working days, while
Downloaded by [Andrea Spinazzè] at 08:22 22 August 2013
lower values are measured on Saturdays and Sundays. Moreover, analysis of concentrations collected during different periods of the day reveals a general traffic–related trend, both for particles (UFPs) and CO. Analysis of temporal variability of collected measures within the week reveals relevant differences between weekdays and the rest of the week. Sunday is characterized by lower concentration values, while UFPs levels measured on Saturday lie in an intermediate position between Sunday and the working days. A similar behaviour have been observed for data variability: the most wide-spread distributions have been found during weekdays. The concentrations observed in different days of the week confirms a relationship with traffic trends, similarly to what described in other international research studies(10,11,36,69,70), where the diurnal particle number concentration profiles show that the bulk of the particulate matter measured on weekdays comes from anthropogenic sources that are dominant on weekdays (probably traffic as opposed to domestic heating). The impact of traffic intensity on measured concentrations is also highlighted looking at the distributions of UFP and PM concentrations according to three different diurnal time periods are displayed. Indeed, more wide-spread distributions and higher particle number concentrations were measured during rush hours (08:00-10:30), when an increase of particle emissions is caused by the elevated number of circulating vehicles. Similarly to other European cities(69,71,72),
20
ACCEPTED MANUSCRIPT
ACCEPTED MANUSCRIPT peaks of concentrations were found in the morning, between 7.00 and 11.00 a.m., while in the evening measured UFP levels are slightly higher than during the central hours of daytime. Similar weekday diurnal profiles of PNC and CO, with a major morning peak and in some instances a late afternoon peak, have been identified by others(10,11 36,73,74). Finally, regarding seasonal variation, the highest concentrations are observed in winter
Downloaded by [Andrea Spinazzè] at 08:22 22 August 2013
and autumn for UFP and PM, and in summer for CO: seasonal pattern affects all sites, with highest concentrations in the winter months and lowest concentrations in the summer. Atmospheric mixing processes are generally poorer in the winter months leading to less adequate dispersion and higher concentrations. CONCLUSIONS Continuous real-time monitoring can provide the information necessary to define the influence of a local source or changes in local circumstances on particulate matter counts or mass concentrations. In addition, continuous monitoring permit to evaluate short-term particle concentrations(75). Although this study demonstrated temporal and spatial variability for the studied microenvironments, the study design and methods imply some limitations in the generalizability of these findings: measurements were taken within the Milan area, and the microenvironments evaluated in our study may not correspond directly to similar microenvironments elsewhere. Interpretation of particle count concentration data is limited by the fact that the PNC for UFPs include particles > 100 nm (from 20 to 1000 nm).Finally, although the categories of microenvironments were chosen to reflect common urban activities and general trends, the specific locations were selected according to a systematic and
21
ACCEPTED MANUSCRIPT
ACCEPTED MANUSCRIPT technical protocol, but they may not be representative of the average concentrations in that microenvironment across Milan or in other cities. Nevertheless, the patterns in PNC and CO are demonstrative of relationships that would remain consistent in a broader investigation. This study has favored the accuracy in individual measurement strategy (using portable instruments), rather than the instrumental accuracy. Future studies should focus on the assessment of personal exposure to nanoparticles and/or UFPs (mass, number and surface area
Downloaded by [Andrea Spinazzè] at 08:22 22 August 2013
concentrations). Moreover, the use of micro-environmental models should be encouraged for estimating the total daily exposure of general populations. Acknowledgements A special acknowledgment to dr. Stefano Taronna and dr. Greta Peverelli for their fundamental contribution to the realization of this study.
REFERENCES 1. Marcazzan G.M., G. Valli, R. Vecchi: Factors influencing mass concentration and chemical composition of fine aerosols during a PM high pollution episode. Sci Total Environ 298:65–79 (2002). 2. Knibbs L.D., T. Cole–Hunter, L. Morawska: A review of commuter exposure to ultrafine particles and its health effects. Atmos Environ 45:2611–22 (2011).
22
ACCEPTED MANUSCRIPT
ACCEPTED MANUSCRIPT 3. Adams, H.S., M.J. Nieuwenhuijsen, R.N. Colvile, , M.A.S. McMullen and
P.
Khandelwal: Fine particle (PM2.5) personal exposure levels in transport microenvironments, London, UK. Sci Total Environ. 279:29–44 (2001). 4. Gulliver J., D.J. Briggs: Personal exposure to particulate air pollution in transport microenvironments. Atmos Environ 38:1–8 (2004).
Downloaded by [Andrea Spinazzè] at 08:22 22 August 2013
5. Beck–Speier I., N. Dayal, E. Karg, K.L. Maier, C. Roth, A. Ziesenis, J. Heyder: Agglomerates of ultrafine particles of elemental carbon and TiO2 induce generation of lipid mediators in alveolar macrophages. Environ Health Perspect. 109:613–8 (2001). 6. Peters A., H. Wichmann, T. Tuch, J. Heinrich, J. Heyder: Respiratory effects are associated with the number of ultrafine particles. Am J Respir Crit Care Med 155:1376–83 (1997). 7. Cattaneo A., G. Garramone, M. Taronna, C. Peruzzo, D.M. Cavallo: Personal exposure to airborne ultrafine particles in the urban area of Milan. J Phys Conf Ser 2009;doi:10.1088/1742– 6596/151/1/012039. 8. Kaur S., M. Nieuwenhuijsen, R. Colvile: Personal exposure of street canyon intersection users to PM2.5, ultrafine particle counts and carbon monoxide in Central London, UK. Atmos Environ; 39:3629–41 (2005). 9. Borsós T., D. Řimnáčová, V. Ždímal, J. Smolík, Z. Wagner, T. Weidinger, et al.:Comparison of particulate number concentrations in three Central European capital cities. Sci Tot Env 433: 418–426 (2012)
23
ACCEPTED MANUSCRIPT
ACCEPTED MANUSCRIPT 10. Harrison R.M., A. M . Jones. Multisite study of Particle Number Concentrations in urban air. Environ Sci Technol 39: 6063-6070 (2005) 11. Hussein T., A. Puustinen, P.P. Aalto, J.M. Makela, K. Hameri, M. Kulmala: Urban aerosol number size distributions. Atmos Chem Phys 4: 391-411 (2004).
12. Wu D.L., Lin M., Chan C.Y., W.Z. Li, J. Tao, Y.P. Li, et al. “Influences of Commuting
Downloaded by [Andrea Spinazzè] at 08:22 22 August 2013
Mode, Air Conditioning Mode and Meteorological Parameters on Fine Particle (PM2.5) Exposure Levels in Traffic Microenvironments”. Aerosol and Air Quality Research, 13: 709–720 (2013). 13. Levy J.I., E.A. Houseman, L. Ryan, D. Richardson, J.D. Spengler: Particle concentrations in urban microenvironments. Environ Health Persp; 108:1051–7 (2001) 14. Weijers E.P., A.Y. Khlystov, G.P.A. Kos, J. W. Erisman: Variability of particulate matter concentrations along roads and motorways determined by a moving measurement unit. Atmos. Environ. 38: 2993-3002 (2004) 15. Binnig J., J. Meyer, G. Kasper: Calibration of an optical particle counter to provide PM2.5 mass for well-defined particle materials. Aerosol Science 38: 325 – 332 (2007).
24
ACCEPTED MANUSCRIPT
ACCEPTED MANUSCRIPT 16. Dockery, D.W., C.A. Pope, X. Xu , J.D. Spengler, J.D. Ware, M.E. Fay, et al.: An association between air pollution and mortality in six US cities. N Engl J Med 329: 1753–59 (1993). 17. Pope, C. A., M.J. Thun, M.M. Namboodiri, , D.W. Dockery, , J.S. Evans, F.E. Speizer, C.W. Heath: Particulate air pollution as a predictor of mortality in a prospective study of US adults. Am J Respir Crit Care Med 151: 669–74 (1995).
Downloaded by [Andrea Spinazzè] at 08:22 22 August 2013
18. Schwartz, J., G. Norris, T. Larson, L. Sheppard, C. Claiborne, J. Koenig: Episodes of high coarse particle concentrations are not associated with increased mortality. Environ Health Perspect, 107(5), 339. (1999). 19. American Thoracic Society, Committee of the Environmental and Occupational Health: Health effects of outdoor pollution. Am J Respir Crit Care Med 153:3–50 (1996) 20. Oberdörster G, E. Oberdörster, J. Oberdörster: Nanotoxicology: An Emerging Discipline Evolving from Studies of Ultrafine Particles. Environ Health Perspect. 113(7): 823– 839 (2005). 21. Schlesinger R.B.: Deposition and Clearance of Inhaled Particle. In Concepts In Inhalation Toxicology, second edition. R.O. McClella and R.F. Henderson (ed) pp. 191-224. London, CRC Press, 1995.
22. Schulz H., V. Harder, A. Ibald-Mulli, A. Khandoga, W. Koenig, F. Krombach, et al.: Cardiovascular effects of fine and ultrafine particles. J Aerosol Med 18:1–24 (2005).
25
ACCEPTED MANUSCRIPT
ACCEPTED MANUSCRIPT 23. Daigle C.C., D.C. Chalupa, F.R. Gibb, P.E. Morrow, G. Oberdörster, M.J. Utell, M.W. Frampton: Ultrafine particle deposition in humans during rest and exercise. Inhal Toxicol 15:539–552 (2003). 24. Frampton M.W.: Does inhalation of ultrafine particles cause pulmonary vascular effects in humans? Inhal Toxicol 19(1):75–9 (2007).
Downloaded by [Andrea Spinazzè] at 08:22 22 August 2013
25. Phalen R.F., M.J. Oldham: Aerosol dosimetry considerations. Clin Occup Environ Med 5:773–84 (2006). 26. Pietropaoli A.P., M.W. Frampton, R.W. Hyde, P.E. Morrow, G. Oberdörster, C. Cox, et al.: Pulmonary function, diffusing capacity, and inflammation in healthy and asthmatic subjects exposed to ultrafine particles. Inhalation toxicology 16.s1: 59-72 (2004). 27. Samet J.M., D.M. Demarini, H.V. Malling: Do airborne particles induce heritable mutations? Science, 304.5673: 971-972 (2004). 28. Kittelson D.B.: Engines and nanoparticles: A review. J Aerosol Sci 29:575–88 (2008). 29. Morawska L., J. Zhang Combustion sources of particles. 1. Health relevance and source signatures. Chemosphere 49 : 1045–1058 (2002)
30. Lonati G., S. Ozgen, I. Luraghi, M. Giugliano: Particle number concentration at urban microenvironments. Chem Eng Trans 22:137–42 (2010). 31. Lonati G., S. Ozgen, G. Ripamonti, S. Cernuschi, M. Giugliano: Pedestrian exposure to size–resolved particles in Milan. J Air Waste Manage Assoc 61:1273–1280 (2011).
26
ACCEPTED MANUSCRIPT
ACCEPTED MANUSCRIPT 32. Marcazzan G.M., M. Ceriani, G. Valli, R. Vecchi: Source apportionment of PM10 and PM2.5 in Milan (Italy) using receptor modeling. Sci Total Environ 317:137–47 (2003). 33. Giugliano M., G. Lonati, P. Butelli, L. Romele, R. Tardivo, M. Grosso: Fine particulate (PM2.5–PM1) at urban sites with different traffic exposure. Atmos Environ 39:2421–31 (2005). 34. Vecchi R., G. Marcazzan, G. Valli, M. Ceriani, C. Antoniazzi: The role of atmospheric
Downloaded by [Andrea Spinazzè] at 08:22 22 August 2013
dispersion in the seasonal variation of PM1 and PM2.5 concentration and composition in the urban area of Milan (Italy). Atmos Environ 38:4437–46 (2004). 35. Viana M., T.A.J. Kuhlbusch, X. Querol, A. Alastuey, R.M. Harrison, P.K. Hopke, et al.: Source apportionment of particulate matter in Europe: A review of methods and results. J Aerosol Sci 39:827–49 (2008). 36. Cyrys J., M. Stolzel, J. Heinrich, W.G. Kreyling, N. Menzel, K. Wittmaack, et al.: Elemental composition and sources of fine and ultrafine ambient particles in Erfurt, Germany Sci Tot Environ, 305: 143–156 (2003).
37. Shi J.P., A.A. Khan, R.M. Harrison: Measurements of ultrafine particle concentration and size distribution in the urban atmosphere. Sci Tot Environ, 235: 51–64 (1999). 38. Morawska L., Z. Ristovski, E.R. Jayaratne, D.U. Keogh, X. Ling: Ambient nano and ultrafine particles from motor vehicle emissions: Characteristics, ambient processing and implications on human exposure. Atmos Environ 42:8113–38 (2008).
27
ACCEPTED MANUSCRIPT
ACCEPTED MANUSCRIPT 39. Flachsbart P.G.: Human exposure to carbon monoxide from mobile sources. Chemosphere 1:301–29 (1999). 40. Morris R.D.: Low–level carbon monoxide and human health. In: Carbon monoxide toxicity. D.G. Penney (ed) pp. 381–391. London: CRC Press, 2000. 41. Townsend C.L., R.L. Maynard: Effects on health of prolonged exposure to low
Downloaded by [Andrea Spinazzè] at 08:22 22 August 2013
concentrations of carbon monoxide. Occup Environ Med 59:708–11 (2002). 42. Allred, E.N., E.R. Bleecker, B.R. Chaitman, T.E. Dahms, S.O. Gottlieb, J.D. Hackney, et al.: Short–term effects of carbon monoxide exposure on the exercise performance of subjects with coronary artery disease. N Engl J Med. 321:1426–32 (1989). 43. Burnett R.T., R.E. Dales, J.R. Brook, M.E. Raizenne, D. Krewski: Association between ambient carbon monoxide levels and hospitalizations for congestive heart failure in the elderly in 10 Canadian cities. Epidemiology 8:162–67 (1997).
44. Chen T.M., J. Gokhale, S. Shofer, W.G. Kuschner: Outdoor air pollution: Nitrogen dioxide, sulfur dioxide, and carbon monoxide health effects. Am J Med Sci 333(4):249–256 (2007). 45. Reboul C., J. Thireau, G. Meyer, L. André, P. Obert, O. Cazorla, S. Richard: Carbon monoxide exposure in the urban environment: An insidious foe for the heart? Respir. Physiol. Neurobiol. 184(2):204-212 (2012).
28
ACCEPTED MANUSCRIPT
ACCEPTED MANUSCRIPT 46. Yang W., B.L. Jennison, S.T. Omaye: Cardiovascular disease hospitalization and ambient levels of carbon monoxide. J Toxicol Environ Health A 55;185–96 (1998). 47. Biggeri A., M. Baccini, P. Bellini, B. Terracini: Meta–analysis of the Italian studies on short–term effects of air pollution (MISA) 1990–1999. Int J Occup Environ Health 11:107–22 (2005).
Downloaded by [Andrea Spinazzè] at 08:22 22 August 2013
48. Rodes C.E., J.W. Thornburg: Breathing zone exposure assessment. In: Aerosols handbook: Measurement, dosimetry, and health effects. L.S. Ruzer, N.H. Harley (ed) pp. 61–74. Boca Raton: CRC Press, 2005. 49. Cattaneo A, M. Taronna, G. Garramone, C. Peruzzo, C. Schlitt, D. Consonni, D.M. Cavallo: Comparison between personal and individual exposure to urban air pollutants. Aerosol Sci Technol. 44:370–9 (2010). 50. Buonanno G., F..C. Fuoco, L. Stabile: Influential parameters on particle exposure of pedestrians in urban microenvironments. Atmos Environ 45:1434–43 (2011).
51. Robakiewicz P., E.F. Ryder: Statistic: Detecting differences Among groups. In Current protocols in protein Science (commonly used techniques). Supplement 21: A.3 G.1-A.3G.22 New York: John and Wiley & Sons, Inc., 2000. 52. Norman G, D.L. Streiner: Biostatistica: Quello che avreste voluto sapere. Milano: Casa Editrice Ambrosiana – Zanichelli, 2000
29
ACCEPTED MANUSCRIPT
ACCEPTED MANUSCRIPT 53. Miller, J.N., J.C. Miller: Statistics and Chemiometrics for Analytical Chemistry. Fifth Edition. Harlow. Pearson Education Ltd, 2005. 54. Kaur S., M.J. Nieuwenhuijsen, R.N. Colvile: Fine particulate matter and carbon monoxide exposure concentrations in urban street transport microenvironments. Atmos Environ; 41: 4781– 4810 (2007).
Downloaded by [Andrea Spinazzè] at 08:22 22 August 2013
55. Kaur S., M.J. Nieuwenhuijsen: Determinants of personal exposure to PM2.5, ultrafine particle counts, and CO in a transport microenvironment. Environ Sci Technol 43:4737–43 (2009). 56. Duci A., A. Chaloulakou, N. Spyrellis: Exposure to carbon monoxide in the Athens urban area during commuting. Sci Total Environ 309:47–58 (2003). 57. Hertel O., M. Hvidberg, M. Ketzel, L. Storm, L. Stausgaard: A proper choice of route significantly reduces air pollution exposure – a study on bicycle and bus trips on urban streets. Sci Tot Env 389;58–70 (2008). 58. McCreanor J., P. Cullinan, M.J. Nieuwenhuijsen, J. Stewart–Evans, E. Malliarou, L. Jarup, R. et al.: Respiratory effects of exposure to diesel traffic in persons with asthma. New Engl J Med 357:2348–2358 (2007).
59. Colombi C., S. Angiu, V. Gianelle, M. Lazzarini: Particulate matter concentrations, physical characteristics and elemental composition in the Milan underground transport system. Atmos Environ 70: 166–178 (2013).
30
ACCEPTED MANUSCRIPT
ACCEPTED MANUSCRIPT 60. Nieuwenhuijsen M.J., J.E. Gomez–Perales, R.N. Colvile: Review: Levels of particulate air pollution, its elemental composition, determinants and health effects in metro systems. Atmos Environ 41:7995–8006 (2007). 61. Thatcher T.L., D.W. Layton: Deposition, resuspension, and penetration of particles within a residence. Atmos Environ 29:1487–97 (1995).
Downloaded by [Andrea Spinazzè] at 08:22 22 August 2013
62. Dor F., Y. Le Moullec, B. Festy: Exposure of city residents to carbon monoxide and monocyclic aromatic hydrocarbons during commuting trips to Paris metropolitan area. J Air Waste Manage Assoc 45:103–10 (1995). 63. Rank J., J. Folke, P. Jesperen: Differences in cyclists and car drivers exposure to air pollution from traffic in the city of Copenhagen. Sci Total Environ 279:131–6 (2001). 64. Cattaneo A., C. Peruzzo, G. Garramone, P. Urso, R. Ruggeri, P. Carrer, D.M. Cavallo: Airborne particulate matter and gaseous air pollutants in residential structures in Lodi province, Italy. Indoor Air 21:489–500 (2011). 65. Kaur S., R. Clark P. Walsh S.J. Arnold, R.N. Colvile, M. Nieuwenhuijsen: Exposure visualisation of ultrafine particle counts in a transport microenvironment. Atmos Environ 40(2):386 (2006).
66. Koushki P.A., K.H. Al–Dhowalia, S.A. Niazi: Vehicle occupant exposure to carbon monoxide. J Air Waste Manag Assoc 42(12):1603 (1992).
31
ACCEPTED MANUSCRIPT
ACCEPTED MANUSCRIPT 67. Zagury E., Y. Le Moullec, I. Momas: Exposure of Paris taxi drivers to automobile air pollutants within their vehicles. Occ Env Med 57:406 (2000). 68. Kleeman M.J., G.R. Cass: Source contributions to the size and composition distribution of urban particulate air pollution. Atmos Environ 32:2803–2816 (2008). 69. Aalto P., K. Hämeri , P. Paatero , M. Kulmala, T. Bellander , N. Berglind, et al.: Aerosol
Downloaded by [Andrea Spinazzè] at 08:22 22 August 2013
particle number concentration measurements in five european cities using TSI-3022 condensation particle counter over a three-year period during health effects of air pollution on susceptible subpopulations J. Air Waste Manage. Assoc. 55 1064–76 (2005). 70. Wåhlin P., F. Palmgren, R. Van Dingenen: Experimental studies of ultrafine particles in streets and the relationship to traffic Atmos. Environ. 35 (Suppl. 1) S63-S69 (2001). 71. Diapouli E., A. Chaloulakou,
N. Spyrellis: Levels of ultrafine particles in different
microenvironments - Implications to children exposure Sci. Total Environ. 388 128-36 (2007). 72. Marconi A., Cattani G., Cusano M., Ferdinandi M., Inglessis M., Viviano G., et al.: Two-years of fine and ultrafine particles measurements in Rome, Italy J. Toxicol. Env. Heal. A 70 213-21 (2007).
73. Molnar, P., S. Janhall, M. Hallquist: Roadside measurements of fine and ultrafine particles at a major road north of Gothenberg. Atmos. Environ. 36:4115-4123 (2002).
32
ACCEPTED MANUSCRIPT
ACCEPTED MANUSCRIPT 74. Gomiscek, B., H. Hauck, S. Stopper, O. Preining: Spatial and temporal variations of PM1, PM2.5, PM10 and particle number concentration during the AUPHEP-project. Atmos. Environ. 38:,3917-3934 (2004). 75. Brauer, M., R.D. Hirtle, A.C. Hall, T.R. Yip: Monitoring personal fine particle exposure
Downloaded by [Andrea Spinazzè] at 08:22 22 August 2013
with a particle counter. J Expo Anal Environ Epidemiol 9:228–236 (1999).
FIGURE 1. Milan’s urban area monitoring route (adapted from Google Maps, Google Maps © 2012 Google); Legend: IN = indoor (office); CR = Multi-road intersection; W1 & W2 (dotted line) = walk in busy streets; B = bus (continuous line); UG = metro (dash-double dot line); P = urban green area (dash-dot line); C = car (dashed line)
33
ACCEPTED MANUSCRIPT
ACCEPTED MANUSCRIPT TABLE I. Summary of the valid observations collected using the three instruments, in each microenvironment and in each time bin. MICROENVIRONMENT T
W1
UG
P
CR
B
W2
C
IN
UFP
3,091
1,957
722
1,891
1,215
2,172
1,127
2,664
1,425
CO
2,623
1,569
575
1,517
978
1,731
943
2,160
1,245
Size-resolved PM
3,187
2,000
725
1,904
1,244
2,281
1,194
2,880
1,568
Downloaded by [Andrea Spinazzè] at 08:22 22 August 2013
WEEKDAY Mon
Tue
Wed
Thu
Fri
Sat
Sun
UFP
1,366
2,148
2,367
2,490
2,409
2,328
3,156
CO
801
1,818
2,512
1,686
1,691
1,584
3,249
Size-resolved PM
1,680
2,292
2,512
2,437
2,461
2,352
3,249
MONITORING SESSION 08:00-10:30
12:00 - 14:30
16:00-18:00
UFP
5,566
5,291
5,407
CO
4,656
4,373
4,312
Size-resolved PM
5,949
5,400
5,634
SEASON July
Oct-Nov
Feb-Mar
UFP
5,260
6,273
4,731
CO
6,054
2,481
4,806
Size-resolved PM
5,543
6,697
4,743
Notes: IN = indoor (office); CR = Multi-road intersection; W1 & W2 (dotted line) = walk in busy streets; B = bus (continuous line); UG = metro (dash-double dot line); P = urban green area (dash-dot line); C = car (dashed line); T = ‘transition’ environments. UFP: valid observations collected with TSI P-TRAK CPC; CO: valid observation collected with Langan CO analyzer; Size-resolved PM: valid observations collected with Lighthouse 3016 OPC. UFP, CO and Sizeresolved PM data were measured with a monitoring frequency of 30 seconds (averaging time)
34
ACCEPTED MANUSCRIPT
ACCEPTED MANUSCRIPT
TABLE II. Median concentration and Median Absolute Deviation (MAD) of CO [ppm], UFP,
Downloaded by [Andrea Spinazzè] at 08:22 22 August 2013
FP', FP, CP [pt/cm3] in different urban transport MEs
MICROENVIRONMENT
CO UFP FP’ FP CP
Median
T
W1
UG
P
CR
B
W2
C
IN
1,26
1,59
1,34
0,96
1,18
1,88
1,80
2,45
1,06
MAD
0,77
0,65
0,37
0,36
0,41
0,68
1,23
0,88
0,48
Median
2,47E+4
3,30E+4
2,27E+4
1,46E+4
2,55E+4
4,36E+4
4,37E+4
5,40E+4
1,05E+4
MAD
2,06E+4
2,9 E+4
8,32E+3
1,20E+4
1,62E+4
2,36E+4
2,97E+4
3,27E+4
1,03E+4
Median
1,26E+2
1,29E+2
1,92E+2
1,25E+2
1,27E+2
1,16E+2
1,19E+2
1,14E+2
6,12E+1
MAD
1,37E+2
1,41E+2
1,13E+2
1,46E+2
1,44E+2
1,13E+2
1,33E+2
1,29E+2
8,37E+1
Median
1,22E+0
9,29E-1
7,74E+0
6,84E-1
8,39E-1
2,09E+0
1,01E+0
1,20E+0
5,64E-1
MAD
5,80E+0
8,33E-1
1,03E+1
1,0 E+0
9,37E-1
1,48E+0
1,26E+0
7,10E-1
1,29E+0
Median
5,21E-1
4,45E-1
2,50E+0
3,71E-1
3,78E-1
9,84E-1
4,99E-1
5,72E-1
2,80E-1
MAD
2,71E+0
3,54E-1
4,32E+0
4,13E-1
1,96E-1
8,23E-1
2,65E+0
2,78E-1
6,37E-1
Notes. Particles’ size ranges: UFP: 0.02–1 µm, FP’: 0.3–1 µm; FP: 1–2.5 µm; CP: > 2.5 µm. Microenvironments: IN = indoor; CR = Multi-road intersection; W1 & W2 = walk in busy streets; B = bus; UG = metro; P = urban green area; C = car; T = ‘transition’ environments . Variables: UFP: valid observations collected with TSI P-TRAK CPC; CO: valid observation
35
ACCEPTED MANUSCRIPT
ACCEPTED MANUSCRIPT collected with Langan CO analyzer; Size-resolved PM: valid observations collected with Lighthouse 3016 OPC.
TABLE III. Median concentration and Median Absolute Deviation (MAD) of CO [ppm],
Downloaded by [Andrea Spinazzè] at 08:22 22 August 2013
UFPs, FP', FP, CP [pt/cm3] in different seasons
SEASON July CO [ppm] UFP [pt/cm3] FP' [pt/cm3] FP [pt/cm3] CP [pt/cm3]
Median MAD Median MAD Median MAD Median MAD Median MAD
1,55 8,20E-1 1,94E+4 2,05E+4 8,15E+1 4,46E+1 6,73E-1 6,39E+0 4,32E-1 3,01E+0
36
Oct-Nov 1,29 6,81E-1 3,57E+4 2,81E+4 1,62E+2 1,26E+2 1,81E+0 1,31E+0 5,88E-1 6,59E-1
Feb-Mar 1,37 8,13E-1 2,72E+4 2,58E+4 1,54E+2 1,71E+2 1,28E+0 1,55E+0 5,03E-1 4,87E-1
ACCEPTED MANUSCRIPT
ACCEPTED MANUSCRIPT
Notes: Particles’ size ranges: UFP: 0.02–1 µm, FP’: 0.3–1 µm; FP: 1–2.5 µm; CP: > 2.5 µm.
TABLE IV. Median concentration and Median Absolute Deviation (MAD) of CO [ppm], UFPs,
Downloaded by [Andrea Spinazzè] at 08:22 22 August 2013
FP', FP, CP [pt/cm3] on different days of the week
WEEKDAY
CO
UFP
FP’
FP
CP
Median
Mon 2,33
Tue 1,18
Wed 1,51
Thu 1,61
Fri 1,80
Sat 1,22
Sun 1,23
MAD
8,13E-1
5,87E-1
1,07E+0
7,19E-1
9,50E-1
5,10E-1
5,42E-1
Median
2,89E+4
3,79E+4
3,19E+4
3,39E+4
3,22E+4
1,76E+4
1,86E+4
MAD
2,42E+4
3,22E+4
2,67E+4
2,40E+4
2,70E+4
1,85E+4
2,19E+4
Median
1,25E+2
3,08E+2
1,04E+2
1,16E+2
1,41E+2
8,47E+1
9,27E+1
MAD
7,14E+1
1,86E+2
5,09E+1
6,87E+1
1,06E+2
4,42E+1
1,75E+2
Median
1,52E+0
2,21E+0
8,36E-1
1,20E+0
1,73E+0
6,91E-1
6,83E-1
MAD
2,78E+0
3,07E+0
4,14E+0
4,19E+0
4,19E+0
3,43E+0
4,23E+0
Median
6,99E-1
7,90E-1
4,74E-1
5,26E-1
6,47E-1
3,27E-1
3,47E-1
MAD
1,26E+0
1,03E+0
1,31E+0
1,55E+0
2,80E+0
1,34E+0
2,23E+0
37
ACCEPTED MANUSCRIPT
ACCEPTED MANUSCRIPT Notes: Particles’ size ranges: UFP: 0.02–1 µm, FP’: 0.3–1 µm; FP: 1–2.5 µm; CP: > 2.5 µm.
TABLE V. Median concentration and Median Absolute Deviation (MAD) of CO [ppm],
Downloaded by [Andrea Spinazzè] at 08:22 22 August 2013
UFPs, FP', FP, CP [pt/cm3] in different periods of the day
MONITORING SESSION
CO UFP FP’ FP CP
Median MAD Median MAD Median MAD Median MAD Median MAD
08:00-10:30 1,54 9,51E-1 3,82E+4 2,90E+4 1,17E+2 1,35E+2
12:00-14:30 1,28 6,64 E-1 2,20E+4 2,15E+4 1,25E+2 1,39E+2
16:00-18:30 1,47 7,25E-1 2,44E+4 2,47E+4 1,10E+2 1,18E+2
1,28E+0 3,62E+0
1,14E+0 4,13E+0
1,11E+0 3,78E+0
5,62E-1
4,77E-1
4,74E-1
1,62E+0
1,83E+0
1,96E+0
Notes: Particles’ size ranges: UFP: 0.02–1 µm, FP’: 0.3–1 µm; FP: 1–2.5 µm; CP: > 2.5 µm.
38
ACCEPTED MANUSCRIPT