appears to typify the inner residential suburbs of Perth, Western Australia, shows an annual cyclical variation similar to that reported by others for San Diego and ...
ooo4-#81/7&‘0!301-I907 502.00/%
Armospherk Envlmnm0t Vol. 12,pp. 1907-1916. Q Pcrgamon PressLtd.1978. Printedin GmatBritain.
TEMPORAL VARIATION IN ATMOSPHERIC PARTICULATE LEAD AND BROMINE LEVELS FOR PERTH, WESTERN AUSTRALIA (1971-1976) B. H. O’CONNOR, G. C.
KERRIGAN
and C. R.
NOUWLAND
Biophysics Group, Department of Physics, Western Australian Institute of Technology, Sth. Bentley, 6102 Western Australia (First received 18 Jury 1977 and infinulform 10 February 1978) Abstract- The temporal variation during 1971-1976 of particulate Pb levels for a sampling site which appears to typify the inner residential suburbs of Perth, Western Australia, shows an annual cyclical variation similar to that reported by others for San Diego and Berkeley in California, but with a more pronounced difference between winter and summer levels, the levels for the winter quarter being on average six times those recorded at the height of summer. The annual average Pb level ranged from 0.27 to OSOpgm - 3 over the survey period, with a value of 15%for the mean per annum increase, and weekly average values lying between the extremes 0.05 and 1.62pg m - 3.The Br/Pb ratio has a similar annual cycle, reaching a peak in winter when it tends to the ratio for fresh lead halide aerosol. The range of values for the ratio during the survey period was 0.184.60. Statistical analysis of Pb level, Br/Pb ratio and selected meteorological parameters shows that both correlate substantially with temperature, and that the Pb level correlates with mixing depth and to a lesser extent with wind run. The temperature correlation suggests that the Pb emission rate of motor vehicles increases in winter.
INTRODUCTION
Investigation of the temporal variation in the level of atmospheric particulate Pb in two independent studies conducted in California, by Chow and Earl (1970) in San Diego, and by Bowman et al. (1972) in Berkeley, has shown a characteristic annual cyclical pattern with the Pb level reaching a maximum during the winter months and reducing by a factor of 2-3 to a minimum in summer. Both studies indicated that the seasonal trend of the annual cycle is punctuated by transient peaks and valleys, typically less than one week in duration. In the San Diego study the short- and longterm variations were ascribed to variations in wind, rainfall and inversion phenomena ; the seasonal summer-winter contrast was attributed to the scouring effect of the summer sea breeze ; and the short-term peaks and valleys to radiation inversions and rain, respectively. Whereas similar conclusions were reached in the Berkeley study regarding the influence of sctabreeze, there seemed to be no correlation with rainfall. The effect of radiation inversions was not discussed in the account of the Berkeley study. In contrast to the analysis of data reported in this publication, the possible influence of ambient temperature and humidity on Pb emissions did not receive attention in either of the reports on the Californian studies. The investigation reported in this paper is the preliminary stage of a modelling study on the influence of meteorological parameters on urban Pb levels in the city and metropolitan area of Perth, Western Aus-
tralia. Like central and south coastal California, Perth and its environs have a Mediterranean-type climate with a pronounced contrast between summer and winter conditions, there being hot, dry summers and mild, wet winters. On a typical summer day the temperature increases (29.4” C avmax in January) until the onset of the cooling sea breeze in midafternoon. Largely due to the influence of this breeze, the average wind speed in summer (18 km h-i) exceeds that in winter (13 km h-i). During winter there are on average two wet days in every three, and the average annual rainfall is 89cm. In winter when Perth is under the influence of a high pressure area, a radiation inversion is frequently maintained below an altitude of 1OOm until mid-morning when surface heating breaks the inversion. The present study was initiated when the authors observed that the difference in Pb levels between summer and winter is more pronounced in Perth than that reported in the Californian studies. Thus, as well as providing further data for investigating the movement of Pb particulates through the atmosphere, the Perth study may yield additional information on the correlation between Pb levels and various meteorological parameters. An important feature of the Perth data is that the contribution of non-vehicular sources to the total Pb loading in the Perth area has been found to be negligible by O’Connor et al. (1977a) in a study of Br/Pb ratios in fresh aerosol. Thus, interpretation of Perth temporal Pb lead data should not be complicated by the effect of industrial emissions.
1907
1908
B. H. O’CONNOR.G. C.
KERRIGAN
and C. R.
In addition to Pb data we have also determined particulate Br levels in the same suite of air samples since variation in the Br/Pb ratio gives some information on the ageing of lead halide particulates in the atmosphere, this phenomenon being thought to be due to the influence of solar radiation and to chemical interaction with other agents in the atmosphere. Our interest in such ageing mechanisms is motivated by the
NOUWLAND
\ Met.
station
need to rake account of these phenomena in modelling calculations. While some information has been published previously on average Pb levels in Australian cities, there are few data on temporal variation. Fisher and Le Roy (1975) presented hourly temporal data collected at a central Melbourne site from 0900 to 1700 hours over 11 days during the period May 1974-February 1975; Dixit rt al. (1974) gave 24 h Pb data for
October-December 1973, at eight locations of the residential urban, light industrial urban and rural types in and adjacent to Melbourne; Thiele and Santer (1976) have published averaged data for Brisbane during March 1974-September 1975 ; and Goodman et ul. (1976) have given data for 14 different weeks during October 1971-January 1975. There are virtually no data in the literature on Pb levels in Perth. Like other Australian cities Perth does not have as yet a network of high volume air filter sampling stations. Under these circumstances we have been most fortunate to gain access to high volume air filter data which have been collected on a continuous basis, commencing in 1971, by the Western Australian State X-ray Laboratories (SXL) as a means of monitoring airborne radioactivity. EXPERIMENTAL
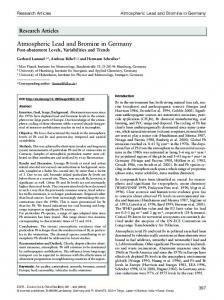
The samples were collected at a single site through a window outlet at the SXL which is situated within the grounds of the Perth Medical Centre site at Shenton Park, a residential suburb of Perth some 4.5 km WSW of the city centre and 5.5 km from the coast (see Fig. 1). The filtration unit is sited on the western side of the laboratory building approx 3 m above ground level and directly under the eaves of the building. The unit is thus adequately shielded from rain. The filtration unit incorporates a filter housing, a flow meter and an Edwards rotary vacuum pump operating at a flow rate of 70 1.min-‘. Frequent observation of the flow meter has established that this flow rate does not diminish during the sampling periods employed in this study. The filter papers are the fibreglass GF/A type marketed by the Whatman Company and have an effective collection area of 66cm’. Sampling is carried out continuously, with the filter usually being replaced each Monday morning. The sampling periods for the survey were therefore mainly of 7 days duration, the minimum and maximum periods being 3 and 14 days, respectively. Accordingly, the scale factor which is applied in converting filter paper loading in pg deposited over the 66cm’ area of the paper to atmospheric loading in tigm -3 is 9.92 x IO-‘/N where N is the sampling period in days. As fibreglass filters similar to the type employed have been found to have essentially complete collection efficiency for lead halide particulates (O’Connor et al., 1975) a collection factor was not applied. The analytical procedure employed is the X-ray fluorescence (XRF) thin film spectrometric technique described by O’Connor et al. (1975) and O’Connor et al. (1977b). Although
?
km I234
5
Fig. 1. Position of recording site, inner city and major highways for the south-western portion of the metropolitan area.
the technique is not as well known as the popular flame atomic absorption spectroscopy method (AAS) for atmospheric particulate elemental analysis it has been established in this laboratory and in many others (e.g. Giauque et ol., 1973; Rhodes, 1974) that XRF is a viable alternative to flame AAS for analytical work of this type. The two methods have comparable, and quite adequate, limits of detection for the type of study described here, and both provide a routine and efficient throughput of data. In the present study XRF offered the following attractions : (i) Only a small portion of the filter is required for analysis, and thus most of the original sample can be preserved for other investigations; (ii) The disc is read directly in the XRF spectrometer without any form of pre-treatment (e.g. ashing or acid digestion); (iii) The analysis is rapid (approx 20 single element determinations h-l); (iv) Matrix effects are negligible (see below); (v) The non-destructive nature of the analysis facilitates the conduct of repeat measurements ; and (vi) Other heavy elements (notably Br) in motor vehicie exhausts can also be monitored. In XRF analysis of sub-milligram environmental samples, it is assumed that the sample obeys the “thin film” approximation defining the bounds within which absorption eflbcts can be discounted. The working rule used in this laboratory to derive the thin film limit is that the maximum permissible filter loading/area for matrix-free analysis in gem-’ is 0.02k_’ where p, the mass absorption coefficient of the sample matrix for Pb characteristic K, X-radiation, isgiven in cm* g-l. If we adopt Si02 as a typical matrix for estimating the limiting value for air samples, the theoretical /1 of gives a maximum allowable dust loading of l’lcm’g-’ 1.2mgcm-* for Pb analysis which is 2 orders of maftnitude greater than the gravimetrie roadings of the samples eoikted for the study. simikrly, Br also satisfied the criterion. All 320 samples were analysed for both Pb and Br. Following collection the samples had been stored in poly-
1909
Temporal variation in atmospheric particulate lead thene envelopes which were then placed in unset&d ligbttight paper packets. It should be noted that this means of sealing is far from ideal as bromide particulates tend to shed Br during storage (O’Connor et al., 1977b). Because substantial Br losses arealso induced by X-radiation during XRF analysis, the samples were sealed with opticafly-transparent adhesive tape ~~iateiy before measurement. It was not possible to efficiently seal the samples at an early stage following collection as the present study was not envisaged when the samples were collected. The XRF machine was calibrated for Pb and Br analysis with “spotted filter” standards which were prepared by pipetting known amounts of standard Pb(NO,)r and KBr solutions onto discs of fRrmgtass filters as described in detait by O’Connor et al. (1975,1977b). In order to prevent Br losses from the KBr-impregnated discs while drying, these were sealed with adhesive tape immediately after the spotting process and then read in the XRF spectrometer without delay. Standard readings were corrected for X-ray absorption (O’Connor et a/., 1977b). The machine parameters used are those listed in Table 1 of O’Connor et al. (1977b) with the exception of m~urement times. The time devoted to measuring the count rate for each of the PbL, and BrK, peaks was 60s as was the time spent determining the background count rate. The signal :background ratio varied between 1.6 and 9.0 over the suite of data, and the extremes of background level by f 11%. Each measurement was repeated to avoid accidental errors. The two count rates thus measured, C, and C2, had an “index of disagreement*, 1C, - Cz //(C, + C,), less than 0.08 for all samples. The mean count rate was used to derive tire loading for each sample. All values were corrected for machine and filter medium background as determined with blank samples. The maximum blank correction recorded for Pb and Br in the study was 30 and 5’& respectively, of the nett count rate.
RESULTS AND DISCUSION
Histograms showing the variation in the weekly average ,ievel of atmospheric particulate Pb and the Br/Pb ratio for 1971-1976 are presented in Fig. 2. The variation in weekly average Pb levels and selected meteorological data (temperature, humidity, rainfall, wind run and mixing depth) for one year of the survey perfod (1974) is shown in Fig. 3 in order to demonstrate the short-term influence of atmospheric conditions on Pb levels. Longer-term or seasonal effects are seen in Fig. 4 which shows the quarterly ‘average Pb and BrfPb values and meteorological data, the quarterly periods defined as being December-February (southern hemisphere summer), March-May (autumn), June-August (winter), and September-November (spring). The annual average Pb histogram is given in Fig. 5. Although the weekly average meteorological data are not recorded here, the entire set ofdata for the survey period is available from the authors (O’Connor et al., 1977~). The recording conditions for these data are given in Appendix I.
Pb data In qualitative terms the weekly average Pb histogram has the same general cyclical form observed in the San Diego and Berkeley studies, there being a pronounced increase in concentration from a minimum level in summer to a maximum in winter. The level
‘--T-‘----t
1972
j
1973
(
1974
i
t975
1
1976
f
Fig. 2 Temporal variation in the weekly average Pb and Br/Pb values for the survey period, 1971-1976. Tbe hatched columns are periods for which filter samples were not recorded.
1910
B. H.
O’CONNOR,
G. C. KERRIGAN
and C. R.
NOUWLAND
Mlxq depth1000* (m)
Wmd run (km)
Ranfall (mm)
Humldlty (%I
Temp. 1°C)
Pb +g
n-i’)
Fig. 3. Histogram comparison of weekly average Pb levels with temperature, humidity, rainfall, wind-run and mixing depth for 1974.
then declines at a rate almost equal to that of the summer-winter build up, giving a slightly skew distribution. The ratio of winter: summer quarterly values ranged from a minimum of 3.5 in 1973 to a maximum of 6.9 in 1976, the average ratio for the survey period being 6.0. It is of considerable interest that this ratio is substantially greater than the values of 2-3 found in the Californian studies. The difference in contrast between the winter maximum and summer minimum in Perth is not totally unexpected as Australian lead additives differ in composition from those employed in the United States (O’Connor et al., 1977a),* and because there are significant differences between the atmospheric conditions experienced in Perth and those in coastal California. These considerations are currently being investigated by the authors in the follow-up modelling study. Substantial short-term variation (5 weekly) in the
*The composition of lead additive varies substantially according to climate. Most Australian refineries, including the one servicing the region in which this study was conducted, use a higher Br/Pb ratio and a lower Cl/Pb ratio than is employed in United States (and in central Europe). This is a consequence of the milder Australian winter.
measured Pb-concentration is common. For example, over the weeks ending 9 July and 16 July 1976, the average Pb level fell from 1.6 to 0.3 pegm- 3, and then rose again to an average 0.8~grn-~ in the following week. Inspection of the corresponding weekly average meteorological data for temperature, humidity, rainfall, wind-run and mixing depth gives some indication of the likely influence of these parameters on Pb-levels. For the purpose of this paper, only the 1974 weekly average meteorological data have been included (see Fig. 3) to demonstrate the observed correlations. These show that the steady increase in Pb level from summer to winter and subsequent skewed decline correlates to some extent with all five meteorological parameters which is to be expected in view of the interrelationship between these parameters. We find the strong negative correlation between the Pb level and temperature histograms of special interest. This correlation appears to be consistent with : (i) the results of bench tests reported by Habibi (1973) and ter Haar et al. (1972) which established that particulate emissions from motor vehicles powered by leaded fuels increase with the frequency of“cold starts”; and (ii) the detailed study by Ganley and Springer (1974) which showed that there is an inverse relationship between particulate emission rate and exhaust stream temperature.
Temporal variation in atmospheric particulate lead
6
Ramfall Imm)
4 2
70
Humldlty (W
6.
Br/Pb (w/w)
0v4 0.2
50
1.0 PbW
m31 o.5
Year.
summer,autumn.wmter,sprlng
Fig. 4. Histogram comparison of quarterly average Pb and Br/Pb values with temperature, humidity, rainfall, wind-run and mixing depth for 1971-1976. The mixing depth data are incomplete.
r
0.5
:
E
r-l
-I
I
0.4 1
aD
0.2-
0.1-
1971
1972
1973
1974
1975
1976
Fig. 5. Trend in annual average Pb value for 1971-1976.
There is some suggestion therefore that the winter build up of airborne lead may be partly due to a progressive increase in Pb particulate emission rate as the ambient temperature falls. Possible reasons for this effect include variations in engine performance and in exhaust stream condensation dynamics with change in external temperature. The nature of this implied temperature dependence is under further investigation at the time of writing.
1911
The frequent short-term variations in the Pb level observed in winter 1974, appear to be qualitatively consistent with the meteorological data. Thus the maximumlevel, that occurring in Week25(1.3 pg me3), corresponds to the lowest weekly mean mixing depth, wind-run and temperature values. Moreover, this was a dry week. It is also encouraging that the lowest Pb level in the winter months, a reading of 0.1 pgm-3, corresponds to the windiest week of the winter, to one of the highest winter mixing depths, and to a period of above-average rainfall. Analysis of the highest and lowest Pb concentrations for the other years of the study shows that these extreme values tend to occur under similar extremes of mixing depth, wind-run and temperature. Peaking of Pb values for the winter period strongly implies that there is a tendency for Pb to accumulate in dry, cool periods for which the average wind-run and mixing depth are at a minimum. Between these two extremes, visual comparison of the weekly Pb and meteorological histograms does not give any clear indication of the inter-relationship between these parameters. Weeks 19 and 26 which give the second most intense levels of Pb for the year (0.8 pg m-‘) both had above-average values for wind-run and rainfall, whereas the next most intense week, 24 (0.5 pg m - ‘) was dry with slightly below-average wind-run. Indeed it would appear that the form of the relationship between Pb levels and meteorological parameters is of a more complex nature than might be determined by visual inspection of the weekly average meteorological data. However, it is obvious from these and other spot checks of the histograms that the conclusion reached in the San Diego study that the “holes” in the weekly average Pb-histogram are entirely due to rainfall does not apply in the case of the Perth data. The quarterly average Pb histogram in Fig. 4 shows that in each year there is a steady increase in Pb level from the summer quarter through to winter with a subsequent decline in spring. There is no evidence to suggest that the mean summer level increased significantly during the survey period, although it should be remembered that the summer level is extremely low and therefore that any trend in this level would be difficult to observe. The mean autumn quarterly value increased steadily for all years except 1974, the average annual rate of increase for this quarter being 28%. This figure is unexpected as the fuel consumption for the same period increased at a much lower rate (see below). The mean winter level showed no apparent increase from 1971 to 1974, but then increased by 34 and 18% in 1975 and 1976, respectively, to a 1976 level of0.85 pg m-j. The spring value has an average annual rate of increase of 29% with a Ievelling-off in 1974-1975. The quarterly Pb and meteorological histograms in Fig. 4 show that Pb correlates markedly with quarterly average temperature, humidity, and rainfall ; and that there is noticeable, but less persistent, correlation with wind-run. The Pb, temperature, humidity, and rainfall
1912
B. H. O’CONNOR,G. C. KERRIGANand C. R.
histograms show a steady trend from quarters 1-3, this trend being reversed in the fourth quarter. We consider that the most likely explanation of this finding is that the substantial decrease in temperature from quarters 1-3 progressively increases the exhaust emission rate of Pb particulates. The apparent Pb-humidity association may well be a consequence of strong temperature-humidity correlation, although it is not possible to discount the existence of a direct causal relationship between Pb and humidity as it is at least plausible that humidity may influence the formation of lead halide particles in exhaust streams. Note that the link between the Pb and rainfall histograms must be a consequence of temperature-rainfall correlation as rainfall would be expected to reduce Pb levels in the atmosphere whereas the converse is evident from the histogram. The histogram for mixing depth gives less information than the other histograms since the mixing depth records were only available for 507, of the survey. However there is evidence of an inverse relationship between Pb level and mixing depth. Our histogram analysis of the loading and meteorological parameter correlations is confirmed by the Pearson correlation coefficients in Table 1. The coefficients are given for weekly- and quarterlyaveraged data in order to differentiate between shortand long-term (seasonal) loading/meteorological _____-___-__-.-. ~~.~.~... ~-~~~ - ~--* Data provided by the Main Roads Department. Western Australia.
NOUWLANU
parameter correlations. For the weekly data. the correlations with Pb are all significant, ranging from the minimum value (-0.30), which is that for rainfall, to the maximum (-0.54), that for temperature. Discounting the positive Pb-rainfall correlation as having any physical significance for the reason postulated in the preceding paragraph, we are left with temperature. humidity, wind-run, and mixing depth as possible causal factors which should come under consideration in modelling studies of variations in airborne Pb levels. If the temperature dependence implied by Habibi and ter Haar is accepted, there is then a distinct possibility that humidity is not of direct significance. The Pearson coefficients for the quarterly average data are of interest in terms of the contrast between summer and winter Pb levels. Note that the Pbtemperature/humidity correlations (z - 0.8) are highly significant whereas those for Pb-wind run and Pb-mixing depth are not. Thus the strong relationship observed between Pb and the temperaturerelated parameters is found for both weekly and quarterly data. The trend in annual average values of Pb in Fig. 4 shows a steady increase in Pb concentration for all years with the exception of 1974. The individual annual rates of increase in Pb concentration are presented in Table 2 together with the annual total kilometres travelled in the Perth metropolitan area.* The average annual rate of increase in Pb concentration, 15”,,, is substantially greater than the
Table 1. Pearson correlation coefficients? between airborne particulate time-averaged elemental concentration (Pb, Br/Pb) and meteorological parameters
Pb Br/Pb
Wind Run
Mixing Depth
0.30 (0.75)
-- 0.48 f-0.28)**
i -0.46)**
0.28 (0.70)
0.01 ** (-0.19)**
-0.10 ** (-0.26)**
Humidity
Rainfall
( -0.76)
0.50 (0.80)
- 0.45 (-0.67)
0.34 (0.69)
Br/Pb
Temperature
0.31 (0.67)
-0.54
-0.56
-0.81 (-0.96)
Temperature
parameters
.- 0.37
( - 0.90)
0.38 (0.42)*
0.62 (0.9 I )
-0.38 - 0.48)*
-- 0.20 -0.37)**
0.00 ** -0.32)**
-0.32 -0.4Q**
Humidity Rainfall
0.14 (0.1 l)**
Wind Run Coefficients are given for weekly and quarterly averaged data for 1971-1976, with the exception of the mixing depth correlations which are for 1972-1974 only. The quarterly data correlations are given in parentheses. Levels of significance: asterisked values in the range %I-99%, doubled asterisked values c 90”/,, other values z 99,9”/, t The Pearson correlation coefticient for a pair of variables x and y is the ratio of the covariance between x and 4’to the product of their standard deviations,
cr N IL,,,
% (Xi - X)(Yi- i;) i= I
-+r N
-I\ L/Z
-IL,,,
JJ
where N is the number of observations, and i and j are the respective mean values for x and r.
1913
Temporal variation in atmospheric particulate lead Table 2. Trends in the annual average values of atmospheric vehicular lead and the total vehicle kilometres travelled in the Perth metropolitan area
1971 1972 1973 1974 1975 1976
Average annual Pb (pgm-?
Per annum increment (%)
0.267 0.284 0.330 0.322 0.393 0.501
6.4 16.2 -2.4 22.0 27.5
corresponding figure for vehicle miles, 5%, estimated for the period 1971-1975. The reason for the ap parently uncharacteristic increase in Pb concentration towards the end of the survey is not clear cut. We note though that the occurrence of only one additional week in which the level is approx 1.5 pg m - 3 would raise the average annual increase in Pb level by 5%. Thus weather anomalies may account for the seemingly excessive increase in Pb concentration over the survey period. Similar data for the United States, notably that given in the National Academy of Sciences report by the Committee on Biologic Effects of Pollutants (1971), give conflicting results on the trend rate. For example, Chow and Earl (1970) suggested that the lead concentration in San Diego is increasing at the rate of 5% per year, whereas the data of Bowman et al. (1972) for San Francisco indicate no significant increase. It is evident from these and from the present study that there is a need to collect data for longer periods and over an extensive sampling grid if the trends are to be more clearly established. Alternatively, a modelling study based on data collected over a short period might be used for this purpose. Certainly the statistic that the average level virtually doubled during the six years of the present.survey, underlines the need for further research on this point. The annual average levels are compared in Table 3 with those from urban residential areas in other Australian cities and elsewhere. While the term “urban residential” is somewhat vague, it is of some use in calculations of typical particulate Pb inhalation rates in urban residential areas. The value from this study is at the lower end of the range 0.35-1.3 pg rnw3 quoted for the list of locations included in the table. These limits define a range of daily inhaled lead in the vicinity of lo-3Opg for the general urban population (Committee on Biologic Effects of Pollutants, 1971) compared with the total dietary intake of lOO--5OOpgday-’ (Schroeder and Tipton, 1968).
Br-data The weekly-average and quarterly-average Br/Pb histograms in Figs. 2 and 4, respectively, show that the Br and Pb levels are strongly correlated (Pearson coefficient = 0.92), and that both short-term and seasonal variations occur in the Br/Pb ratio, due pre-
Vehicle km travelled 4.44 x lo9 4.66 5.05 5.22 5.46
Per annum increment (%)
5.0 8.4 3.4 4.6 (not available)
sumably to chemical dissociation of lead halide particulates in the atmosphere. It is especially interesting to note that the upper limit of the weekly Br/Pb ratio for the 6 year period, 0.59, coincides with the value 0.59 + 0.05 observed by O’Connor et al. (1977a) in a study of “fresh” urban aerosol, collected at peak periods alongside major traffic routes. Hence it seems likely that the weekly fluctuations in the Br/Pb ratio could yield information on the influence that meteorological phenomena have on the ageing of airborne lead halide particulates. The tendency of Pb halide particulates to undergo chemical change means that when airborne particulate Br levels are to be used as a secondary measure of vehicular Pb concentration considerable care must be taken to ensure that the sample constitutes material freshly exhausted by traffic (O’Connor et al., 1977a). While it is beyond the scope of this paper to consider the influence of meteorological parameters quantitatively, some general observations are in order. For example, the weekly Br/Pb ratio diminishes when there is significant rainfall and then recovers following the cessation of rain. This is confirmed by the correlation coefficients in Table 1 which show that temperature, humidity, and rainfall correlate significantly with the ratio. The extremely low correlations with wind-run and mixing depth are expected, and thus give us considerable confidence in the quality of the measured data. There is a general tendency for the Br/Pb ratio to increase in the winter period, as shown in Fig. 2. This is seen more clearly in the quarterly average histogram in Fig. 4. This shows that the ratio increased steadily from quarters 1-3 and then declined, this behaviour closely resembling that noted for the Pb concentration. This may indicate that ‘a decrease in atmospheric temperature leads to a progressive enrichment in the proportion of Br relative to Pb in the particulate fraction of vehicular exhaust. Alternatively, we consider that the increase in the intensity of solar radiation in the summer may conceivably cause some acceleration in the breakdown of lead halide particulates. An additional feature that is evident from Fig. 4 is a perceptible increase in the annual average Br/Pb ratio over the survey period. It is likely that this reflects some loss of Br from the filter samples during storage. (see Experimental section).
et (II. (1968)
Bullock
Other countries Warwick, England
Survey period
March
19655Feb. 1966
lead levels and range
1973 (Ott-Dee) 1975 (June.-Sept.) 1971-1975 1971-1976
particulate
Dixit et ~1. (1974) Thiele et al. (1976) Goodman ef al. (1976) This work (1977)
Reference
3. Mean airborne
Australia Melbourne Brisbane Hobart Perth
City
Table
Weekly
Fortnightly Weekly Intermittent Weekly
Sampling frequency
of levels for urban
1 week
24 hours 24 hours I week I week
52
40 15 14 320
0.8
0.7 1.3 0.4 0.35
Pb (figme’)
and other cities
Sample number
areas in Perth
Sampling time
residential
Mean
0.1 -1.5
0.2 -- 1.5 0.1 3.5 0.12-1.1 0.05~ 1.62
Range
Temporal variation in atmospheric particulate lead CONCLUSION
Analysis of the Pb and Br levels in atmospheric ~rti~~ate samples collected at a residential urban site in Perth during 1971-1976 has shown an annual cycle in the airborne particulate Pb concentration similar in form to that reported in similar studies conducted in Berkeley and San Diego, California. The annual average of the winter : summer Pb levels for the survey period, 6.0, exceeds the range of values, 2-3, reported for the Californian studies. Statistical correlations between the weekly- and quarterly-averaged Pb levels and the corresponding data for mean daily ambient tem~rature, hu~dity, rainfall, wind-run and mixing depth show significant correlation between Pb concentration and (i) the thermal parameters, temperature and humidity, and (ii) the ventilation parameters, wind-run and mixing depth. The influence of rainfall appears to be of less significance. There is some indication that the thermal parameters, but not the ventilation parameters, considerably influence seasonal levels. Further work is currently proceeding in this laboratory on the effect of meteorological conditions, in particular temperature and humidity, on vehicular Pb emissions. The seasonal variation in the Br/Pb ratio is similar to that for Pb. In mid-winter the ratio tends to that for fresh aerosol, 0.6, and to a value of 0.4 in mid-summer. Short-term variations in the ratio occur over periods of a week or less, due possibly to the influence of temperature, humidity and rainfall. As in the case of Pb levels, there may well be a temperature-dependent effect, causing seasonal variations in the chemical type and in the emission rate of suspendible Pb halide particulate from motor vehicles. The annual average Pb level increased from 0.26 to O.~~grn-~ during the 6 year study. The mean per annum increase of ISo/, exceeds the rate of increase of total vehicular distance, 5?& for the same period. Work on the trend of particulate Pb and Br levels is to be continued jnde~nite~y.
Ae~~w~e~ge~n~s - We wish to record our appreciation of the cooperation of Mr. B. King, Physicist-in-Charge, State Xray Laboratory, Medical Department, Western Australia, who authorised the use of the air filter samples ; Mr. A. Scott, Senior Meteorologist, Australian Bureau of Meteorology (Perth oftice), for his assistance in providing rnet~~l~~l records ; andto Mr. C. Amdt, Traffic Service Engineer, Mains Road Department, Western Australia, for thesupplyof trafftc data. The financial support granted by the Staff Development Committee of Western Australian Institute of Technology is also gratefully acknowledged. Our co&ague, Dr. G. Allen, has been extremeiy helpful during the preparation of this paper. REFERENCES BXWUW H.
R., Conway J. G. and Asaro F. (1972) Atmos-
pberic lead and bromine concentration in ~erkei9, Calif. (1963-1970). Envir. Sri. Technal. 6, 558-560.
1915
Bullock J. and Lewis W. M, (1968) The influmce of traffic on atmospheric pollution. Atntdtphsrir E~~~~nf 2, 517-534. Chow T. J. and Earl J. L. (1970) Laad aerosols
in the Science 169, atmosphere : increasing concentrations. 577-580. Committee on Biologic Effects of Atmospheric Polfutants (1971) Airborne lead in perspective. Washington, D.C., National Academy of Science, Nationai Research Council. Dixit S. C. N., Alste J. and Bags J. (1974) M~uremcnts of airborne particulates in the Melbourne urban region. Clean Air 8, 53-S. Fisher A. and LeRoy P. (1975) Particulate lead concentrations in Melbourne air. Clean Air 9, 56-57. Ganley J, T. and Springer G. S. (1974) Physical and chemical characteristics of particulates in spark ignition engine exhaust. Envir. Sci. Technof. 4,340-341. Giauque R. D., Goulding F. S., Jaklevic J. M. and Pchl R. H. (1973) Trace element determination with semiconductor X-ray spectrometers. Analyf. C&m. 4!!, 671. Goodman H. S., Noller B, N., Pearman Ci. 1. and Bloom H. (1976) The heavy metal composition of atmospheric particulates in Hobart, Tasmania. Clean Air 10, 38-41. Habibi K. (1973) Characterisation of particulate matter in vehicle exhaust. En&. Sci. Teckrwl. 7,223-234. O’Connor B. H., Kerrigan G. C.,Tbomas W. W. and Gasseng R. (1975) Analysis of the heavy ekment content ofatmospheric particulate fractions using X-ray fluorescence spectrometry. X-ray Spectrometry 4, IQO-iQ5. O’Connor B. H.. Kerr&tan G. C.. Thomas W. W. and Pearce A. T. (1977a) Dse of bromine levels in airborne particulate samples to infer vehiiular kad con~tmtions in the atmosphere. Atmospheric Environment 11.635-638. O’Connor B. H.. Kerrittan G. C. and Hinchliffe P. f1977blThe loss of bromine f&m thin film samples during X-ray fluorescence analysis. X-ray Spectrometry 6, 83-85. O’Connor B. H., Kerrigan G. C. and Nouw)~d C, R. (1977~) Weekly average airborne particulate lead and bromine concentrations, and corresponding meteorological data. Shenton Park (1971-1976). WAIT, Dept. of Physics, Internal Report. Rhodes J. R. (1974) Ener8y dispersive X-ray spectrometry for multielement pollution analysis. IEEE Nucl. 7ian.s. 21, 608617. S&roe&r H. A. and Tipton I. H. (1968) The human body burden of lead. Archs. envir. HIth 17,%5-978. ter Haar G. L., Lenane D. L., Hu J. N. and Brandt M. (1972) Composition size and control of automative exhaust particulates. J. Air Pollut. Control Ass. 22,39-46. Thiele B. R. and Santer D. (1976) Lead levels in &&bane air. Clean Air 10,32-33.
APPENDIX L Mli3EDROLOC1CALDATA
The weekly average meteorological data used in the study are derived from records supplied by the Perth of&e of the Australian Bureau of Meteorology. Tbc records of temperature, h~idity, rainfall, and wind run are taken from instruments located within the grounds of the Perth of&e, adjacent to W~lington Street, approx 5.5 km ENE of the particulate data recording site at Shenton Park (see Fig. 1). The mixing depth records are based on measurements made at the Perth Airport, some 15.0 km BNE from the Shenton Park site. The records for all parameters, with theexception ofmixingdepth, are for the entire survey period (1971-1976). The mixing depth records cover only 50% of the survey, from January 1972 to December 1974. Details of data acquisition for the weekly averaged parameters are as follows: (if Temperature and relative humidity values were derived from recordings taken at two hourly intervals;
1916
B. H. O’CONNOR,G. C. KERRIGANand C. R. NOUWLAND
(ii) Rainfall and wind-run values are based on 24-h cumulative readings ; and (iii) Mixing depth is that obtained using 7 a.m. upper temperature data at the airport and a surface tempera-
ture 3°C higher than the minimum temperature recorded at the city site - when an inversion starts from ground level the mixing depth is set at 100m.