Temporal Yield Variability under Conventional and Alternative Management Systems Richard G. Smith,* Fabian D. Menalled, and G. P. Robertson garding the ecological and economic impacts of intensive reliance on synthetic chemicals and tillage has driven interest in identifying alternative cropping systems. A major goal of these alternative cropping systems is to lessen the need for intensive management practices while maintaining or enhancing the economic and environmental sustainability of the farming enterprise (Robertson and Swinton, 2005). Agricultural management systems have been shown to have substantial impacts on many aspects of agroecosystems, including soil biochemical properties (Drinkwater et al., 1995; Kladivko, 2001; Sanchez et al., 2004; Grandy et al., 2006), soil faunal composition and diversity (Wardle et al., 1999; Scheu, 2001; Menalled et al., 2007), and weed community structure (Buhler, 1995; Menalled et al., 2001; Davis et al., 2005). Thus, it is reasonable to expect that management systems may also have substantial impacts on ecosystem processes that contribute to annual crop yield variability (Altieri, 1999; Kravchenko et al., 2005). Alternative management practices that maintain or enhance crop yields while reducing inter-annual yield variability have the potential to decrease the risk associated with crop production. Enhanced yield stability is of particular importance to the sustainability of agriculture under future global climate change scenarios which predict that variation in precipitation patterns will increase (Southworth et al., 2000; Tilman et al., 2001; Lotter et al., 2003). Despite the potential benefits to growers of decreasing temporal yield variability, there have been relatively few studies that explicitly address the impact of management systems on year-to year yield variability within row crop agroecosystems typical of the Midwest. However, several recent studies incorporating data from long-term cropping systems experiments suggest the significant role that management systems may play in affecting yield variability. For example, Kravchenko et al. (2005) observed that over a 6-yr period spatial yield variability was higher in a zero chemical input system during low rainfall years compared to systems that received chemical fertilizers. In contrast, Smith and Gross (2006) found that over a 4-yr period, corn yields in an organically managed rotation that included soybean and winter wheat were less temporally-variable than yields of continuous corn under conventional management. Clearly, additional studies that focus explicitly on temporal variability and incorporate a time period long enough to capture a
Reproduced from Agronomy Journal. Published by American Society of Agronomy. All copyrights reserved.
ABSTRACT Year to year variation in yield is an inherent risk associated with crop production and many growers rely on intensive mechanical or chemical inputs to preserve crop yield in the face of fluctuating environmental conditions. However, as interest grows in alternative crop management systems which depend less on external inputs, determining the degree to which management systems can impact the temporal yield variability will help the development of sustainable agroecosystems. This study assessed average crop yields and temporal yield variability over a 12-yr period in four agricultural management systems that are part of a long-term cropping systems experiment at the W.K. Kellogg Biological Station (KBS) Long Term Ecological Research (LTER) site in southwestern Michigan. The four systems follow a corn (Zea mays L.), soybean [Glycine max (L.) Merr.], and winter wheat (Triticum aestivum L.) 3-yr rotation under conventional (CT), no-till (NT), low-input (LI), or organic (ORG) management, and each crop phase was present in the rotation four times from 1993 to 2004. Yields were measured each year and crop yield variability was estimated using the coefficient of variation calculated separately for each crop phase. Averaged over the study period, yields in the CT and NT systems were similar across all crop phases of the rotation and of higher magnitude than the LI system only in the winter wheat phase of the rotation. Compared to the other three management systems, yields in the ORG system were lower in the corn and winter wheat phases of the rotation. Yields in the soybean phase were similar across the four management systems. Temporal yield variability differed among management systems and rotation phases and was highest in the ORG system during the soybean (CV 5 48%) and winter wheat (CV 5 33%) phases of the rotation. Compared to the CT system, yield variability was 40% lower in the LI (corn phase), 33% lower in the NT (soybean phase) and similar in the NT (corn and winter wheat phases) systems. Results of this study suggest that yield and temporal yield variability under alternative management systems such as no-till and low-input can be comparable to that in conventional systems. However, temporal yield variability can be as high or higher in organic cropping systems without external inputs of manure or compost.
Y
EAR-TO-YEAR VARIATION IN CLIMATE
can be substantial and can interact with biotic and abiotic factors such as pest pressure, topography, soil properties, and management practices in determining crop performance (Porter et al., 1998; Andresen et al., 2001; Kravchenko et al., 2005; Mallory and Porter, 2007). To reduce the effects of variability on crop production, many growers rely on external inputs of fertilizers, pesticides, and tillage (Varvel, 2000). However, growing awareness re-
R.G. Smith and F.D. Menalled, Dep. of Land Resources and Environmental Sciences, Montana State Univ., Bozeman, MT 59717; and G.P. Robertson, Dep. of Crop and Soil Sciences and W. K. Kellogg Biological Station, Michigan State Univ., Hickory Corners, MI 49060. R.G. Smith, current address: USDA-ARS, Exotic and Invasive Weeds Research Unit, 800 Buchanan St., Albany, CA 94710. Received 15 Mar. 2007. *Corresponding author (
[email protected]).
Abbreviations: CT, chisel-plowed treatment with conventional chemical inputs; CV, coefficient of variation; KBS LTER, W.K. Kellogg Biological Station Long-Term Ecological Research Project; LI, chiselplowed treatment with low chemical input and a winter legume cover crop; NT, no-tillage treatment with conventional chemical inputs; ORG, organic-based chisel-plowed treatment with zero chemical input and a winter legume cover crop.
Published in Agron. J. 99:1629–1634 (2007). Cropping Systems doi:10.2134/agronj2007.0096 ª American Society of Agronomy 677 S. Segoe Rd., Madison, WI 53711 USA
1629
1630
AGRONOMY JOURNAL, VOL. 99, NOVEMBER–DECEMBER 2007
Reproduced from Agronomy Journal. Published by American Society of Agronomy. All copyrights reserved.
greater range of climatic conditions are necessary to quantify accurately the longer-term impacts of management systems on temporal yield variability (Varvel 2000). The objective of this study was to analyze and quantify the differences in temporal yield variability of corn, soybean, and winter wheat grown in rotation over a 12-yr period under four contrasting agricultural management systems. MATERIALS AND METHODS Study Site This study was conducted at the KBS LTER Project in Agroecology in Hickory Corners, MI. Soils at the KBS LTER site are a mixture of Kalamazoo (fine-loamy, mixed, semiactive, mesic Typic Hapludalfs) and Oshtemo (coarse-loamy, mixed, active, mesic Typic Hapludalfs) sandy loams (Crum and Collins 1995). Mean annual precipitation (30-yr mean) is 860 mm, about half of it occurring during the winter months. Mean annual temperature is 9.4jC. The site was principally in continuous corn production for more than 20 yr before the establishment of the LTER project in 1989.
Management Systems In 1989, four long-term agronomic management system treatments that were CT (high external chemical input, tilled), NT (high external chemical input, no tillage), LI (low chemical input, tilled), and ORG (no external chemical input, tilled) were initiated at the KBS LTER. Each management system was replicated six times in 1-ha plots organized in a randomized block design. Within each block, plots were separated by 10-m wide, periodically mowed, grassy strips. Since 1990, the LI and ORG treatments have been an annual rotation of corn–soybean–winter wheat, with the winter wheat underseeded with red clover (Trifolium pratense L.) at a rate of 13 kg ha21. From 1990 to 1992, the CT and NT systems were a corn–soybean rotation and from 1993 to present, the rotation has been corn–soybean–winter wheat in phase with the LI and ORG systems. Thus, the systems had completed four (CT and NT) and five (LI and ORG) full three-crop rotations by the end of this study in 2004. Specific agronomic practices differed by management system described earlier and for each crop according to Michigan State University (MSU) best management practices (Kravchenko et al., 2005). Primary tillage in the CT, LI, and ORG systems consisted of moldboard plowing from 1990 until
1997 and chisel plowing in 1999 and 2000. One replicate of the NT system was accidentally tilled in 1994 and data from this replicate was not used in subsequent analyses. Corn and winter wheat were planted in 76 and 19 cm rows, respectively. Soybean was planted in 76 cm rows to facilitate cultivation in the LI and ORG systems and in 20 cm rows in the CT and NT systems. Fertilizers in the CT and NT systems were applied at planting (as NH4NO3 until 1995, and as 28% UAN thereafter) at a rate of 123 kg N ha21 in corn and 56 kg N ha21 in winter wheat. Lime, N, P, and K were applied as needed according to MSU recommendations (Grandy et al., 2006). In the LI system, wheat received 34 kg N ha21 at planting; corn received 28 kg N ha21 followed by a sidedress application of N fertilizer, subject to soil test results. Legume green manure in the winter wheat phase of the rotation was the only source of N in the ORG system. All crop varieties were herbicide susceptible. Herbicides were used in the CT and NT systems and applied at rates recommended for the region (Davis et al., 2005). In the ORG system, weed management consisted of multiple passes with a cultivator and rotary hoe. Weed management in the LI was similar to the ORG except that the LI also received reduced- to full-rate postemergence herbicide applications depending on scouting information. No insecticides were applied to any of the management systems during the course of the study. Additional information of the agronomic practices used to manage the systems can be found at the KBS LTER website (http://lter.kbs.msu.edu/Data/DataCatalog.html; verified 31 Aug. 2007).
Yield and Precipitation Data Crop yields were determined annually by harvesting each plot using a plot combine. Winter wheat was harvested in July and soybean and corn were harvested in October and November, respectively. Crop yields (Mg ha21) were calculated at 13% (wheat and soybean) or 15% (corn) moisture. Annual yield values are reported here to aid in interpretation of yield variability (Table 1) and can also be found at the KBS LTER website (http://lter.kbs.msu.edu/Data/LTER_Metadata.jsp? Table5KBS032-001; verified 31 Aug. 2007). Previous studies have reported on the effects of management systems on annual yields at this site (Kravchenko et al., 2005; Grandy et al., 2006). In contrast with these previous studies, our yield analysis focuses not on annual yields, but longer-term means (averaged for each crop phase over the 12-yr study period). Although Kravchenko et al. (2005) report yield variability at the KBS LTER site, they focused on spatial (within plot) variability data collected over a 6-yr period. In this study, we present data
Table 1. Annual yields for each rotation phase at the the W.K. Kellogg Biological Station Long Term Ecological Research (KBS LTER).† Values are means and SE, n 5 6; except NT, where n 5 5. Management systems are CT, conventional till; NT, no tillage; LI, low-input, tilled; and ORG, organic. Management system Year
Crop
CT
NT
LI yield Mg ha
1993 1996 1999 2002 1994 1997 2000 2003 1995 1998 2001 2004
corn corn corn corn soybean soybean soybean soybean wheat wheat wheat wheat
7.11 6 0.35 3.20 6 0.46 4.01 6 0.20 5.40 6 0.58 3.01 6 0.10 1.51 6 0.08 2.66 6 0.10 1.62 6 0.08 3.30 6 0.08 3.01 6 0.15 4.20 6 0.14 4.08 6 0.05
7.26 6 0.23 4.04 6 0.44 3.80 6 0.13 5.32 6 0.15 2.86 6 0.09 2.04 6 0.06 2.92 6 0.04 1.87 6 0.04 3.49 6 0.10 2.80 6 0.04 3.73 6 0.013 4.21 6 0.05
ORG
21
5.05 6 0.27 4.18 6 0.20 4.41 6 0.13 6.47 6 0.37 3.09 6 0.16 1.81 6 0.07 2.87 6 0.06 1.20 6 0.10 3.18 6 0.04 2.21 6 0.06 3.68 6 0.08 3.85 6 0.07
† Analyses of management system effects on annual yields are presented in Kravchenko et al. (2005) and Grandy et al. (2006).
3.25 2.53 4.18 5.45 3.19 1.65 2.90 1.01 2.19 1.11 2.72 2.30
6 0.25 6 0.25 6 0.16 6 0.62 6 0.10 6 0.06 6 0.08 6 0.08 6 0.05 6 0.06 6 0.09 6 0.11
1631
Reproduced from Agronomy Journal. Published by American Society of Agronomy. All copyrights reserved.
SMITH ET AL.: YIELD VARIABILITY UNDER MANAGEMENT SYSTEMS
Statistical Analyses The effect of management system and rotation phase on average yields and yield variability was analyzed with a randomized complete block design analysis of variance (ANOVA) using the mixed procedure in SAS (Little et al., 1996) in SAS (Version 8.02; SAS Institute, Cary, NC). Management system and rotation phase were considered fixed effects. In cases where there was a significant management system-by-rotation phase interaction, results were sliced by rotation phase to determine whether management system means differed within individual rotation phases. Differences between individual management system treatments were assessed with Tukey’s HSD Test at P 5 0.05. Correlations between precipitation (growing season) and yields in each of the four management systems were examined separately for each rotation phase using SYSTAT (version 8.0; Systat Software, Richmond, CA). For each correlation analysis yield values were annual treatment means (n 5 4).
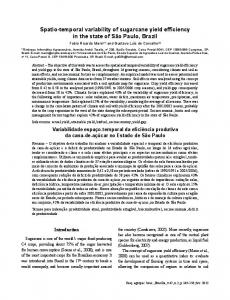
RESULTS Cropping systems affected annual yields (Table 1; Kravchenko et al., 2005) and average yields of corn and winter wheat (rotation phase 3 management system interaction: F6,52 5 9.57, P , 0.0001) (Table 2). Over the 4 yr that corn was present in the rotations, yields were similar in the CT, NT, and LI systems, and greater than in the ORG system (Fig. 1). Similarly, average winter wheat yields were highest in the CT and NT systems, intermediate in the LI system, and lowest in the ORG system. There was no significant effect of management system on soybean yield (Table 2). Table 2. Results of tests for management system effects (sliced by rotation phase) on average crop yields at the the W.K. Kellogg Biological Station Long Term Ecological Research (KBS LTER) (1993–2004). Effect Block Rotation phase Corn Soybean Winter wheat
df effect, error
F value
Pr . F
5,52
3.25
0.0125
3,52 3,52 3,52
23.77 0.48 36.01
,0.0001 0.6945 ,0.0001
A
B
Corn
C
Soybean
2.5
a
a
5.0
b 4.0
4.0
Wheat a
a b
2.4
Yield (Mg ha-1)
a
Yield (Mg ha-1)
6.0
Yield (Mg ha-1)
from 12 yr (four rotation cycles) and compare mean yield and temporal yield variability at a larger scale of analysis (whole plot). Because of the design of the KBS LTER each rotation phase (crop) was present four times over the study period from 1993 to 2004. For each crop, mean yields were determined by averaging yields within a replicate plot over the 4 yr that the crop was present in the rotation. This plot-level mean was considered the unit of replication. The coefficient of variation (CV) was used to assess temporal crop yield variability for each phase of the rotation using the method of Smith and Gross (2006). For each crop, the CV was calculated for each replicate plot as the standard deviation of yield (over the 4 yr that the crop was present in the rotation)/average yield (over the same 4 yr). The plot-level CV was considered the unit of replication. Moisture availability is often the main yield affecting factor (Kravchenko et al., 2005) and was expected to be the main driver of temporal yield variability. Daily precipitation data were collected by an automated weather station located at the LTER site. Average daily precipitation values from April through August were used to investigate relationships between yield variability and precipitation.
2.3 2.2 2.1 2.0
3.0
c 2.0
1.9 3.0
1.8 CT
NT
LI
ORG
1.0 CT
NT
LI
ORG
CT
NT
LI
ORG
Management System
Fig. 1. Average yields of (A) corn, (B) soybean, and (C) winter wheat at the W.K. Kellogg Biological Station Long Term Ecological Research (KBS LTER) from 1993 to 2004. Values are means 6SE, n 5 6; except NT, where n 5 5. Treatments sharing the same letter are not significantly different at P , 0.05, Tukey HSD. Management systems are CT, conventional; NT, no-till; LI, low-input; and ORG, organic.
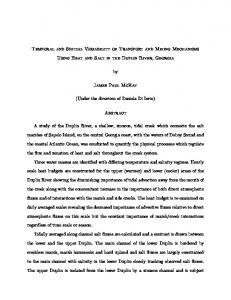
Temporal yield variability was affected by rotation phase, management system, and their interaction (Table 3). Variability ranged from a low of 17% for wheat in the CTand NT systems to a high of 48% in the ORG soybean (Fig. 2). For both the soybean (F3,52 5 13.21, P , 0.0001) and winter wheat (F3,52 5 7.90, P 5 0.0002) phases of the rotation, yields were least variable in the CT and NT systems, intermediate in the LI system, and most variable in the ORG system. Management system also had a significant effect on temporal yield variability in the corn phase of the rotation (F3,52 5 5.88, P 5 0.0015), with variability being lower in the LI system compared to the CT system. Over the course of the study, total annual rainfall ranged from 61 to more than 103 cm a year (Fig. 3). Total annual precipitation was below the 30-yr mean in 7 of the 12 yr of this study and during each of the 4 yr that corn occurred in the rotation. Within a growing season, variation in monthly precipitation totals ranged from 48 to 57%, 45 to 59%, and 23 to 92% during corn, soybean, and wheat years, respectively (Table 4). Over the 4-yr period that each crop was present in the rotation, variation in total growing season precipitation was higher during soybean years compared to corn and wheat years. Despite variation in growing season precipitation, the only significant associations (P , 0.05) observed between precipitation and yields occurred in CT soybean and NT and LI in wheat (for all, r2 . 0.97).
DISCUSSION The observation that average yields in the NT and LI management systems can be as high as those in the CT system supports earlier work showing that intensive chemical and mechanical management are not always necessary to maintain high yields (Eghball et al., 1995; Table 3. Results of analysis of variance (ANOVA) for the effects of rotation phase and management system on temporal yield variability (CV) at the the W.K. Kellogg Biological Station Long Term Ecological Research (KBS LTER) (1993–2004). Effect Block Rotation phase (R) Management (M) R3M
df effect, error
F value
Pr . F
5,52 2,52 3,52 6,52
1.61 26.58 12.89 7.01
0.1739 ,0.0001 ,0.0001 ,0.0001
1632
A Corn
B Soybean
a ab
0.30
a
110
C Wheat
c
b
ab c
a b
d
b
c
c
0.15
0.00
Reproduced from Agronomy Journal. Published by American Society of Agronomy. All copyrights reserved.
CT
NT
LI
ORG
CT
NT
LI
ORG
CT
NT
LI
ORG
Management System
Fig. 2. Inter-annual yield variability of (A) corn, (B) soybean, and (C) wheat phases of a 3-yr corn–soybean–wheat rotation at the the W.K. Kellogg Biological Station Long Term Ecological Research (KBS LTER) from 1993 to 2004. Values are means 6SE, n 5 6; except NT, where n 5 5. Treatments sharing the same letter are not significantly different at P , 0.05, Tukey HSD. Management systems are CT, conventional; NT, no-till; LI, low-input; and ORG, organic.
Pimentel et al., 2005; Smith and Gross, 2006; Grandy et al., 2006; Mallory and Porter, 2007). Several factors may have contributed to the yield responses in the alternative management systems. In a previous study conducted at the same site, the NT system was shown to have higher organic matter and improved soil quality in the top 5 cm relative to the CT system (the LI and ORG systems were not compared) (Grandy et al., 2006). The improved soil quality in this system was likely a major contributor to the observed yield response (Mallory and Porter, 2007). Other studies have reported similar soil quality differences between CT and NT management systems (Diaz-Zorita et al., 2004; Hammel, 1995). Several management practices differed between the CT and LI systems. The LI system received substantially fewer chemical inputs, but was over-seeded with a legume cover crop that may have provided supplemental N, improved soil quality, and may have contributed to weed suppression (Snapp et al., 2005). Row spacing and cultivation frequency also differed between the LI and CT, and these practices have been shown to affect row crop yields in previous studies (Zhang et al., 1996; Pedersen and Lauer, 2003). Additional experiments will
s
c s
w
w
c
s
w c s
w
100 30-yr mean
90
80
70
60
1993 1994 1995 1996 1997 1998 1999 2000 2001 2002 2003 2004
0.45
Total annual precipitation (cm)
Yield variability (CV)
0.60
AGRONOMY JOURNAL, VOL. 99, NOVEMBER–DECEMBER 2007
Fig. 3. Total annual precipitation at the the W.K. Kellogg Biological Station Long Term Ecological Research (KBS LTER) site from 1993 to 2004. Crops are c, corn; s, soybean; w, wheat.
be necessary to better understand how these factors may interact to contribute to yield responses in reduced input systems. Unlike the NT and LI systems, the ORG system received no chemical inputs and had the lowest yields for both the corn and winter wheat phases of the rotation. These results are in accordance with Smith and Gross (2006) who reported lower corn yields in a similar rotation under organic compared to conventional management. In contrast, Pimentel et al. (2005) found that crop yields in organically managed systems were similar to those in conventional systems. Differences in the response of the organic systems observed in these studies suggest that site attributes, crop management practices, or differences in the types of organic amendments may play a role determining the relative performance of organic vs. conventional systems (Mallory and Porter, 2007). This study also showed that management systems can impact the temporal variability of crop yields. Different
Table 4. Total monthly precipitation and precipitation variability during the growing season over the 12-yr study period at the the W.K. Kellogg Biological Station Long Term Ecological Research (KBS LTER). Precipitation Year
Rotation phase
April
May
June
July
August
Growing season†
CVGS‡
1993 1996 1999 2002
corn corn corn corn CVR§ soybean soybean soybean soybean CVR wheat wheat wheat wheat CVR
116 82 131 55 0.36 83 35 91 85 0.35 77 100 83 20 0.50
28 70 51 98 0.48 13 98 192 137 0.68 72 29 155 248 0.77
157 131 68 33 0.58 175 104 68 34 0.63 92 59 94 85 0.20
mm 64 21 65 111 0.56 160 30 79 54 0.70 119 104 34 76 0.45
81 53 32 134 0.59 166 81 126 94 0.32 110 40 137 131 0.43
446 357 347 431 0.13 597 348 556 404 0.25 360 292 366 429 0.15
0.55 0.57 0.54 0.48
1994 1997 2000 2003 1995 1998 2001 2004
0.59 0.50 0.45 0.49 0.23 0.49 0.54 0.92
† Growing season considered April to August for corn and soybean and April to July for wheat. ‡ CVGS, coefficient of variation of total monthly precipitation over the growing season. § CVR, coefficient of variation of precipitation occurring in the same month (or total from April–August) over the 4-yr period that a crop was present in the rotation.
Reproduced from Agronomy Journal. Published by American Society of Agronomy. All copyrights reserved.
SMITH ET AL.: YIELD VARIABILITY UNDER MANAGEMENT SYSTEMS
factors, including year-to-year differences in precipitation, timing of agronomic practices, and temporal variability in pest abundance have been shown to impact yield stability (Porter et al., 1998; Andresen et al., 2001) and these may interact with management systems (Kravchenko et al., 2005; Mallory and Porter 2007). Our analysis of the precipitation data did not explain the yield variability observed in this experiment; however, our ability to link these two variables was limited by the number of years that each crop was present over the study period. Examination of the growing season precipitation data (Table 4) suggests that some of the differences in yield variability between soybean and wheat may have been due to differences in precipitation variability over the cropping periods (CVs for growing season precipitation during soybean and wheat years were 25 and 15%, respectively). However, differences in growing season or monthly precipitation variability do not appear to explain the performance of corn relative to soybean and wheat, or the differences between management systems. Environmental variation occurring at a finer scale than we measured in this study may be an important determinant of temporal crop yield variability (Stockle et al., 2003; Kravchenko et al., 2005) and should be assessed in future studies. Low temporal yield variability is often cited as a beneficial aspect of organically managed systems attributed to increased organic matter and reduced susceptibility to drought stress (Henning, 1994; Delate, 2002; Lotter et al., 2003; Pimentel et al., 2005; Mallory and Porter, 2007). Thus, the finding that annual yields in the ORG system were significantly lower and more variable than the other studied systems was somewhat surprising, but not without precedent. A previous study conducted at the KBS LTER site found that the spatial variability of crop yields was also higher in the ORG system compared to the CT and NT systems, particularly in relatively dry years (Kravchenko et al., 2005). Other studies have observed that yields in organic systems that received composted dairy manure were more stable than in conventional systems (Lotter et al., 2003; Pimentel et al., 2005; Smith and Gross, 2006; Mallory and Porter, 2007). It is possible that the lack of manure inputs in the ORG system at the KBS LTER may have reduced this system’s ability to tolerate environmental variability, as compost can increase soil organic matter and water holding capacity (Clark et al., 1998). Thus, the method of organic-based nutrient management in organic systems may play a key role in determining crop yield stability. A ranking of the four management systems based on both long-term yields and yield variability suggests that the NT system may be the least risky crop management strategy under the soil and growing conditions specific to this study. The success of the NT system observed in this study may be due to greater soil carbon accumulation and associated impacts on soil quality (Grandy et al., 2006), which may have ameliorated yield responses to environmental fluctuations relative to the tilled systems (Lotter et al., 2003). The LI system performed better than the ORG system, both in terms of long-term yields and yield variability, suggesting this
1633
management system may provide a potential strategy to minimize chemical inputs while still maintaining relatively high yields and yield stability. Considering the yield data from both the NT and LI systems, determining the degree to which a reduced chemical-input, no-till system may be a viable management option for this region may be a fruitful avenue of future research. Additionally, further studies will be necessary to understand the role of specific organic management practices in improving yields and buffering organic management systems against year-to-year yield variability. ACKNOWLEDGMENTS Support for this research was provided by the NSF LongTerm Ecological Research Program at the W.K. Kellogg Biological Station (KBS) and by the Michigan Agricultural Experiment Station. We thank the KBS technical personnel for assistance in data collection and processing. Financial support to analyze this data set and prepare this manuscript was partially provided by the Montana Agricultural Experimental Station, the Organic Farming Research Foundation, and the USDA Integrated Organic Program. K. Gross provided helpful comments on an earlier draft of this manuscript. This is W.K. Kellogg Biological Station Contribution no. 1427.
REFERENCES Altieri, M.A. 1999. The ecological role of biodiversity in agroecosystems. Agric. Ecosyst. Environ. 74:19–31. Andresen, J.A., G. Alagarswamy, C.A. Rotz, J.T. Ritchie, and A.W. LeBaron. 2001. Weather impacts on maize, soybean, and alfalfa production in the Great Lakes region, 1895–1996. Agron. J. 93: 1059–1070. Buhler, D.D. 1995. Influence of tillage systems on weed populationdynamics and management in corn and soybean in central USA. Crop Sci. 35:1247–1258. Clark, M.S., W.R. Horwath, C. Shennan, and K.M. Scow. 1998. Changes in soil chemical properties resulting from organic and lowinput farming practices. Agron. J. 90:662–671. Crum, J.R., and H.P. Collins. 1995. KBS soils. Available at http://lter. kbs.msu.edu/about/site_description/soils.php (verified 5 Sept. 2007). Davis, A.S., K.A. Renner, and K.L. Gross. 2005. Weed seedbank and community shifts in a long-term cropping systems experiment. Weed Sci. 53:296–306. Delate, K. 2002. Using an agroecological approach to farming systems research. Hortic. Technol. 12:345–354. Diaz-Zorita, M., J.H. Grove, L. Murdock, J. Herbeck, and E. Perfect. 2004. Soil structural disturbance effects on crop yields and soil properties in a no-till production system. Agron. J. 96:1651–1659. Drinkwater, L.E., D.K. Letourneau, F. Workneh, A.H.C. van Bruggen, and C. Shennan. 1995. Fundamental differences between conventional and organic tomato agroecosystems in California. Ecol. Appl. 5:1098–1112. Eghball, B., G.D. Binford, J.F. Power, D.D. Baltensperger, and F.N. Anderson. 1995. Maize temporal yield variability under long-term manure and fertilizer application-fractal analysis. Soil Sci. Soc. Am. J. 59:1360–1364. Grandy, A.S., T.D. Loecke, S. Parr, and G.P. Robertson. 2006. Longterm trends in nitrous oxide emissions, soil nitrogen, and crop yields of till and no-till cropping systems. J. Environ. Qual. 35: 1487–1495. Hammel, J.E. 1995. Long-term tillage and crop rotation effects on winter wheat production in northern Idaho. Agron. J. 87:16–22. Henning, J. 1994. Economics of organic farming in Canada. p. 143–160. In N.H. Lampkin and S. Padel (ed.) The economics of organic farming: An international perspective. CAB International, Wallingford, UK. Kladivko, E.J. 2001. Tillage systems and soil ecology. Soil Tillage Res. 61:61–76.
Reproduced from Agronomy Journal. Published by American Society of Agronomy. All copyrights reserved.
1634
AGRONOMY JOURNAL, VOL. 99, NOVEMBER–DECEMBER 2007
Kravchenko, A.N., G.P. Robertson, K.D. Thelen, and R.R. Harwood. 2005. Management, topographical, and weather effects on spatial variability of crop grain yields. Agron. J. 97:514–523. Little, R.C., G.A. Milliken, W.W. Stroup, and R.D. Wolfinger. 1996. SAS system for mixed models. SAS Institute, Cary, NC. Lotter, D.W., R. Seidel, and W. Liebhardt. 2003. The performance of organic and conventional cropping systems in an extreme climate year. Am. J. Alternative Agric. 18:146–154. Mallory, E.B., and G.A. Porter. 2007. Potato yield stability under contrasting soil management strategies. Agron. J. 99:501–510. Menalled, F.D., K.L. Gross, and M. Hammond. 2001. Weed aboveground and seedbank community responses to agricultural management systems. Ecol. Appl. 11:1586–1601. Menalled, F.D., R.G. Smith, J.T. Dauer, and T.B. Fox. 2007. Impact of agricultural management systems on carabid beetle communities and invertebrate weed seed predation. Agric. Ecosyst. Environ. 118:49–54. Pedersen, P., and J.G. Lauer. 2003. Corn and soybean response to rotation sequence, row spacing, and tillage system. Agron. J. 95: 965–971. Pimentel, D., P. Hepperly, J. Hanson, D. Douds, and R. Seidel. 2005. Environmental, energetic, and economic comparisons of organic and conventional farming systems. Bioscience 55:573–582. Porter, P.M., J.G. Lauer, D.R. Huggins, E.S. Oplinger, and R.K. Crookston. 1998. Assessing spatial and temporal variability of corn and soybean yields. J. Prod. Agric. 11:359–363. Robertson, G.P., and S.M. Swinton. 2005. Reconciling agricultural productivity and environmental integrity: A grand challenge for agriculture. Front. Ecol. Environ. 3:38–46. Sanchez, J.E., R.R. Harwood, T.C. Willson, K. Kizilkaya, J. Smeenk,
E. Parker, E.A. Paul, B.D. Knezek, and G.P. Robertson. 2004. Managing soil carbon and nitrogen for productivity and environmental quality. Agron. J. 96:769–775. Scheu, S. 2001. Plants and generalist predators as links between the below-ground and above-ground system. Basic Appl. Ecol. 2:3–13. Smith, R.G., and K.L. Gross. 2006. Weed community and corn yield variability in diverse management systems. Weed Sci. 54:106–113. Snapp, S.S., S.M. Swinton, R. Labarta, D. Mutch, J.R. Black, R. Leep, J. Nyiraneza, and K. O’Neil. 2005. Evaluating cover crops for benefits, costs and performance within cropping system niches. Agron. J. 97:322–332. Southworth, J., J.C. Randolph, M. Habeck, O.C. Doering, R.A. Pfeifer, D.G. Rao, and J.J. Johnston. 2000. Consequences of future climate change and changing climate variability on maize yields in the midwestern United States. Agric. Ecosyst. Environ. 82:139–158. Stockle, C.O., M. Donatelli, and R. Nelson. 2003. CropSyst, a cropping systems simulation model. Eur. J. Agron. 18:289–307. Tilman, D., J. Fargione, B. Wolff, C. D’Antonio, A. Dobson, R. Howarth, D. Schindler, W.H. Schlesinger, D. Simberloff, and D. Swackhamer. 2001. Forecasting agriculturally driven global environmental change. Science (Washington, DC) 292:281–284. Varvel, G.E. 2000. Crop rotation and nitrogen effects on normalized grain yields in a long-term study. Agron. J. 92:938–941. Wardle, D.A., K.S. Nicholson, K.I. Bonner, and G.W. Yeates. 1999. Effects of agricultural intensification on soil-associated arthropod population dynamics, community structure, diversity and temporal variability over a seven-year period. Soil Biol. Biochem. 31:1691–1706. Zhang, J.H., A.S. Hamill, and S.E. Weaver. 1996. Corn yield after 10 years of different cropping sequences and weed management practices. Can. J. Plant Sci. 76:795–797.