by the Survey Lab at the Bureau of Business and Economic Research,. University of Florida. ... EDMs are built from interviews with a relatively small number of ... Florida, and H. Gladwin and Murtaugh (1984) tested a model for car buying on ...
Human Organization, Vol. 65, No. 1, 2006 Copyright © 2006 by the Society for Applied Anthropology 0018-7259/06/0100103-12$1.70/1
Testing an Ethnographic Decision Tree Model on a National Sample: Recycling Beverage Cans Gery W. Ryan and H. Russell Bernard We report here on an ethnographic model of a decision that Americans make regularly: to recycle beverage cans or not. The model was derived from 21 ethnographic interviews and 70 structured interviews in Florida and North Dakota. Ethnographic decision models are not new, but we show here that these models can be tested for both internal and external validity. We test internal validity by comparing the model’s predictions systematically to what people say about their own behavior. We test external validity by comparing the predictions of the ethnographic model to those of a representative sample of 386 people across the United States. The original model accounts for about 90% of the reported behaviors, while the national model predicts about 85% of the reported behaviors. Key words: decision modeling, recycling behavior, ethnographic methods
Introduction
W
e report here on methods to test the internal and external validity of ethnographic decision models (EDMs). EDMs are qualitative, causal analyses that predict real, episodic behaviors, rather than—as does so much social research—the intent to behave in a certain way. EDMs can be displayed as decision trees (e.g., C. Gladwin 1989), as decision tables (Mathews and Hill 1990; Young and Garro 1994), or as sets of rules in the form of IF-THEN statements. For example, Ryan and Martínez (1996) modeled the decision of mothers in rural Mexico to take their children to a doctor in response to an episode of childhood diarrhea. One of the rules in the model was: IF there is blood in the stool, OR IF the episode lasts more than eight days, THEN take the child to the doctor. Typically, EDMs predict at least 80% of the behavior under study. Such effective models are easiest to build for questions about behaviors that can be answered yes or no, like “Did you buy a new computer in the last 30 days?” or “Did you go to Lagos any time during the past year?” However,
The research reported here was conducted as part of a larger project, on green culture in the U.S., under a grant from the Ford Motor Company to the University of Florida. We thank Frode Maaseidvaag, Irving Salmeen, and Kuang Wei of Ford Motor Company for their help on this project. The national CATI survey reported here was conducted by the Survey Lab at the Bureau of Business and Economic Research, University of Florida. Our thanks to Christopher McCarty for help in designing and fielding the survey. Our thanks to Anthony Hebert, who collected the ethnographic data in North Dakota, and thanks also to Stephen Borgatti and Susan Weller who offered helpful comments on earlier drafts of this article.
VOL. 65, NO. 1, SPRING 2006
researchers have used EDMs to understand more complex behavioral outcomes, like the price that people place on products (H. Gladwin 1970; Plattner 1984; Quinn 1978); the choice by farmers to plant this or that crop on their land (C. Gladwin 1976, 1989; Barlett 1977); where fishermen choose to hunt for fish (Gatewood 1983); and the allocation of tasks in households (Mukhopadhyay 1984). Medical social scientists have long used EDMs to understand the choice, by lay people, of treatments for various illnesses (Hill 1998; Mathews and Hill 1990; Montbriand 1994; Ryan and Martínez 1996; Weller et al. 1997; Young and Garro 1994). Breslin et al. (2000) applied the EDM method to referrals for outpatient treatment by clinicians of drug-abuse patients; Bauer and Wright (1996) modeled the decision by Navajo mothers to breast feed or use formula; Johnson and Williams (1993) modeled decisions by IV drug users in Houston to take the risk of sharing needles; and Beck (2000) used the method to model the decision by psychologists in British Columbia to report suspected cases of child abuse to the authorities. EDMs are built from interviews with a relatively small number of people (20–60) and are usually tested on a similarly small and local sample. C. Gladwin et al. (2001), however, tested a model for the decision to evacuate in a hurricane (Andrew in 1992, Erin in 1995) on 954 respondents in South Florida, and H. Gladwin and Murtaugh (1984) tested a model for car buying on 114 cases selected from the National Transportation Survey of 1978. In what follows, we explain ethnographic decision modeling in detail; derive and test a model for recycling beverage cans; and test the results of the ethnographic model for internal and external validity. It is well known that the single best predictor of beverage can recycling is the presence of a recycling bin at the moment the decision has to be made (see for example, 103
Austin et al. 1993; Larson et al. 1995; Ludwig et al. 1998). We chose deliberately to model a decision with a well-known predictor in order to test the efficacy of our model, both at the local and at the national level. Finally, we discuss critiques of ethnographic decision modeling and the implications of our findings for using the method in practical applications.
Ethnographic Decision Tree Modeling Christina Gladwin (1989) made the method of ethnographic decision tree modeling widely accessible, laying out the steps clearly. (1) Select a specific behavioral choice to model and elicit decision criteria from a convenience sample of respondents. (2) Further elaborate and verify the decision criteria on a purposive, heterogeneous sample of informants. (3) Use the ethnographic data from step 1 and the survey data from step 2 to build a hierarchical decision model. (4) Test the model on an independent and, if possible, representative sample from the same population. We will add an additional step here: (5) Validate the model with responses from people about why they acted as they did.
Step (1) Selecting a Behavioral Choice to Model and Eliciting the Decision Criteria for Recycling In the study reported here, we modeled people’s decision to recycle the last aluminum beverage can they had in their hand and we treated the decision as dichotomous—either people recycled the can or they did not. If people told us that they saved the can to recycle later or if they said they threw the can into a recycling bin, we treated both responses as recycling. To discover the criteria that people use in deciding whether to recycle a can and how these criteria are linked together, we did exploratory, free-ranging interviews with a convenience sample of 21 informants, 16 in Florida and 5 in North Dakota, sampling for diversity across, gender, age, and education levels. The sample included 12 men and 9 women, ranging in age from 15 to 61 and in education from 8 to 21 years. We asked each informant: “Think about the last time you had a can of something to drink in your hand—soda, juice, water, beer, whatever. Did you recycle the can? Why [Why not?]” Our goal was to elicit as many possible rationales for why people recycled or not. By the twenty-first person, there were few new rationales being mentioned, so we stopped. Table 1 shows 40 examples of the responses we retrieved from our informants. Most people claimed to have recycled the can, so there are more reasons for recycling than for not recycling. We derived 30 criteria from these responses for the decision to recycle a can. The 30 criteria are questions 4–34 in the Appendix.
Step (2) Collecting Data for a Preliminary Model Next, survey data are collected from ethnographic informants in order to build a preliminary model of the behavior. Ethnographic informants are people who know about the be104
havior of interest and about the culture surrounding the behavior. That is, they can knowledgeably respond to questions about their own behavior (in this case, about getting rid of an empty beverage can) and about their reasons for their behavior. The data collected from these informants are survey data because every informant is asked the same set of questions. We interviewed 70 informants, 37 in Florida and 33 in North Dakota. Again, we purposefully selected a diverse group of informants (age range 18–71 years, education 1–23 years, 48% male) in hopes that we could build a robust model that would account for can-recycling behavior across a wide range of people. Our sample size was based on some crude calculations. We wanted enough cases to be able to build a bifurcated tree that was at least three levels deep and where each endpoint would contain at least 5 people. Having at least 5 cases at each endpoint gives us confidence that the decision criteria are working in some meaningful way and are nontrivial. We calculate the minimum sample size for such a tree as follows: Minimum Sample Size = Minimum cases in each endpoint * 2(# of Levels)
In our case, the minimum sample size would have been 40 (5*23). The reason this is a minimum sample size is that our assumptions are met only if the cases bifurcate perfectly at each decision-point in the tree. Our experience with decision trees, however, suggests that this rarely happens, and we try to double the minimum sample size to be conservative. Although 70 is not quite double the minimum sample size, it provides a reasonable safety margin. We began our interviews with the same initial question we had asked in Step 1: “Think about the last time you had a can of something to drink in your hand—soda, juice, water, beer, whatever. Did you recycle the can? Why [Why not?]” Then we asked each of those 70 people questions 4–34 in the Appendix. Note that some of the questions are about general behavior (“Do you normally recycle cans at home?”); some are about structural conditions (“Was a recycling bin handy?”); and some are about attitudes (“Do you consider yourself environmentally conscious?”). Also note that questions 10–14 are expansions of the question “Where were you when you had that used beverage can in your hand?” into five binary questions. This ensures that all informants are given the same set of cues in getting the data to build the preliminary model.
Step (3) Building the Preliminary Model In the next step, the ethnographic data from Step 1 and the survey data from Step 2 are analyzed to discover patterns among the decision criteria and the reported behavior. These patterns are formalized into an explicit logical model (or several models) for predicting behaviors. The model will be tested on a third, independent sample in the next phase of the research, but this stage is for generating empirically based hypotheses. HumaN OrganizatioN
Table 1. Decision Criteria for Recycling Cans
Reasons Given for Recycling
Reasons Given for Not Recycling
1. It’s wasteful to just throw it away. 1. I was traveling and I had no place to recycle it. 2. The city has a recycling program. The garbage 2. Bins aren’t around. I didn’t have a recycling bin. man picks it up. There aren’t enough recycling bins available. 3. To help save the environment. 3. There’s no recycling program where I live. 4. Recycling bins are conveniently located. No city recycling program. 5. That’s what big blue is for. 4. Because I don’t have big blue. 6. My kid made a pact with a TV club so she now 5. I didn’t think about it. recycles. 6. I gave it to kids who turn it in for money. 7. I’m concerned about the environment. 7. Forgot. 8. It’s environmentally sound. 8. Recycling is not available to me. 9. Land is not a renewable resource. 9. Laziness. 10. I save cans to get money for them. 10. The recycling bin was not conveniently located. 11. The people I’m staying with recycle, so I do, too. 11. Because I have to separate out cans 12. The bins were around. from my garbage and that’s a problem. 13. It’s useful and can be used again. 12. Lack of education. 14. To keep the environment clean. 13. I don’t have enough time. 15. Because of habit; we usually put it in big blue. 16. Because I’m environmentally conscious. 17. To preserve the environment for my kids. 18. It’s not biodegradable. 19. It’s no good in the landfill. 20. Because it’s just good to recycle. 21. It’s easy to do. 22. Because it’s the right thing to do. 23. Because it’s the big thing to do these days. 24. Because someone told me to. 25. We shouldn’t cover the land up with garbage. 26. To buy more beer. 27. Because if you don’t you have to pay a fee.
Building initial models is the most difficult of all the steps. There is no best way to discover patterns. Some researchers have used formal, even automated procedures; most rely heavily on the human power of induction. One formal approach is to lay out all possible combinations that can occur among the factors that are identified as important to the decision. One way to do this is with vignettes, like the following: You’re [standing at a bus stop] [at home] [at work]. You’re [alone] [not alone] [and your children are there]. You have a can of [soda][juice][beer] in your hand. When you finish the can, you [throw it in the garbage] [put it in a recycle bin] [leave it anywhere that’s handy, like a desk or on the ground].
The modal responses from vignettes like these can be used to generate the decision rules in the model. This approach is relatively simple and replicable and was used by Weller et al. (1997) in their Guatemala study of medical decisions, and by Young and Garro (1994) in their study of illness in Mexico. VOL. 65, NO. 1, SPRING 2006
The vignette method also means that this exploratory, modelbuilding phase is limited to a relatively small number of factors. Even with just 8 binary factors, there are 28=256 combinations, which means that each informant would have to see 256 vignettes. In fact, at the exploratory level, we often have many more factors. In our case, as the Appendix shows, we had 30 factors. Another formal approach involves the use of artificial intelligence (AI) or data mining algorithms to build and prune decision trees (Mingers 1989a, 1989b). AI algorithms semi-automate the model-building procedure by identifying the possible combinations of factors (and the order of those factors) that produce the various outcomes (here, recycled or didn’t). Some tree-pruning procedures are available in statistical packages such as SYSTAT’s “Classification and Regression Tree Analysis” (SYSTAT 2000); and the Boolean induction procedures, called qualitative comparative analysis (QCA), developed by Ragin (1987) can be used to make tree-pruning decisions. (For QCA software, see Drass and Ragin 1992 and http://www.compasss.org/Softwares. htm. QCA procedures are also an undocumented feature in ANTHROPAC 4.95/X [Borgatti 1992]. 105
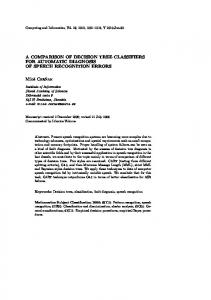
Figure 1. Decision to Recycle Cans (Ethnographic Sample, N = 70)
A less formal approach is to apply the principles of analytic induction first introduced by John Stuart Mill (1874:280ff): closely examine cases that do not fit the model, and modify the model accordingly until it achieves some desired level of accuracy. This iterative process is the method recommended by Gladwin (1989) and is the method we used in our study here. From the responses to our survey of 70 informants in Florida and North Dakota, we drafted models of the decision process, trying different combinations of variables. The result of this process is our preliminary model, shown in Figure 1. From examination of the data, the question “Were you at home when you had that can in your hand?” produced the fewest errors of any single criterion. Thus, guessing that everyone at home recycled and that everyone not at home did not recycle produces 6 errors (22% of the 27 cases) on the left-hand branch and 11 errors (26% of the 43 cases) on the right-hand branch, for a total of 17 errors and an accuracy rate of 53 out of 70 cases, or 76%. The six errors on the left-hand branch of Figure 1 are the 4+2=6 people who did not recycle when the single-criterion model (at home, not at home) predicted they did. Similarly, to obtain the 11 errors on the right-hand side of Figure 1, count those who said they recycled (7+2+1+1) when the single-criterion model predicted they did not (2 of the 3 singleton errors on the right-hand branch of Figure 1). 106
A slightly more complex model improves the results from 76% to 90%. First, the left-hand branch of the model: Of the 27 informants who were at home, the best predictor of who did or who did not recycle was to ask whether they recycled any other products. Of the 23 who said they recycled other products, 21 (91.3%) recalled recycling the last can they had in their hand. All 4 of those who said they didn’t recycle other products also recalled not recycling the can. The rule here is: For those at home who recycle other products, guess “recycled the can”; otherwise guess “didn’t recycle the can.” This results in just 2 errors out of 27 cases, or 92.6% correct. On the right-hand branch of the model, just guessing that nobody recycled produced 32 out of 43 correct answers, or 74.4% correct. This improves to 88.4% correct by distinguishing whether those not at home were at work or elsewhere, and then asking: “Was a recycling bin conveniently located nearby?” First, as shown in Figure 1, when bins were nearby, 7 of the 8 (87.5%) respondents who were at work recycled. When bins were not nearby, 11 of the 12 respondents (91.7%) who were at work said that they didn’t recycle. This branch of the model gets 18 out of 20, or 90% correct. Second, among the 23 respondents who were neither at home nor at work, asking if a recycling bin was nearby produces a model with just three errors, or 87% correct. Overall, on the right-hand branch, the HumaN OrganizatioN
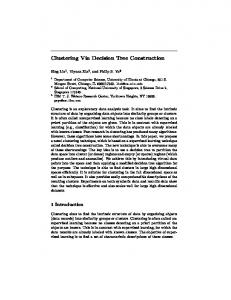
Figure 2. Decision to Recycle Cans (Ethnographic Sample, N = 70)
model produces five errors (88.4% correct), and the accuracy of the complete model (both left- and right-hand branches) is 63 right out of 70, or 90%. This is 77% better than expected by chance (Klecka’s tau = .77; see Klecka 1980:50–51). Now, the model in Figure 1 can be made more parsimonious by collapsing the two paths “At Work?” and “Not at Work?” as shown in Figure 2. This change affects neither the error rates nor the value of tau. In other words, the model predicts equally well whether a person is at work or anywhere else, since most of the predictive power on the right side of the model is based on a bin being nearby. The extra criterion in the model, however (at work-not at work), with its two extra paths, shows that people at work recycle more than do those who are neither at home nor at work—40% (7+1=8 of 20) compared to 13% (2+2=3 of 23). The extra criterion thus provides information on the size and location of the problem—information that suggests where to put recycling bins. We discuss this further in the next step.
Step (4) Testing the Model on an Independent Sample An accuracy rate of 90% may seem high, but we should hardly be surprised if a model accounts for the data on which it VOL. 65, NO. 1, SPRING 2006
is built. All we are in doing in Figure 1 is representing graphically what people told us they did. If there is pattern in the responses to our questions about whether the criteria applied to informants’ behaviors, then we expect the model to do well. Models, however, are hypotheses. Their validity does not depend so much on how they are derived but on how well they stand up to tests on an independent sample of people who were not involved in building the model in the first place. Samples for testing EDMs are typically drawn from the same local populations that are used to build the models. Strong agreement between two, independently derived EDMs is the equivalent of repeating a laboratory experiment in terms of reliability and internal validity. Even then, as with all ethnographically derived findings, there is doubt about external validity—whether the results can be generalized to a larger population (Weller et al. 1997). To see how the decision model performed on another sample, we tested the model in Figure 1 on a representative, national sample of respondents. In 1978, H. Gladwin and Murtaugh (1984) built an EDM on 45 interviews in Orange County, California, to predict the size and cost of automobiles that people would buy after the rise of oil prices in the 1970s. The factors in their model assessed the transportation requirements of the informants, with variables like family size and the age of the car owned at the time of the interview. 107
Figure 3. Decision to Recycle Cans (National Sample, N = 386)
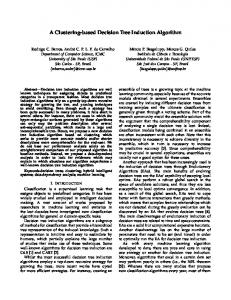
H. Gladwin and Murtaugh tested their EDM on 114 cases of actual new-car purchases from the 1,000 nationally representative cases in the National Transportation Survey of 1978. Some 73% of the people in the national data bought cars that conformed to the size predicted by the EDM, but 64% bought cars that were more expensive than what the model predicted they would buy, given their transportation requirements. The pioneering work of H. Gladwin and Murtaugh showed that it was possible to test an EDM for external validity. Our national, representative cluster sample comprised 386 respondents who were contacted by telephone using randomdigit dialing. The clusters represent the major areas of the United States (the Northeast, the Southeast, the Southwest, the Midwest, and the Far West, not including Alaska or Hawaii). The median age of all Americans is about 37 years. The ages of our respondents ranged from 19 to 85 and their median age of 40 (mean 36.6) reflects the median age of Americans 19 years and older. Like most national survey samples, women are overrepresented in ours (56%), reflecting the fact that women between the ages of 19 and 85 comprise 52% of the population and that more women are reachable at home and are willing to respond to surveys. Our sample was 84% white, reflecting the national distribution of 82.2%. A national, representative sample provides a strong test of an ethnographically derived 108
model since it measures the extent to which a local sample of informants (70 in our case) mirrors national culture on a particular behavior. Figure 3 shows the results. Of the 386 respondents, 228 (59%) said they were at home, 104 (27%) said they were at work, and 54 (14%) reported being somewhere else when they last recycled a can. Of those who were at home, 160+10=170 (74.6%) reported recycling the last beverage can they had in their hand. Of the 173 people who were at home and who also said they recycled other products besides cans, 160 (92.5%) recalled recycling the can, compared to 91.3% in the ethnographic sample. Of the 55 people at home who reported not recycling other products besides cans, 45 (81.8%) recalled not recycling the can, compared to 100% for the ethnographic sample. Of the 104 respondents who were at work, 60+20=80 (77%) recalled recycling. Of the 54 respondents who were neither at home nor at work in the national sample, 13+14=27 (50%) recalled recycling. This is about two-thirds the rate of those respondents who were at home or at work (74.6% and 77%, respectively). But here again, knowing whether there was a conveniently located recycling bin increases the predictive accuracy of the model from 50% to 70.4% (2+14=16 errors out of 54). Applying the ethnographic model to national data produces 14 errors, out of 39 cases, in predicting that people who HumaN OrganizatioN
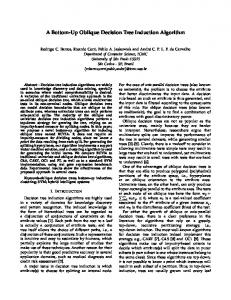
Figure 4. Decision to Recycle Cans - Simplified Model (National Sample, N = 386)
are neither at home nor at work, and who have no convenient recycling bin around, will not recycle. As expected with a new sample, the accuracy rate is lower than that of the original sample. The overall accuracy of the national model is 85% (compared to 90% for the ethnographic model) and this 85% accuracy rate is 59% better than chance (Klecka’s tau=.59). As with the locally derived model, we can simplify the national model by combining the “At Work” and “Not At Work” paths, as shown in Figure 4. Just as with the ethnographic model, adding the question about where the behavior took place has no effect on prediction power. It does, however, corroborate the policy-relevant information produced in the ethnographic model regarding where to put scarce resources if we want to increase recycling behavior. Of the 158 people in the national sample who said they were not at home when they had that last beverage can in their hands, 20% (20+1=21 out of 104 in Figure 3) said they didn’t recycle if they also said they were at work. By contrast, 50% (25+2=27 out of 54 in Figure 3) of the not-home people said they didn’t recycle if they also said they were not at work. It may be tempting to go after the 50% error rate but the not-home/not-at-work condition covers many conditions: people who are at football games, or driving on the freeway, or visiting other people’s houses, or window shopping. With so many conditions, and limited resources with which to put VOL. 65, NO. 1, SPRING 2006
out recycling bins, it is going to be tough to have an impact on that 50% error rate. In the short term, it’s easier to imagine incentives for getting employers to put out those bins. We shouldn’t give up on the people who are neither at home nor at work, though. To make headway on this problem, we can investigate where these people actually spend their time when they are neither at home nor at work and their rationales for recycling or not recycling under these conditions. If a lot of the time is spent driving, then perhaps putting recycling cans in parking garages and parking lots will help. Tables 2 and 3 show the outcomes for the ethnographic model tested on the local (N=70) and the national (N=386) samples. Table 2 shows the complete data distribution, while Table 3 summarizes the findings in percentages. From Table 3, we see that, in the national sample, 59% of the recalled behaviors occurred at home, 27% occurred at work and 14% occurred someplace else. In comparison, 39% of the recalled recycling behaviors occurred at home in the ethnographic sample, 29% occurred at work, and 33% occurred somewhere else. This is hardly surprising since, whatever time of day we called, our interviewers caught most people at home. Thus, when we asked them to recall the last time they drank from an aluminum can, they might have remembered behaviors at home even if those behaviors were not the closest episode. 109
Table2.2. Decision Decisionto toRecycle: Recycle:Comparisons Comparisonsbetween betweenthe theEthnographic Ethnographicand andNational NationalSamples Samples Table At Home?
Decision Rules
Predicted Outcome Sample1
Yes
No
Recycle Other Things?
At Work? Yes
No
Is a Bin Nearby?
Is a Bin Nearby?
Yes
No
Yes
No
Yes
No
Recycle
Don’t
Recycle
Don’t
Recycle
Don’t
Eth
Nat
Eth
Nat
Eth
Nat
Eth
Nat
Eth
Nat
Eth
Nat
Respondents
23
173
4
55
8
61
12
43
4
15
19
39
% Sample
33
45
6
14
11
16
17
11
6
4
27
10
Correct
21
160
4
45
7
60
11
23
2
13
18
25
% Correct
91
93
100
82
88
98
92
54
50
69
95
64
1
Eth = Ethnographic sample; Nat = National sample.
Our ethnographic model is robust in terms of predicting whether people in the national sample recycle beverage cans. Whether people report having been at home, at work, or elsewhere when they last had an aluminum beverage can in their hand, the model predicts 2%, 10%, and 19% more cases correctly in the national sample than it does in the ethnographic model (this is 91% vs. 93%, 88% vs. 98%, and 50% vs. 69% correct in the last line of Table 2). The model does less well on predicting when people don’t recycle. Accuracy rates were 18% less for recycling at home (100% vs. 82%), 38% less for those at work (92% vs. 54%), and 31% less for those somewhere else (95% vs. 64%). One explanation is that there is a social desirability response bias, so people claim that they recycled, when, in fact, they didn’t. Though we suspect that this is a contributing factor, we believe it doesn’t account for all the differences.
Step (5) Assessing the Validity of Ethnographic Decision Models Garro asserts correctly (1998:352) that “numerical assessments, such as a prediction value greater than what would be expected by chance, cannot be the only yardstick for decision models.” If an ethnographic decision model is doing a good job, we expect it to mimic, at least to some degree, how informants describe their decision-making processes. We asked our ethnographic informants to answer in their own words why they recycled, before we asked systematically about the decision-criteria. We can, therefore, examine the 110
fit between people’s justifications of their choice to recycle or not and the model’s predictions. We do this by flowing individual recycling cases down the decision tree and examining the degree to which each end point in the tree (each final decision) corresponds to informants’ own accounts.
Table 3. Distribution of Behaviors for the Two Samples Variable
Ethnographic Sample
National Sample
Location At home Work Other
27/70 (39%) 20/70 (29%) 23/70 (33%)
158/386 (41%) 104/386 (27%) 54/386 (14%)
For those at home Recycle other products 23/27 (85%) For those at work Bin nearby 8/20 (40%) For those elsewhere Bin nearby 4/23 (17%) Overall recycle 32/70 (46%)
173/228 (76%) 61/104 (59%) 15/54 (28%) 278/386 (72%)
HumaN OrganizatioN
TIFF File from Corel Table 4. Verbatim Justifications for 33 Recycling Choices from Ethnographic Sample Table 4. Verbatim Justifications for 33 Recycling Choices from Ethnographic Sample Decision Rules
Yes
Yes
Choice
Verbatim Justification
Yes
I know you can recycle it and the bin was easy to get to. I believe in it, and it's good for the environment. I feel that it's some form of token effort in trying to protect the environment and keep stuff out of landfills. I recycle as much as I can. For recycling-because garbage just doesn't disappearCif you recycle there is less garbage then. They pick it up on WednesdayCbecause it's a good thing to do. It is required to recycle cans. It is mandatory, and I believe in recycling. It is mandatory.
Recycle Other Things?
No
No
At Home?
Yes
No
Yes
Yes
I always recycle aluminum cans. . . . I don't know . . . because I can, because it's available. It's an automatic thing at work; we all recycle there. I wasn't gonna mess with itCit was easy. One of the operator collects them at work, and she takes the bag weekly to put it . . . to take in for recycling.
No
No
We're not allowed to keep cans on the job. There was no recycling center near by. A lady at work collects themCso I put them in the bag to give to this one lady.
Yes
Yes
Bin Nearby?
At Work?
No
VOL. 65, NO. 1, SPRING 2006
Bin Nearby?
Correct I don't recycle. I didn't think about it and I don't like storing it around home because it brings pests. I was too lazy. Sometimes I keep em' for my brother but . . . . I give them to him. . . . I just didn't this time. Incorrect I take them to a place where they take aluminum cans and gets money for em'. I did it to recycle . . . no reason just to recycle. It's easy to do and they pick em' up.
No
No
Correct It wasn't convenient I guess. There was no obvious place to put it for recycling. I don't knowCI didn't have a container to put it in. I was not homeCI was someplace in town. I was at someone's house. I was drivingCI threw it out the windowCit was a beer canCthe environmentCI'm down with it but there are too many rulesCI threw it out so I wouldn't get caught with it in my car. I wasn't at homeCat home I would've put it in the recycling bucket CIf it weren't illegal to put it in my car. . . . I'd've taken it home with meCmore people would recycle if it weren't for those open container laws. Incorrect Well I didn't know what to do with it. That's better on the environment. I take em' in and turns em' in for money. I think it's a good thingCwhy use new things when you can reuse old things.
111
We did this for the 33 North Dakotans in the ethnographic sample on which we had built the original model. When we built the original model, we asked our ethnographic informants why they had or had not recycled the last empty beverage can they’d had in their hands. The verbatim justifications for why people had recycled or not were stored in a separate database and were used neither as part of our model-building exercise nor during the telephone survey. We read through the responses of our 33 North Dakotan informants and used the decision rules of the model to classify each case. Table 4, then, is identical to Table 2, but turned on its side and filled with the verbatim responses of our North Dakota informants. It shows the degree to which individuals’ rationales correspond to the model’s internal logic. (To avoid bias in selecting the quotes, we used the data from all our North Dakota informants. This accounts for the unequal content of the cells in Table 4.) What is most striking about Table 4 is that the rationales in the different cells are quite distinct. The top right-most cell of the table represents rationales from people who reported that they were at home and recycled other things besides cans. In addition to one respondent mentioning that it was easy to do, three people mentioned that it was a good thing to do, and three others mentioned it was mandatory. Nowhere else in the rationales do the latter two themes arise. The next cell down shows the rationales from people who reported that they were at home but did not recycle other things. The model correctly predicted that the first three of the respondents would not recycle. Unlike those who had recycled, none of the three mentioned that it was important or good to recycle nor that it was mandatory. The three cases that were misclassified more closely resemble the rationales in the cell above. The rationales for those at work are clearly divided between those respondents who reported having a recycling bin conveniently located nearby and those who did not. Those who had a bin nearby reported its availability and the ease with which one could recycle. Those who didn’t have a bin spontaneously mentioned not being able to keep cans on the job or not having a recycling center. The last cell shows the rationales for those who were not at home or at work and who did not have a recycling bin nearby. Of the eight cases that the model predicted correctly, half spontaneously mentioned either the lack of convenience or the lack of a recycling bin. The other half mentioned explicitly where they were and clearly implied that place had something to do with their behavior. The two people who said that they threw the can out of the car identified a factor we hadn’t thought of before—that laws against drinking and driving might have an impact on environmentally friendly behaviors. Why do people recycle when the model predicts that they shouldn’t and don’t recycle when the model predicts that they should? Again, we turn to the verbatim comments of our informants. Those who recalled recycling a can despite not being at home or at work and not having a bin conveniently located were likely to justify their behavior by citing their beliefs in environmentalism or citing financial benefits for 112
doing it. This may be the result of positive attitudes about recycling—attitudes that give people the extra impetus they need for recycling when bins aren’t handy. This is worth testing, but note that at the margin, attitudes (or whatever else is at work) can account for no more than 10% of responses in the local sample (since the model predicts 90% of responses there) and no more than 15% of responses in the national sample (since the model predicts 85% of responses there). We do not have ethnographic data to account for those not at home who reported not recycling a can despite having a recycling bin handy. In fact, there are very few of these cases: 3 out of 76 in our national sample reported not recycling despite having a bin handy (see the right-hand path of Figure 4 and the 61+15 on the right-hand path of Figure 3), and none of the 33 ethnographic informants whom we interviewed for the data in Table 4 reported being in this category.
Discussion In this article, we expand the method of ethnographic decision modeling. We describe techniques for estimating sample size, show how the external validity of an EDM can be tested on a representative sample, and test the model’s internal validity with a systematic examination of informants’ rationales for their behavior. Each of these enhancements helps us better answer two questions: (1) What can the method tell us about modeling human decisions and the behavioral choices that people make when alternatives exist? (2) What can the method tell us about the recycling behavior of Americans?
Modeling the Decision-making Process Given that we are modeling aggregate rather than individual decision processes, what counts as “understanding the underlying cognitive process”? Researchers have used two approaches to understand cognitive processes. The first and most direct approach is to get people to verbalize their thoughts as they perform some behavior. For example, Murtaugh (1984, 1985) and Lave et al. (1984) asked shoppers to talk about their decision-making process as they shopped in a grocery store. The drawback to this thinkaloud approach (Edwards et al. 2005; Jobe et al. 1996) is that we don’t know whether and how the verbalization process affects the decision-making process. The second is to ask people after the fact to recall how they made their decision. However, as Boster (1984) warned, asking people about their choices after they have acted may only capture post-hoc justifications, which are likely to conform to socially acceptable and logical rules, rather than the actual decision-making criteria. Moreover, as Chibnik (1980) observed, people cannot always state rules for their behavior nor see correlations between their behaviors and other events. We combined the thinkaloud approach with a systematic checklist. First, people told us what they did and why they did it, and then we used the checklist to get yes/no answers to all the decision criteria we’d developed in the ethnographic interview. Note that while we built the model from checklist, HumaN OrganizatioN
our informants provided us with their justifications before we went through the checklist of decision criteria with them. This supports the conclusion that the model is getting at what people think about when they decide whether to recycle a can.
Using EDM to Increase Recycling
Chibnik, M. 1980 Working Out or Working In: The Choice between Wage Labor and Cash Cropping in Rural Belize. American Ethnologist 4:285–307. Drass, Kriss, and Charles C. Ragin 1992 Qualitative Comparative Analysis 3.0. Evanston, IL.: Institute for Policy Research, Northwestern University.
Does it make any difference if our models reflect accurately the decisions that people make? Or is it enough just to know what predicts the decisions? Much work remains to be done on this question, but the results of our study show clearly that just putting a lot of recycling bins around will increase recycling behavior. This has been known for some time, of course. However, the fact that we can validate a well-understood piece of information like this gives us greater confidence in the potential of the multi-step method we advance here, for answering questions to which the answer is not obvious. For example, the decision to use or not use (in the case of a man), or demand or not demand use of (in the case of a woman) a condom for vaginal or anal sex is a yes-no question of some importance. Like the decision to recycle a beverage can, the condom decision has been widely studied. And like the decision to recycle, we believe that there is much of application value to be learned about the contextual nature of the condom decision and the distribution of that decision nationally and internationally.
Edwards, Mildred, Sarah C. Thomsen, and Cathy Toroitich-Ruto 2005 Thinking Aloud to Create Better Condom Use Questions. Field Methods 17:283-199.
References
Gladwin, Christina H. 1989 Ethnographic Decision Tree Modeling. Newbury Park, CA: Sage.
Austin, John, David B. Hatfield, and Angelica C. Grindle 1993 Increasing Recycling in Office Environments: The Effects of Specific, Informative Cues. Journal of Applied Behavior Analysis 26:247-253. Barlett, Peggy F. 1977 The Structure of Decision Making in Paso. American Ethnologist 4:285-307. Bauer, Mark, and Anne L. Wright 1996 Integrating Qualitative and Quantitative Methods to Model Infant Feeding Behavior among Navajo Mothers. Human Organization 55:183-192. Beck, Kirk Andrew 2000 A Decision Making Model of Child Abuse Reporting. Ph.D. dissertation, University of British Columbia. Borgatti, Stephen 1992. ANTHROPAC 4.95/X. Analytic Technologies. URL:. Boster, James 1984 Inferring Decision Making from Preferences and Behavior: An Analysis of Aguaruna Jívaro Manioc Selection. Human Ecology 12:343-358. Breslin, F. Curtis, Christina H. Gladwin, Diane Borsoi, and John A. Cunningham 2000 De Facto Client-treatment Matching: How Clinicians Make Referrals to Outpatient Treatments for Substance Use. Evaluation and Program Planning 23:281-291.
VOL. 65, NO. 1, SPRING 2006
Garro, Linda 1998 On the Rationality of Decision-making Studies: Pt 2: Divergent Rationalities. Medical Anthropology Quarterly 12:341-355. Gatewood, John B. 1983 Deciding Where to Fish: The Skipper’s Dilemma in Southeast Alaska’s Salmon Seining. Coastal Zone Management Journal 10:347-367. Gladwin, Christina H. 1976 A View of the Plan Puebla: An Application of Hierarchical Decision Models. American Journal of Agricultural Economics 58:881-887. Gladwin, Christina H. 1980 A Theory of Real-life Choice: Applications to Agricultural Decisions. In: Agricultural Decision Making: Anthropological Contributions to Rural Development. P. Bartlett, ed. Pp. 45-85. New York: Academic Press.
Gladwin, Christina H., Hugh Gladwin, and Walter Gillis Peacock 2001 Modeling Hurricane Evacuation Decisions with Ethnographic Methods. International Journal of Mass Emergencies and Disasters 19:117-143. Gladwin, Hugh 1970 Decision Making in the Cape Coast (Fante) Fishing and Fish Marketing System. Ph.D. Dissertation, Stanford University. Gladwin, Hugh, and Michael Murtaugh 1984 Test of a Hierarchical Model of Auto Choice on Data from the National Transportation Survey. Human Organization 43:217-226. Hill, Carole E. 1998 Decision Modeling: Its Use in Medical Anthropology. In: Using Methods in the Field: A Practical Introduction and Casebook. V. C. de Munck and E. J. Sobo, eds. Pp. 137-159. Walnut Creek, CA: AltaMira Press. Jobe, Jared B., Donald M. Keller, and Albert F. Smith 1996 Cognitive Techniques in Interviewing Older People. In: Answering Questions: Methodology for Determining Cognitive and Communicative Processes in Survey Research. Norbert Schwarz and Symour Sudman, eds. San Francisco, CA, US: Jossey-Bass, 1996. pp. 197-219. Johnson, Jay, and Mark Williams 1993 A Preliminary Ethnographic Decision Tree Model of Injection Drug Users’ (IDUs) Needle Sharing. International Journal of the Addictions 28:997-1014.
113
Klecka, William R. 1980 Discriminant Analysis. Beverly Hills, CA: Sage. Larson, Michael E. Daniel Houlihan, and Phillip N. Goernert 1995 Effects of Informational Feedback on Aluminum Can Recycling. Behavioral Interventions 10:111-117. Lave, Jean, Michael Murtaugh, and Olivia de la Rocha 1984 The Dialectic of Arithmetic in Grocery Shopping. In Everyday Cognition: Its Development in Social Context. B. Rogoff and J. Lave, eds. Pp. 67-94. Cambridge, MA: Harvard University Press.
SYSTAT 11 2005 Systat Software Inc., 501 Canal Boulevard, Suite E. Richmond, CA 94804-2028. USA. URL:. Weller, Susan C., Trenton K. Ruebush, II, and Robert E. Klein. 1997 Predicting Treatment-seeking Behavior in Guatemala: A Comparison of the Health Services Research and Decisiontheoretic Approaches. Medical Anthropology Quarterly 11(2):224-245. Young, James C., and L. C. Garro 1994 Medical Choice in a Mexican Village. New Brunswick, NJ: Rutgers University Press.
Ludwig, Timothy D., Timothy W. Gray, and Allison Rowell 1998 Increasing Recycling in Academic Buildings: A Systematic Replication. Journal of Applied Behavior Analysis 31:683-686. Mathews, Holly F., and Carole Hill 1990 Applying Cognitive Decision Theory to the Study of Regional Patterns of Illness Treatment Choice. American Anthropologist 91:155-170. Mill, John Stuart 1874 A System of Logic, Ratiocinative and Inductive: Being a Connected View of the Principles of Evidence and the Methods of Scientific Investigation. 8th ed. New York: Harper. Mingers, J. 1989a An Empirical Comparison of Pruning Methods for Decision Tree Induction. Machine Learning 4: 227-243. 1989b An Empirical Comparison of Selection Measures for Decision-tree Induction. Machine Learning 3: 319-342. Montbriand, Muriel J. 1994 Decision Heuristics of Patients with Cancer: Alternative and Biomedical Choices. Ph.D. dissertation, University of Saskatchewan, Saskatoon.
Appendix—Questions Asked in Developing the EDM 1. 2. 3. 4. 5. 6. 7. 8. 9. 10. 11. 12. 13. 14. 15. 16.
Mukhopadhyay, Carol Chapnick 1984 Testing a Decision Process Model of the Sexual Division of Labor in the Family. Human Organization, 43:227-242.
17. 18.
Murtaugh, Michael 1984 A Model of Grocery Shopping Decision Process Based on Verbal Protocol Data. Human Organization 43:243-251.
19. 20. 21. 22.
Murtaugh, Michael 1985 The Practice of Arithmetic by American Grocery Shoppers. Anthropology and Education Quarterly 16:186-192.
23.
Plattner, Stuart 1984 Economic Decision Making of Marketplace Merchants: An Ethnographic Model. Human Organization 43:243-251.
25.
Quinn, Naomi 1978 Do Mfantse Fish Sellers Estimate Probabilities in their Heads? American Ethnologist 5:206-226.
27.
Ragin, Charles C. 1987 The Comparative Method: Moving beyond Qualitative and Quantitative Strategies. Berkeley: University of California Press.
29. 30.
Ryan, Gery W., and Homero Martínez 1996 Can We Predict what Mothers Do? Modeling Childhood Diarrhea in Rural Mexico. Human Organization 55:47-57.
31. 32. 33. 34.
114
24.
26.
28.
Think back to the last time you had a can of cola or something… when was that? What did you do with the can when you were done? Why did you / didn’t you recycle? Does your city have a recycling program? Can you return aluminum cans for redemption in your town or city? Did you live in a house or apartment? If you live in a house, is there a special pickup for recycled materials (e.g., big blue)? Are there special bins for recycled materials in your apartment building etc.? Are there recycling bins for cans where you work? [The last time you drank from an aluminum can were you:] at home? at work? driving in your car? inside or outside? at someone else’s house? The last time you drank from an aluminum can did you get the can from a vending machine? The last time you drank from an aluminum can was there a recycling bin conveniently located nearby? The last time you drank from an aluminum can were you busy? The last time you drank from an aluminum can were there other people around when you finished your drink? If so, do these people usually recycle cans? If so, did anyone suggest that you recycle the can? Do you have children? Do you habitually recycle material such as cans, newspapers, and plastics at home? Do you habitually recycle material such as cans, newspapers, and plastics at work? Do you consider yourself environmentally conscious (not at all, a little, some, a lot)? How much do you think that recycling helps to save the environment (not at all, a little, some, a lot)? How much are you concerned about the environment (not at all, a little, some, a lot)? How much do you think recycling helps to keep the environment clean (not at all, a little, some, a lot)? How important is it for you to preserve the environment for children (not at all, a little, some, a lot)? Do you think it’s wasteful to throw away an aluminum can? Do you think that there is a lot of social pressure nowadays to recycle? Do you think that cans are bad for landfills? Do you think that recycling aluminum cans is useful? Do you recycle any materials besides cans? If so, what other materials do you recycle?
HumaN OrganizatioN