Texture classification based on co-occurrence matrix and self-organizing map Carlos W.D. de Almeida Informatic Center (CIn) Federal University of Pernambuco Recife, Brazil Email:
[email protected]
Renata M.C.R. de Souza Informatic Center (CIn) Federal University of Pernambuco Recife, Brazil Email:
[email protected]
Abstract-This article presents a hybrid approach for texture based image classification using the gray-level co-occurrence matrices (GLCM) and self-organizing map (SOM) methods. The GLCM is a matrix of how often different combinations of pixel brightness values (grey levels) occur in an image. The GLCM matrices extracted from an image database are processed to create the training data set for a SOM neural network. The SOM model organizes and extracts prototypes from processed GLCM matrices. This paper proposes a novel strategy to index match scores by searching through prototypes. A benchmark data set is used to demonstrate the usefulness of the proposed methodology. The evaluation of performance is based on accuracy in the framework of a Monte Carlo experience. This approach is compared with several classifiers in Li et al
[1].
The experimental
results on the Brodatz texture image database demonstrate that the proposed method is encouraging with an average successful rate of 97%.
Index Terms-Image Processing, Self-Organizing Map, Image Classification, Texture.
I.
INTRODUCTION
Texture is an important feature of objects in an image [2]. The perception of texture is believed to play an important role in the human visual system for recognition and interpretation. There has been a great interest in the development of texture based pattern recognition methods in many different areas, especially in the areas of industrial automation, remote sensing and medical diagnosis [ 1]. Texture classification passes through the difficult step of tex ture representation or description. What is seen as a relatively easy task to the human observer, becomes a difficult challenge when the analysis is made by a computational algorithm. How can we copy the human brain in its capability to analyze, classify and recognize textures? Putting aside these questions about human brain workings, and focusing mainly on the necessity of how to describe a texture from its content, different approaches and models have been proposed [3]. Several authors have worked in finding descriptors and features for texture identification. Existing features and tech niques for modeling textures include Gabor transforms [4], bidirectional texture function [5], local binary patterns [6], affine adaption [7], wavelet-based features [8], textons [9], fractal dimension [ 10], and some invariant feature descriptors such as Zernike moments [ 1 1].
Ana Lucia B. Candeias Department of Cartographic Engineering Federal University of Pernambuco Recife, Brazil Email:
[email protected]
Among these, Haralick features are the most widely used. In his work, Haralick [ 12] suggested the use of gray-level co occurrence matrices (GLCM) to extract texture features from an image. Since then, GLCMs became widely used for image texture features extraction in many types of applications. The focus of the paper is to show the effectiveness of the hybrid approach in handling and classification from a texture database. The benchmark data set called Brodatz database [ 13] is considered, and the performance of this hybrid approach in terms of accuracy are assessed in the framework of a Monte Carlo experience. The rest of the paper is organized as follows. In Section 2, it is presented the components of the hybrid approach for texture-based image classification including the extraction of the GLCM descriptor [ 12] from an image database, the summarization and the extraction of prototypes from this data via a self-organizing map [ 14] [ 15], and a novel strategy to index match scores by searching through prototypes. In Section 3, the experimental results using the proposed approach are shown and the performance is discussed. Section 4 gives the concluding remarks. II. T HE
PRO POSED A P PROACH FOR TEXTURE CLASSIFICATION
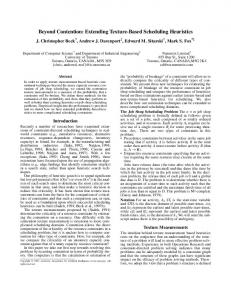
Four main modules are the building blocks of the proposed method: (i) Texture descriptor, (ii) Pre-Processing, (iii) Cluster ing, and (iv) Classification. Our approach has a learning stage where the texture descriptor module receives images from a database and applies the GLCM method. Gray level co-occurrence matrix (GLCM) [ 12] describes the relative frequencies with which two pixels separated by a distance d under a specified angle occur on the image. Then, the GLCM matrices are pre-processed in order to obtain input data for the clustering or classification modules. In the Clustering module the SOM neural network organises and extracts prototypes from the processed matrices, which ends the learning stage. The classification module receives a pre processed query image and compares it with the prototypes (representations of clusters) obtained in the clustering module. The final result is a list of images belonging to a few number of clusters considered to be the nearest to the user's query. Figure 1 shows these building blocks.
978-1-4244-6588-0/10/$25.00 ©2010 IEEE
2487
1 1
TeHture Descriptor
+ GLCM
2
3
b 56
79 93
28
2
59
12
20
27
3
47
25
18
98
4
38
34
18
69
b
10
49
12
69
- gray leuel
pre-Processing Module
ccurrence matriK
Retrieual List
Classification Module
"
�--�--
pre- P rocess i ng of liLCM
���.' --- .......
'.t;;. ". Query
=
Trai �age '� ,�·'t'"C Databases
DB of fher-Clustering .� . result for th e.Training ImagejDB'an d their �1».a.""""":'�);-4
. :�
P���typ�
Fig. I.
A.
Building blocks of the proposed approach
SHAPE DESCRIPTOR ALGORITHM SCHEMA
Texture descriptor module
This module has two main tasks. First it computes the GLCM for each image from a database. Then it processes each GLCM matrix in order to obtain either a vector of mean values which, in turn, will constitute the input data for the clustering module. The gray co-occurrence matrix (GLCM) [12] is a tradi tional statistical method for texture analysis. The co-occurrence matrixes characterize the relationship between the values of neighboring pixels. A Gray level co-occurrence matrix describes the relative frequencies with which two pixels separated by a distance d under a specified angle occur on the image, one with graytone and the other with graytone Such matrices of graytone spatial dependence frequencies depend on the angular relationship between neighboring pixels and on the other distance between them. The GLCM can be defined as:
Pd(i,j) j.
i
Pd,e(i,j) = Pr(I(PI) = i 1\ I(P2) = j 1\ IlpI - p211= d) P
PI
B. Pre-Processing module In this module, the GLCM matrix obtained in the descriptor module is used as input data for the SOM algorithm (in the Clustering module). The SOM algorithm, each node contains a vector of weights of the same dimension as the input vectors [14]. This module transforms each GLCM matrix (Gs) ( 256 x 256 ) in a 256-dimensional vector of quantitative features. This vector is obtained through a pre-processing tool. As processing tools for the GLCM matrix, the first PCA values, median and mean are considered. PRE-PROCESSING ALGORITHM SCHEMA 1. For each GLCM matrix (Gs) compute: the first principal component of the PCA or a vector of medians or a vector of means to define Xs (x ! ,... ,x�) , where is the grayscale intensity (255 gray valuers).
(1)
=
P2
where is the probability, and are positions in the gray scale image and e usually take the range of values:O°,45°,90°,135°. The algorithm schema of the Shape Descriptor module describes how the texture descriptor mod ule works.
I
=
1. For each image Imgs ( 8 I, . . . , S) Compute the gray level co-occurrence matrix (Gs) from image Imgs.
C.
P
Clustering module
The idea of this module is to group the input data coming from the pre-processing module using a self-organizing map
2488
(SOM) Model [ 14] [ 15]. SOM maps input data from high dimensional vector space to a two dimensional regular grid. Each node represents a localised subset of the input data space to a {! dimensional regular grid. Each node represents a localised subset of the input data and defines a cluster in the data set. The prior organisation of the node allows simple low dimensional representations. Consider n input data in IRP (here p 256) (Xl,... ,Xn) and M nodes which are numbered from 1 to M. Each node d is associated with a vector in IRP denoted by md and called the prototype of node d. The Clustering algorithm presents the batch-version of the standard SOM. This algorithm is an iterative one and therefore the values associated with the nodes evolve with each iteration. The neighbourhood function between the nodes a and b, h(a,b) measures the influence of node a and b. This influence decreases with the graph distance between nodes a and b during the iterations (t). A standard way to do this is to define a neighborhood function, often the Gaussian (see Equation 2), between nodes a and b.
Present the query image Imgq, compute GLCM matrix (Gq) (shape descriptor module) and X q (x�,... ,xg) (pre-processing module).
=
CLASSIFICATION ALGORITHM SCHEMA
=
=
ht(a,b) = exp
(
2 - ma - mb 2 ( 20- t)
li
11
)
(2)
CLUSTERING ALGORITHM SCHEMA Choose initial values for
MO = ( m� , ... , m� ).
1. 1 For each Xj determine c such that:
-
ct(j) = argdE{l,... ,M}min II Xj - m�
�
1.2 Update m (d
td =
m
= 1,... ,M)
l
II
(3)
using the rule:
'L7=l ht(ct(j),d) xj 'L7=l ht(ct(j),d)
(4)
1.3 Repeat the step 1. 1 and 1.2 for a specified number of unsupervised learning iterations.
=
1. 1 Compare Xj (x},... ,x�) with all the node vectors (md) (d 1,... ,M) of the SOM using the Euclidean distance. 1.2 Obtain an ordered list of all BMUs. 1.3 Determine the first BMUs in the SOM. 1.4 Extract the label associated with the selected BMU(s). 1.5 IF the label data are not available, determine the next BMU in the SOM and repeat the step 1.4. III.
EXPERIMENTAL RESULTS
This section presents experiments that evaluates the pro posed method and compares its performace with other methods in literature. In order to assess the performance of the proposed hybrid approach, experiments with the Brodatz database [ 13], were carried out. In the experiments, each Brodatz texture consti tutes a separate class. Each texture have 640 x 640 pixels, with 8 bits/pixel. The texture was partitioned in 32 x 32 subimages, taking 400 non-overlapping texture samples in each class. The samples were separated in two disjoint sets, one for training and the other for testing the classifier. This corpus is the same used by Li et al [ 1]. The thirty Brodatz textures used are shown in figure 2. The evaluation is based by the correct classification rate (CCR) (see Equation 5). These measurements are estimated in the framework of a Monte Carlo experience with 30 random partitions of the training and test sets. This approach is compared with several classifiers in Li et al [ 1].
CCR
=
Number of correctly classified samples Number of classified samples
x
100% (5)
Choosing a pre-processing technique for the GLCM matrix
D. Classification module
A.
This module receives a pre-processed image query and return to the user the classe considered to be the most similar to hislher query. After the training phase, it is possible to use the SOM to construct a classifier in which each neuron represents one class type. If labelled data are available, this information can be used to assign each neuron a label. The SOM is labelled based on votes between the labels according input data vectors and only uses the one which is most frequent. Finally, class label of each original data vector is the label of the corresponding Best Matching Units (BMUs) [ 14]. A BMU is the winning node of the SOM, that is, the prototype more similar to the query. The search procedure considers at least the first BMU. It is possible that more than one of the BMUs have to be considered in order to classify. Hereafter we refer to this whole approach that has been described so far in this section as GLCM+SOM.
A study to examine the performance of the proposed hybrid approach considering some different tools (see II-B for details) is carried out. As processing tools for the GLCM matrix a vector of first PCA values, a vector of median values and a vector of mean values are considered in this section. In this study, the grid size parameter of SOM was set to a 15 x 10 square grid. To perform a statistical analysis of relevance, a lO-fold cross-validation [ 16] in a Monte Carlo experience with 30 replications was carried out to estimate the CCR. Table I shows the average and the standard deviation for the CCR obtained by the GLCM+SOM method. We can conclude that for the Brodatz dataset [ 1] the processing tool based on mean vectors is the best option. Considering this result, the mean vector approach is adopted as processing tool of the GLCM+SOM method for the next experiments.
2489
Fig. 2.
Brodatz textures. From left to right and from top to bottom: 01,03,06, Oil, 016, Dl7,020,021,024,028,029,032,034,035,046,047,049,
051,052,053,055,056,057,065,078,082,084,085,0101,0104
100
TABLE I
CORRECT CLASSIFICATION RATE FOR GLCM+SOM METHOD
Processing tool
CCR (%)
First PCA
87,38
Standard deviation 0.000748
Median
30,56
0.000312
Mean
97.82
0.000924
95
� '-'
B. Experiments with the Brodatz dataset [1 J In this experiment, the effect of the training set size in the classifier accuracy was then assessed. A small fraction (from 1.25% to 10%) of the 400 subimages are used in training the classifiers, while the rest are used for testing. The training samples in each class was set to 1.25% (5 samples), 2.5% ( 10 samples), 3.75% ( 15 samples), 5% (20 samples), 6.25% (25 samples), 7.5% (30 samples), 8.75% (35 samples) and 10% (40 samples). For the proposed method, the grid size parameter of SOM was set respectively: 9 x 7, 11 x 8, 12 x 9, 13 x 9, 13 x 10, 14 x 11, 15 x 11 and 15 x 11. Figure 3 summarizes the results of the proposed method, along with the results [I] for the single and fused SVM classifier, the Bayes classifiers using Bayes distance and Mahalanobis distance, and the LVQ classifier. These measurements are estimated in the framework of a Monte Carlo experience with 30 random partitions of the training and test sets. I V.
90
85
80 GLCM+SOM Fused SVM __ Single SVM --e-LVQ Bayes distance --+-
---
75
70 � 5
+-__�__-+____
__ � __ �� __ __ �
10
15
20
25
30
35
40
Number of training samples per class
CONCLUSIONS
In this paper, an approach for texture-based image classifi cation using the gray-level co-occurrence matrices (GLCM) and self-organizing map (SOM) methods is presented. The GLCM was used in the texture descriptor module generating for each image a vector information. The SOM model was used in the clustering module to group similar image texture and to extract prototypes for each group. The classification module is based on the Euclidean distance to compare a query with the group prototypes extracted from the training data by the SOM model. A novel strategy to classification by searching through prototypes was used in the proposed classification module.
Fig. 3.
Texture classification CCR rates
To show the usefulness of the proposed methodology, an application with a benchmark data set was considered. The proposed approach is evaluated in terms of correct classifica tion rate in the framework of a Monte Carlo experience. The proposed approach is compared with several classifiers in Li et al [I]. Figure 3 show the the superiority of GLCM+SOM over the single and fused S VM, the Bayes classifiers using Bayes distance and Mahalanobis distance, and the LVQ classifier.
2490
ACKNOWLEDGMENT
The authors would like to thank CNPq and CAPES (Brazil ian Agencies) for their financial support. REFERENCES [1] S. Li, 1. T. Kwok, H. Zhu, and Y. Wang, " Texture classification using the support vector machines," Pattern Recognition, vol. 36, no. 12, pp. 2883-2893, 2003. [2] H.-Z. Wang, X.-H. He, and W. J. Zai, " Texture image retrieval using dual-tree complex wavelet transform," in Proc. International Conference
on Wavelet Analysis and Pattern Recognition ICWAPR '07, vol. 1, 2007, pp. 230--234. [3] C. A. Z. Barcelos,M. J. R. Ferreira, and M. L. Rodrigues, " Texture image retrieval: A feature-based correspondence method in fourier spectrum," in Third International Conference on Advances in Pattern Recognition, 2005, pp. 424-433. [4] A. K. Jain and F. Farrokhnia, " Unsupervised texture segmentation using gabor filters," Pattern Recognition, vol. 24, no. 12, pp. 1167-1186, 1991. [5] 1. Kautz,S. Boulos, and F. Durand, "Interactive editing and modeling of bidirectional texture functions," ACM Transactions on Graphics, vol. 26, no. 3, p. 53, 2007. [6] G. Zhao and M. Pietikainen, "Local binary pattern descriptors for dynamic texture recognition, " in ICPR '06: Proceedings of the 18th
International Conference on Pattern Recognition, 2006, pp. 211-214. [7] J. Zhang, M. Marsza, S. Lazebnik, and C. Schmid, "Local features and kernels for classification of texture and object categories: A comprehen sive study," International Journal of Computer Vision, vol. 73, no. 2, pp. 213-238, 2007. [8] D. Charalampidis and T. Kasparis, "Wavelet-based rotational invariant roughness features for texture classification and segmentation," IEEE
Trans. Image Process., vol. 11, pp. 825-837, 2002. [9] M. Varma and A. Zisserman, "A statistical approach to texture classifi cation from single images," International Journal of Computer Vision, vol. 62, no. 1-2, pp. 61-81, 2005. [10] M. Varma and R. Garg, "Locally invariant fractal features for statistical texture classification," in International Conference on Computer Vision, 2007, pp. 1-8. [11] A. Khotanzad and Y. H. Hong, "Invariant image recognition by zernike moments," IEEE Transactions on Pattern Analysis and Machine Intelli
gence, vol. 12, no. 5, pp. 489-497, 1990. [12] R. M. Haralick, K. Shanmugam, and I. Dinstein, " Textural features for image classification," IEEE Transactions on In Systems, Man and
Cybernetics, vol. 3, no. 6, pp. 61O...(i21, 1973. [13] P. Brodatz, Textures: A P hotographic Album for Artists and Designers. Dover Publications, 1966. [14] T. Kohonen, Self-Organizing Maps, 3rd ed.
Springer-Verlag, 2001.
[15] S. Haykin, Neural networks, A comprehensive Foundation.
Macmilan,
1994. [16] C.
Goutte, "Note
on
free
lunches
and
cross-validation,"
Neural
Computation, vol. 9, no. 6, pp. 1245-1249, 1997. [Online]. Available: citeseer.ist.psu.edulgoutte97note.html
2491