The Application of Remote Sensing and GIS Technology on Crops Productivity Proceedings of Workshop Beijing, 30-31 July, 2012
HE Yingbin, CHEN Youqi and YAO Yanmin
APEC Agricultural Technical Cooperation Working Group July, 2012
2
APEC Project No.: ATC 09/2011.“Workshop on the Application of Remote Sensing and GIS Technology on Crop Productivity among APEC Economies” Prepared By: Institute of Agricultural Resources & Regional Planning (IARRP) Chinese Academy of Agricultural Sciences (CAAS) 12 Zhongguancun South Avenue, Haidian District, Beijing, China Tel: (86)10-82109622-117
Fax: (86)10-82106225
Website:www.iarrp.cn Produced for Asia-Pacific Economic Cooperation Secretariat 35 Heng Mui Keng Terrace Singapore 119616 Tel:(65)6891-9600
Fax:(65)6891-9690
Email:
[email protected] Website:www.apec.org © 2010 APEC Secretariat APEC No: 212-AT-04.3
ISBN: 978-981-07-3888-4
4
EDITORIAL COMMITTEE EDITORS IN CHIEF: Dr. HE Yingbin Associate Professor, Institute of Agricultural Resources and Regional Planning (IARRP), Chinese Academy of Agricultural Sciences (CAAS), P. R. China Dr. CHEN Youqi Professor, Institute of Agricultural Resources and Regional Planning (IARRP), Chinese Academy of Agricultural Sciences (CAAS), P. R. China Dr. YAO Yanmin Associate Professor, Institute of Agricultural Resources and Regional Planning (IARRP), Chinese Academy of Agricultural Sciences (CAAS), P. R. China CONSULTANTS: Dr. TANG Huajun Vice president of Chinese Academy of Agricultural Sciences (CAAS), P. R. China Mr. LUO Ming Director General, International Cooperation Division, International Cooperation Department, Chinese Ministry of Agriculture, P. R. China Ms. WANG Weiqin Director, International Cooperation Division, International Cooperation Department, Chinese Ministry of Agriculture, P. R. China Mr. SHI Wei International Cooperation Department, Ministry of Foreign Affairs, P. R. China Dr. FENG Dongxin Deputy Director General, International Cooperation Department, Chinese Academy of Agricultural Sciences (CAAS), P. R. China Dr. JIN Ke Director, National Cooperation Division, International Cooperation Department, Chinese Academy of Agricultural Sciences (CAAS), P. R. China MEMBERS (Alphabetized): BAI Linyan
HE Yingbin
LI Zhibin
SI Haiqing
YU Shikai
CHEN Youqi
JIAO Weihua
LING Jian
WANG Deying
YU Xiaoqiong
CHENG Min
KONG Qingbo
LIU Weidong
WU Wenbin
ZHANG Mingwei
FENG Jianzhong
LI Dandan
LIU Wenjing
YAO Yanmin
ZHANG Wenbo
5
Preface Agricultural sustainability and food security are the top priorities in all the APEC economies, whether developed or developing. Remote sensing and GIS technology are gaining importance as useful tools in promoting agricultural management and development and ensuring food security. At present, remote sensing and GIS technology has played a significant role in crop classification, yield assessment and crop forecasting. In recent years, with APEC members’ rapid economic development and technology progress, academic circle has accumulated a lot of successful experiences and expertise on application of remote sensing and GIS on crops productivity, which needs a platform to communicate and share. In accordance with the 2010 and 2011 Leaders Declarations and the outputs of a series of ATCWG Annual Meeting, and based on actual above-mentioned needs, the “Workshop on the Application of Remote Sensing and GIS Technology on Crops Productivity among APEC Economies” was held in 30-31 July, 2012, in Beijing. The workshop aims at ensuring participants to share experiences, expertise and lessons on the issues related to the application of remote sensing and GIS technology on crops productivity (especially food crops or specific priority crops, rice and wheat) and food security. Moreover, organizers expected to strengthen capacity building of applying GIS and remote sensing technology to monitor crops acreage, predict crops production, and assess crops growth suitability and develop recommendations on food security strategies for APEC economies to promote the health and safety of populations. Therefore, this paper collection and the workshop should be particularly valuable in the context of APEC priorities. Participants were actively involved in workshop deliberations. Presentations, discussions and questions were closely concerned with crops acreage abstraction and crops cultivation structure analysis by remote sensing and GIS technology, monitoring on crops growth situation by remote sensing and GIS technology, prediction on crops production by remote sensing and GIS and technological extension and adaption among different APEC economies. After the meeting, delegates realized to share expertise and advanced technologies on the application of remote sensing and GIS technology on crops productivity among APEC member economies. Through the discussion, the distinguished APEC economies strengthened cooperation and exchange of various outputs and knowledge on the application of remote sensing and GIS technology on crops productivity. Moreover, the participating experts agreed to further linkage and mechanisms of exchange of information in related field and to establish a research network to promote sustainable agriculture development in APEC economies. As a part of the workshop achievements, this proceeding consists of 18 articles, of which some was not presented at the workshop but implemented by editorial committee. The publication of this proceeding is encouraged and financially supported by APEC Secretariat, APEC BMC, projects of the Ministry of Science and Technology of China (2010DFB10030) and the National Natural Science Foundation of China (41001049). I truly express my sincere appreciation to staffs working for this workshop and all the contributors who helped publish this proceedings. I hope that various people in the field would review this proceedings and that it will contribute to the progress of land use sciences. HE Yingbin Sep., 2012
6
CATALOGUE Status of the Application of Remote Sensing and GIS in Agricultural Monitoring in Australia…………………………….…..….1 Canadian Crop Yield Forecaster (CCYF)……………………………………………………………….……………………….….3 Supporting Agricultural Monitoring in APEC with FengYun Satellite Data….……………………………………………….…..10 Design of a Decision Support System for Suitability Regionalization of Conservation Tillage Based on GIS………….………..14 Temporal and Spatial Variability of Soil Nutrients in the county scale of Fujian……………………………………….………...19 Spatial Variability of Nutrient Properties in Soil of Jilin Middle Plain ...........................................................................................25 Yield Prediction for Winter Wheat in North China by Using IPCC-AR4 Model Data....................................................................32 An Overview of the Use of Remote Sensing and GIS for Paddy Crop Monitoring and Yield………………………………….…36 Agricultural Monitoring by Earth Observation Satellite ..................................................................................................................40 Monitoring of Paddy Rice Planting Using MODIS Data .................................................................................................................42 Use of Remote Sensing and GIS Applications in the Generation of Agricultural Statistics Construction of Sampling Frames… 52 Crop and Pest Modeling in a Climate Change Context....................................................................................................................55 Application of Remote Sensing and GIS Technology on Crops Productivity in the Philippines………………………………....57 Application of Remote Sensing and Geographic Information Systems on Crop Productivity in Papua New Guinea………….…67 Application of Remote Sensing and GIS Technology on Crops Productivity among APEC Economies………………………....71 Mapping the Rice Cropping Systems Using Time Series Satellite Data...........................................................................................78 Identifying Drivers of Land Use Change in China……………………………………….………………………………………...84 Rice Crop Monitoring using Multitemporal Data...........................................................................................................................106 Clour Graph.....................................................................................................................................................................................112
7
Status of the Application of Remote Sensing and GIS in Agricultural Monitoring in Australia Lucy Randall Australian Bureau of Agricultural and Resource Economics and Sciences (ABARES), Department of Agriculture, Fisheries and Forestry, Australia
[email protected] Earth observation, principally remote sensing, enables the development of methods for cost-efficient collection and use of agricultural and natural resources information, including mapping and monitoring changes in land use and land cover nationally. Australia has a range of established systems to collect and analyse information on agriculture, some using remote sensing and GIS. At a national level, agricultural monitoring includes: The agricultural census undertaken by the Australian Bureau of Statistics (ABS) every five years, with annual surveys of approximately 20 per cent of the farms in non-census years. ABARES’ farm surveys collect detailed financial information for around 2000 farms from the broadacre cropping, grazing and dairy industries.
from space allow monitoring of land surface and forest cover. In addition, satellite data on climate variables such as ocean temperature, precipitation and soil moisture provide invaluable information for assessing the impact of climate on agriculture, including drought monitoring (Climate R3 2011). Recent ABARES activities relevant to the application of remote sensing and GIS in agricultural monitoring have included: Attendance at the GEO Global Agricultural Monitoring (GEO GLAM) meeting on 22-23 September 2011 in Geneva. Hosting of an international workshop in Canberra on 13–14 February 2012 to discuss the technical feasibility of developing an integrated crop forecasting system, with representatives from the Asia-Pacific region, other agricultural organisations and academic institutions. At this workshop, experts in remote sensing, plant growth modelling and forecasting, and decision-support tools discussed remote sensing applications for agricultural monitoring and forecasting. Synthesising the outcomes of the integrated crop forecasting system workshop into a scoping paper (Nikolova et al. in prep). The paper presents the workshop discussions and recommendations on the feasibility of developing a national integrated crop forecasting system that will combine near real-time crop area estimates with near real-time yield predictions to produce more accurate production estimates. Participation in the Asia-Pacific Regional Space Agency Forum Regional Readiness Review for Key Climate-Related Earth Observation Satellite Missions (APRSAF Climate R3) Workshop on 24 May 2012 in Perth to discuss the opportunities for future application of space observations in agriculture.
modelled product which uses coarse-scale satellite data (pixel size of 1.1km2), ABS Agricultural Census commodity statistics (for agricultural land uses) and pre-existing, finer resolution catchment scale land use data as inputs. ABARES’ coordination of catchment scale land use mapping with Australian states and territories based on land tenure and other types of land use data, interpretation of high resolution imagery and field mapping. Geoscience Australia’S (GA) national land cover mapping using a classification of MODIS EVI data with time-series coefficients. GA and ABARES have jointly developed the Dynamic Land Cover dataset and a report discussing the methodology for development and potential applications (Lymburner et al. 2011). Ground cover mapped nationally using Landsat TM and MODIS NBAR data [CSIRO, GA and Joint Remote Sensing Research Program (JRSRP)]
REFERENCES
temperate and Mediterranean agricultural zones based on MODIS data. The Australian Climate and Agricultural weekly report which provides land managers and policy makers with soil moisture, temperature and rainfall and commodity information in a single report. Other environmental and climate observation systems with associated continuous data streams
[1]Climate R3 (2011) APSRAF Regional readiness - review for key climate-related Earth Observation Satellite missions. Pilot Phase Workshop report, 18–20 July 2011 Sydney.http://www.space.gov.au/CLIMATER3/Pages/Cl imateR3Workshop.aspx [2]Lymburner, L., Tan, P., Mueller, N., Thackway, R., Lewis, A., Thankappan, M., Randall, L., Islam, A., Senarath, U.
1
2011, The National Dynamic Land Cover Dataset, Geoscience Australia, Symonston http://www.ga.gov.au/ earth-observation/landcover. [3]Nikolova, S., Bruce, S., Randall, L., Barrett, G., Nicholson, M. (in preparation) Integrated Crop Forecasting – Outcomes from a workshop on the integration of remote sensing data and crop models, ABARES (Technical report), Canberra, TBC 2012.
[1]Australian Agricultural Census http://www.abs.gov.au/ agcensus2011 [2]ABARES’ farm surveys http://www.daff.gov.au/abares/ surveys [3]National land use mapping http://adl.brs.gov.au/ anrdl/ metadata_files/pa_luav4g9abl07811a00.xml [4]Catchment scale land use mapping http://adl.brs.gov.au/l anduse/index.cfm?fa=main.reporting [5]National Land cover mapping http://www.ga.gov.au/ earth-observation/landcover.html [6]Soil moisture www.eoc.csiro.au/awap/
FURTHER INFORMATION
2
Canadian Crop Yield Forecaster (CCYF) : a GIS and statistical integration of agro-climates and remote sensing information Aston Chipanshi, Yinsuo Zhang, Nathaniel Newlands, Harvey Hill, David Zamar The Science and Technology Branch of Agriculture and Agri -Food Canada
[email protected] partners include the Environmental Health group at the Lethbridge Research Centre (LRC), STB, AAFC, Agricultural Remote Sensing group at the Eastern Cereal and Oilseed Research Centre (ECORC), STB, AAFC, the Crop Condition Assessment Program (CCAP) at Statistics Canada (StatCan).
1 INTRODUCTION Impacted by the variability of climate and other environmental and economic factors, the yields of major Canadian crops vary considerably from year to year. For example, the standard deviation of the spring wheat yield in the 40 Census Agricultural Regions (CARs) of the Canadian Prairies ranged from 16-31% of its historical mean during 1976-2011 (Map 1). Early and accurate estimates of regional crop yield are much sought after information by producers, grain traders, and the agricultural industry as a whole to assist their decision making and risk management. Traditionally, regional or national crop yield estimated are made by field or farmer surveys conducted during or after the crop growing season (e.g.USDA, 1999; Statistics Canada, 2012b ). The survey method is resource and time consuming and reliable estimates are not normally available until long after the growing season. Recent research (e.g. Qian et al., 2009; Mkhabela et al., 2011; Bornn and Zidek, 2012) showed that estimations of crop yield in Canadian prairies are improved by the inclusion of agro-climatic indices or remote sensing Normalized Difference Vegetation Indices (NDVI) at certain periods of the growing season. Both agro-climatic and NDVI indices are readily available in near real time and relatively cost-effective, thus could be promising alternative crop yield predictors in supplement of the traditional survey method. The Canadian Crop Yield Forecaster (CCYF) is a geographic information system (GIS) and statistical based modelling tool for crop yield forecasting and risk analysis. It uses both observed agro-climatic and NDVI indices prior the date of forecast and the statistically generated values of these variables from the forecast date to the end of the growing season. The programming language used for the statistical modelling is an open source software R (R Development Core Team, 2008). Spatial data processing and map generating are achieved using ArcGIS 10.1 (ESRI, 2010). The ongoing development of CCYF has been led by the Agro-Climate, Geomatics and Earth Observations (ACGEO) Division, The Science and Technology Branch (STB) of Agriculture and Agri-Food Canada (AAFC). Collaborative
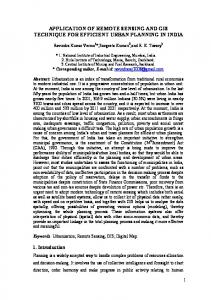
2 DATA AND METHODOLOGY 2.1 General model and data flow The spatial working units of the current CCYF yield forecast model are the Census Agricultural Regions (CARs) that delineated by the 2006 Census of Agricultural data collection and dissemination activities (Statistics Canada, 2007). The pilot study region described in this paper encompasses the 40 CARs covering the Canadian Prairies (Map 1) which are spread across the agricultural regions of Alberta (CAR IDs 48xx), Saskatchewan (47XX) and Manitoba (46XX). The crop used to evaluate the CCYF methodology is spring wheat. The general data and model flow processes are illustrated in Figure 1. Historical crop yield data from 1976-2011 for each of the 40 prairie CARs are obtained from the Field Crop Reporting Series of the Agriculture Division, Statistics Canada (Statistics Canada, 2012a). The original images of the Advanced Very High Resolution Radiometer (AVHRR, ~1km resolution) NDVI are obtained by the National Oceanographic and Atmospheric Administration (NOAA) series of satellites (http://noaasis.noaa. gov/NOAASIS/ml/avhrr.html) and the original images of MODerate-resolution Imaging Spectroradiometer (MODIS, 250m resolution) NDVI are obtained by the Terra and Aqua satellites of National Aeronautics and Space Administration ( http://modis.gsfc.nasa.gov/data). The processing of the weekly NDVI composites is detailed in Reichert and Caissy (2002) and in Bédard et al. (2006). A cropland mask from Land Cover for Agricultural Regions of Canada (circa 2000) developed at AAFC is used to extract the NDVI values at pixels of cropland and make averages at CAR level. The AVHRR NDVI data used in this study are available from 1987 to Julian week 26 (last week of June) of 2012.
3
Figure 1: Model and data flow of Canadian Crop Yield Forecaster
The station based daily temperature and precipitation data are provided by Environment Canada and other partner institutions through a Drought Watch program (http://www.agr.gc. ca/pfra/drought/index_e.htm) operated at the National Agroclimate Information Service (NAIS) of AAFC. The data have gone through a quality control process and a gap-filling process to construct a continuous daily series from 1987 to June 2012, to be in line with the available NDVI data series. In total, 259 climate stations were selected in the prairies to represent the climate of the 40 CARs (Map 2). Only climate stations distributed in the cropland and has less than 10% of missing data are selected. Plant Available Soil Water Holding Capacity (PAWHC) at the location of a climate station is determined from soil data obtained from the Canadian Soil Information System (http://sis.agr.gc.ca/cansis). The station based temperature, precipitation and PAWHC are fed into a crop specific soil water balance model- Versatile Soil Moisture Budget (VSMB, Baier et al., 2000) to generate the agro-climatic indices used for the yield forecasting model. The agro-climatic indices used in current model include Growing Degree Days above 5 ⁰C (GDD), precipitation (P), percent of PAWHC (%PAWHC) and a soil stress index (SI) defined as SI = 1 - AET/PET, where AET and PET are actual and potential evapotranspiration respectively. To represent the agro-climate of each CAR, average values of all the stations in the cropland of that CAR were calculated for all the agro-climatic indices. In certain CARs where there are very few stations selected or the stations are unevenly distributed
within the cropland (e.g. 4751, 4780, 4781, 4790 etc. See Map 2), stations from neighboring CARs may also be used. The daily agro-climatic indices are further aggregated into monthly means (or sums) and the weekly NDVI are aggregated into 3-week moving means to form the potential predictors for the crop yield. All model inputs include historical crop yield, NDVI and agro-climatic indices are then fed into a statistically based modelling frame work (Fig. 2) to generate the yield model for each CAR and make the forecasts using near-real time inputs. The outputs are further analyzed using ArcGIS (Version 10.1) to generate maps for the outlook reports. 2.2 Statistical processes As illustrated in Figure 2, to generate the yield forecasting models that are customized to each CAR, the historical series of crop yield, NDVI and Agro-climatic predictors are first put into a Robust Least Angle Regression Scheme (RLARS) (Efron et al., 2004; Koller and Stahel, 2011) to evaluate and rank the correlations between the yield and each of the potential predictors. Once the maximum allowed predictors (currently set at 5) are selected for each CAR, a robust based Leave-One-Out-Cross- Validation (LOOCV) scheme is then implemented to finalize the predictors and parameters of the yield forecasting models. Bornn and Zidek (2012) have showed that incorporating spatial correlation into crop yield models could considerably increase the individual model’s prediction power and stabilize the model performance. Therefore, we adopted 4
the Bayesian statistical scheme as described by Bornn and Zidek (2012) and use the historical data of the forecasting CAR and statistically selected neighboring CARs to establish the prior distribution of the predictors. The posterior distribution of the predictors is achieved using Markov Chain Monte Carlo (MCMC) scheme (Dowd, 2006; Martin and Quinn, 2007) fed by the prior distributions and the near real time data obtained at the time of forecasts. The predictors from the date of forecast to the end of growing season are established by a Multivariate Adaptive Regression Splines (MARS) using the posterior distribution obtained by MCMC. The near real time data and the generated data are then fed into the yield forecasting model of each CAR to forecast the probability of yield distribution. The final output includes forecasted yield medians and their percentiles, such as 10% percentile (Worst 10%), 50% percentile (median) and 90% percentile (Best 10%).
(3)Mean Absolute Percentage Error (MAPE)
3 EVALUATION RESULTS 3.1 Bravais and determination (R2)
The performance of a model can be evaluated by their goodness of fitting between the predicted yields to the observed yields during the model calibration period and during the independent test period. One limitation is availability of NDVI inputs, only 25 years of recorded yield data is used in model evaluation of this study, data from 1987 to 2008 were used to build the forecast models, to calibrate the model coefficients (α0, α1… αn), and to test the back-fitting performance, while data from 2009-2011 was used to conduct independent model tests. Various performance indicators were suggested by model evaluation studies (e.g. Krause et al., 2005; Rahbeh et al., 2011; Szulczewski et al., 2012). The following indicators are some of the most commonly used indicators and should be sufficient to evaluate forecast capacity of the established model for each CAR. Pearson
Coefficient
Coefficient
of
R2 values are only evaluated during the model calibration period due to the sample size restriction during the model testing period. Map 3 shows that 31 out of the 40 prairie CARs (77.5%) achieved a R2 of larger than 0.5, which means on 77.5% CARs, more than half of the yield variance could be explained by the selected predictors. Of the 9 remaining CARs (red in Map 3) that have R2 smaller than 0.5, one is located in the province of Alberta (48XX), three in Saskatchewan (47XX) and five in Manitoba (46XX). Uneven or sparse distribution of climate stations and/or cropland in those CARs (Map 2) might be one of the reasons that caused the bad performance of those yield models.
2.3 Model evaluation
(1)Bravais and determination (R2)
Pearson
3.2 Root Mean Square Error (RMSE) The RMSE calculated during model calibration period (Map 4a) are generally smaller than those during model testing period (Map 4b), indicating that some yield impact factors might be missed during the model selection process. In general, the model predict the spring wheat yield reasonably well, 75% of the CARs achieved the RMSE of less than 6 bushels/acre during the three model testing years. Regionally, the forecast errors are smaller in Alberta than those in the other two provinces, most likely due to their densely and evenly distributed climate stations inside the CARs. Yield models in CARs that experienced large increases in the RMSE values from model calibration period to model testing period (e.g. CAR 4870, 4721, 4606 and 4611) require further investigation.
of
3.3 Mean Absolute Percentage Error (MAPE) Similar to the trend of RMSE, the MAPE generally increased from the model calibration period (Map 5a) to the model testing period (Map 5b). The regional distribution pattern is also similar to the RMSE, i.e. forecasts in Alberta are better than those in Saskatchewan and Manitoba. During the three year model independent tests, the mean relative forecast error are within 10% in 17 CARs (42.5%), between 10-20% in 18 CARs (45%) and larger than 20% in 4 CARs (10%). The surveyed yields (observation) in all three testing years are missing in CAR 4604 which meant no error evaluation was done for this CAR.
Where O is observed yield and P is predicted yield, bar values are their means. R2 is the most frequently used model performance indicator. The range of R2 lies between 0 and 1, which describes how much of the observed dispersion is explained by the predictions. (2)Root Mean Square Error (RMSE) RMSE has the same unit as the yield and is a good measure of absolute error. 5
Figure 2: Statistical modelling frame work of the Canadian Crop Yield Forecaster
3.4 Model Effectiveness Index (MEI): MEI is basically defined as a comparison between the mean forecasted errors with its historical yield variation. As showed in Map 6, during the model calibration period (Map 6a), only one CAR (4610) has a mean forecast error larger than the standard deviation of its historical yield. However, the number of CARs that were disqualified from being considered as valuable yield model s(MEI >100%) increased to seven during the three year model testing period (Map 6b), one is located in north-western Alberta, three in central eastern Saskatchewan and three in eastern Manitoba. Almost all of those bad performed CARs have unevenly or sparsely distributed climate stations and/or cropland (Map 2).
all across the growing season (May to September). Some of those selected predictors may need further investigation to find out the mechanisms as how they are related to the yield of that CAR (e.g., GDD or precipitation in September). 3.6 Forecast time and the regional forecast errors As the CCYF frame work designed to deliver forecast during or shortly after the growing season, some of the predictors may not be available at early forecast date. In that case, a Markov Chain Monte Carlo (MCMC) scheme were used to generate a distribution of predictors based on the current year near real time data and prior distribution generated from historical data (Fig. 2). Figure 3 shows the evolution of forecasted percentile range and the comparison of the forecasted medians to the surveyed yield (observation) with the proceedings of the forecast dates. The temporal trend are very similar in all three provinces and the entire Prairies, the range of 10% and 90% percentiles reduced from June to August but remained fairly steady after August’s forecasts, indicating that the conditions before the end of July are the most important factors determines the regional spring wheat yield of the Prairies. Among the three provinces during the three testing years, Alberta achieved the most reliable regional yield forecasts while Manitoba largely overestimated the yield. The MAPEs of
3.5 Model predictors Model predictors are automatically selected by a statistical process as shown in Fig. 2. Based on the sample size for model calibration and some preliminary tests, a maximum of five predictors are allowed for each yield model, in addition to the technical trend in Eq. (1). Table 1 lists the top 10 predictors selected by the 40 models of Prairie CARs. The results showed that climate conditions in July and NDVI of Julian week 28 to 32 (Early July to Early August) are very critical for the spring wheat yield of many Prairie CARs. In addition to the predictors listed in table 1, some less frequently occurred predictors are distributed 6
Alberta forecasts made on or after August during the three tested years were all within 3%, and the MAPEs of Saskatchewan made on or after August were within 12%. The MAPEs of Manitoba made on or after August in 2009, 2010 and 2011 were 4%, 10% and 20% respectively.
The success in Alberta could partly attribute to the good representation of climate stations in their cropland while the failure in Manitoba of 2011 were most likely caused by the models’ failure to properly reflect an extensive flood that occurred in its main agricultural region.
Table 1: Top 10 yield predictors selected in the Prairie CARs Rank
Predictors
# Occurrence
1
SI of July
11
2
GDD of July
10
3
Precipitation of July
9
3
NDVI of Week 29-31
9
5
NDVI of Week 30-32
8
6
GDD of June
6
6
NDVI of Week 28-30
6
6
NDVI of Week 18-20
6
9
GDD of August
5
9
%_PAWHC of July
5
reference maps and figures, such as Maps 2 and 6b and figure 3 are also included in the report as appendices to help the user better understanding the forecasts and the expected confidence level.
4 EXPERIMENTAL FORECASTS AND FUTURE DEVELOPMENT 4.1 Delivery of the experimental forecasts
4.2 Future Development
Based on the above model evaluation results, the first operational prototype Prairie Spring Wheat yield outlook report was produced in June 2012. This experimental product has been updated monthly throughout the 2012 growing season with a release date normally a two to three week lag from the last day of the actual input data observed, i.e. a forecast released on the mid-July would use observed agro-climates and NDVI data until the end of June. Four deliveries are planned for 2012 from June to September. The report includes maps showing the forecasted median yield of the 40 Prairie CARs and their departure from the last five year’s median of the surveyed yields. The forecasted 10 and 90 percentiles (best 10% and worst 10%) and median values of total production for three provinces and total prairie are also reported using estimated seeding area from the field crop reporting series of Statistics Canada (2012b) released on June. Some 4.2.2 Expand the products to other crops and other regions
4.2.1 Improve the yield forecasting models on problematic CARs. As revealed in the model evaluation, some CARs (e.g. the CARs in red color in map. 3 and 6b) did not achieved satisfactory yield model, further investigation is required. Some potential measures to be explored include: (1) to improve the climate data representation in those CARs by bringing more stations from other sources or using gridded climate datasets, (2) to consult with crop experts to bring in physically based indicators, (3) to explore the yield predictability of other available earth observation data, e.g., Enhanced Vegetation Index (EVI) and surface soil moisture obtained from Soil Moisture Active/Passive satellites (SMAP) etc.
CARs are largely administrative rather than environmentally or ecologically based. It is recognized by many crop experts that the aggregation of information in CARs masked some of the correlations between crop yields and environmental based predictors. Efforts from both AAFC and Statistics Canada are being made to develop yield products in smaller and ecological boundary based spatial units. Once those products become available, it will be possible for us to develop yield models in refined spatial units.
Works are ongoing to build models and test their performances for other crops in addition to the spring wheat and other CARs outside the Canadian Prairie. 4.4.3 Refine the spatial resolution of the forecast units The Census Agricultural Region (CAR) is used as the forecast unit is due to the fact that the source of historic yield data is Statistics Canada which reports yields by this unit. The boundaries of 7
Figure 3: The evolution of the forecasted interquartile range and the departure of the forecasted median to the surveyed yield for the spring wheat of the three Prairie Provinces and for the entire Prairies during the three model testing years (2009-2011). [5] ESRI, 2010. ArcGIS Desktop: Release 10. Redlands, CA: ACKNOWLEDGEMENTS Environmental Systems Research Institute. URL: http://www.esri.com/ This study was supported by two AAFC funded [6] Friedman, J., 1991. Multivariate Adaptive Regression projects (1) Climate Adaptation for Resilience in Splines (with discussion) Annals of Statistics 19 (1), Agriculture (CARA) and (2) the Sustainable 1–141 Agriculture Environmental Systems (SAGES) [7] Hastie, T., Tibshirani, R., Friedman, J., 2009. The -Integrated Earth Observation Information on Elements of Statistical Learning: Data Mining, Inference, Crops and Soils for Agri-Environmental and Prediction (2nd Ed.), Springer, pp 219-259. Monitoring in Canada. Some of the data used in URL:http://www.stat.stanford.edu/~tibs/ElemStatLearn/, this study are provided by partners in Statistics [8] Koller, M. and Stahel, W. A., 2011. Sharpening Canada and Environment Canada. The authors Wald-type inference in robust regression for small would like to thank C. Champagne, P. Cherneski, samples, Computational Statistics & Data Analysis 55(8), B. Daneshfar, A. Davidson, X. Geng, E. Gorelov, 2504–2515. A. Howard, I. Jarvis, D. Qi, B. Qian, R. Rieger, L. [9] Krause, P., Boyle, D. P., Base, F., 2005. Comparison of Townley-Smith, D. Waldner and R.T. Warren different efficiency criteria for hydrological model From AAFC and F. Bedard and G. Reichert from assessment, Advances in Geosciences, 5, 89–97. Statistics Canada for their support and [10]Martin, A. D., Quinn, K.,M., 2007. MCMCpack: contributions. Markov chain Monte Carlo (MCMC) Package, R package version 0.8-1, URL: http://mcmcpack.wustl.edu. REFERENCES [11]Mkhabela, M. S., Bullock, Paul, Raj, S., Wang, S., Yang, Y, 2011. Crop yield forecasting on the Canadian Prairies [1]Bédard, F., Crump, S. , Gaudreau, J. , 2006. A comparison using MODIS NDVI data, 151, 385–393. between Terra MODIS and NOAA AVHRR NDVI [12]Qian, B., De Jong, R., Warren, R., Chipanshi, A., Hill, satellite image composites for the monitoring of natural H., 2009. Statistical spring wheat yield forecasting for grassland conditions in Alberta. Canada, Can. J. Remote the Canadian Prairie provinces. Agr. Forest Meteorol. Sensing, 32 (1), 44–50. 149, 1022–1031. [2] Bornn, L. and Zidek, J. V., 2012. Efficient stabilization [13]R Development Core Team, 2008. R: A language and of crop yield prediction in the Canadian Prairies, environment for statistical computing, R Foundation Agricultural and Forest Meteorology, 152, 223-232. for Statistical Computing, Vienna, Austria. ISBN [3] Dowd, M., 2006. A sequential Monte Carlo approach for 3-900051-07-0, URL http://www.R-project.org. marine ecological prediction. Environmetrics, 17: [14]Rahbeh, M., Chanasyk, D., Miller, J., 2011. Two-Way 435–455. calibration-validation of SWAT model for a small prairie [4] Efron, B., Hastie, T., Johnstone, I.., Tibshirani, R. 2004. watershed with short observed record, Canadian Water Least Angle Regression, Annals of Statistics , 32 (2), Resources Journal, 36(3): 247-270. 407–499. [15]Reichert, G.,C., Caissy, D., 2002. A Reliable Crop Condition Assessment Program (CCAP) Incorporating
8
NOAA AVHRR Data, a Geographical Information System, and the Internet. In, Statistics Canada. Ottawa,On. URL: http://www26.statcan.ca/ccap-peec/esri 2002conf-eng.jsp [16]Statistics Canada, 2007. Census Agricultural Regions Boundary Files for the 2006 Census of Agriculture Reference Guide. URL:http://www.statcan.gc.ca/bsolc/ olc-cel/olc-cel?lang=eng&catno=92-174-G. [17]Statistics Canada, 2012a. 1976-2011 Crops Small Area Data, Field Crop Reporting Series of Agriculture Division, Statistics Canada. [18]Statistics Canada, 2012b. Definitions, data sources and methods of Field Crop Reporting Series, Record number:
3401, Agriculture Division, Statistics Canada. URL:http:// www.statcan.gc.ca/imdb-bmdi/3401-eng.htm [19]Szulczewski, W., Zyromski, A., Biniak-Pieróg, M., 2012. New approach in modeling spring wheat yielding based on dry periods, Agricultural Water Management, 103, 105– 113 [20]USDA, 1999. Understanding USDA Crop Forecasts, National Agricultural Statistics Service and Office of the Chief Economist, World Agricultural Outlook Board, United States Department of Agriculture, Miscellaneous Publication No. 1554. URL:http://www.nass.usda.gov/ Education_and_Outreach/Understanding_Statistics/pub1 554.pdf
9
Supporting Agricultural Monitoring in APEC with FengYun Satellite Data Jinlong Fan1 and Mingwei Zhang1 National Satellite Meteorological Center, China Meteorological Administration, Beijing 100081
[email protected] boomingly age for Earth observations. In recent years, a great progress has been made in space based Earth Observations system in China. Chinese satellites series, for instance ‘FengYun’ meteorological satellite series, has developed and is developing. With 40-year development, the Chinese Meteorological Satellite system is becoming a significant component of the Global Earth Observation System of Systems. The National Satellite Meteorological Center (NSMC) of China Meteorological Administration (CMA) is in charge of the development of the Chinese Meteorological Satellite which is also called FengYun satellite in Chinese. The Chinese Meteorological Satellite system has put in place two series, polar-orbiting satellite and geostationary satellite. However, CMA also has paid great attentions to the satellite data distribution and applications in home and abroad. NSMC has developed a web based data distribution system through which users may get access to the satellite data that NSMC receives. CMA also developed a communication satellite based data distribution system, CMACast, to improve the data access. CMA has donated the CMACast user stations to the international users in 2006, 2007 and 2011, in order to facilities the users in Asia and Pacific to receive the satellite data. Since 2008, FY-3A and Fy-3B have been successfully launched respectively. Two sensors onboard FY-3A and FY-3B, VIRR and MERSI are very important for the agricultural monitoring and with the similar observing capabilities as NOAA/AVHRR and EOS/MODIS or ENVISAT/MERIS. With those facilities in place, it sees that FengYun Satellite data may strongly support Agricultural Monitoring in APEC in the near future. This paper introduces the Chinese Meteorological Satellite program, the FengYun satellite data distribution, and the potential supports to the agriculture monitoring in APEC.
Abstract—With 40-year development, the Chinese Meteorological Satellite system has made great progress and is becoming a significant component of the Global Earth Observation System of Systems. The National Satellite Meteorological Center (NSMC) of China Meteorological Administration (CMA) is in charge of the development of the Chinese Meteorological Satellite which is also called FengYun satellite in Chinese. The Chinese Meteorological Satellite system has put in place two series, polar-orbiting satellite and geostationary satellite. Since 2008, FY-3A and Fy-3B have been successfully launched respectively. Two sensors onboard FY-3A and FY-3B, VIRR and MERSI are very important for the agricultural monitoring and with the similar observing capabilities as NOAA/AVHRR and EOS/MODIS or ENVISAT/MERIS. NSMC has developed a web based data distribution system through which users may get access to the satellite data that NSMC receives. CMA also developed a communication satellite based data distribution system, CMACast, upgraded from the FENGYUNCast that NSMC developed in 2005, to distribute larger volume satellite data to the end users in near and real time. CMACast has joined the GEONETCast as a regional hub in Asia and Pacific area. CMA has donated the CMACast user stations to the international users in 2006, 2007 and 2011, in order to facilities the users in Asia and Pacific to receive the satellite data. New donation plans to users in other communities, such ESCAP space community and APEC Agricultural monitoring community, are being initiated. It hopes that these donations may help more alien users in Asia and Pacific easily get access to Chinese satellite and other satellite data. In terms of the agricultural monitoring, some similar satellite products that NSMC is operationally producing may be transferred to the agricultural monitoring community in APEC. Those products are vegetation growth monitoring, vegetation drought monitoring and land surface temperature monitoring. It hopes that users in Asia and Pacific area may benefit from the utilization of the Chinese Fengyun Satellite data to monitoring their own agriculture. Keywords— Fengyun Satellite; Agricultural Monitoring; APEC, GEONETCast; CMACast
1. CHINESE METEOROLOGICAL SATELLITES PROGRAM In 1971, The National Satellite Meteorological Center (NSMC) was founded to carry out the Chinese Meteorological Satellite Program. At present, NSMC is one of key operational centers in the China Meteorological Administration (CMA). The NSMC’S mission is to plan, develop and operating the Chinese meteorological
The 21st century is a new era when it is a global 10
satellite system and to promote the satellite application in the relevant areas. After 40-year development, the NSMC composes of one operational center and four ground stations in China. With the needs of receiving global data, NSMC has negotiated with Swedish Space Company and reached an agreement of renting the facility in Kiruna ground station to receive and send FY3 satellite data back to NSMC. At the early 1970s, China began to independently develop its meteorological satellite. Two major series, the polar-orbiting and the geostationary meteorological satellite systems, were planed, designed and developed in the past 40 years. The first polar orbiting experimental meteorological satellite (FY-1A) was successfully launched in late 1980s. In recent years, aiming at meeting the increasing demands of economy and society, China has launched its second generation polar orbiting meteorological satellites, FY-3A and FY-3B in 2008 and 2010, respectively. FY-3A and FY-3B both carry 11 payloads of which VIRR, the short name for Visible Infrared Scanning Radiometer, and MERSI, the short name for Medium Resolution Spectral Imager, are both key valuable sensors for the agriculture monitoring. VIRR data are 1.1 km resolution of 10 channels while MERSI data are 250 meter resolution of 5 channels and 1 km of 15 channels. The FengYun satellites are becoming more and more important in protecting lives and property of people from natural disasters. The Chinese Meteorological Satellite was named as FengYun or FY in acronym, which means wind and cloud in English. The odd number series is the polar-orbiting satellite series, the even number series the geostationary. FY-1 series is the first generation of FengYun polar-orbiting meteorological satellites. The FY-1 polar-orbiting, sun-synchronous meteorological satellite program has been implemented since 1988. 4 satellites, FY-1A/B/C/D were launched to provide visible and infrared radiometry measurement for the application. Satellite products include the vegetation index (NDVI), sea surface temperature (SST), atmospheric optical thickness and so on. FY-1D is the last model of the FY-1 series and was operationally active as of April 2012. FY-2 series is the first generation of FengYun geostationary meteorological satellites. The FY-2 geostationary satellite program has produced 6 satellites, FY-2A/B/C/D/E/F since 1998. FY-2D at 86.5 E and FY-2E at 105E constitute a dual satellite constellation for operational observation. FY-2F was newly launched in Jan. 13 2012. FY-2 satellites carry the Visible and Infrared Spin Scan Radiometer with 5 spectral observational channels. FY-3 series is the second generation of FengYun polar-orbiting meteorological satellites. The FY-3 is a new polar-orbiting, sun-synchronous
meteorological satellite series planned to cover the duration of 2008-2021. The first model FY-3A was launched in May 2008. The second model FY-3B was launched in Nov. 2010. Compared with the visible and infrared imagery of FY-1 satellite, the FY-3 satellite carries 11 sensors which largely enhance the monitoring capability. FY-4 series is the second generation of FengYun geostationary meteorological satellites. The FY-4 is a new geostationary meteorological satellite series plans to cover the duration of 2016-2020. Compared with FY-2 satellites, FY-4 is capable of infrared hyper-spectral resolution atmospheric vertical sounding of temperature, humidity, and greenhouse gases. The spatial resolution of imagery is improved to 100 meters. Since early 1980s, the polar orbiting and geostationary meteorological satellite data have been applied widely to many fields like weather forecasting, climate prediction, natural disaster monitoring, crop production estimation, environmental monitoring and space weather, etc. Fig. 1 shows the global observing capability of FY-1C. FY-1D, FY-3A and FY-3B all have this capability. 2. FENGYUN METEOROLOGICAL SATELLITE DATA SERVICES Since the early 1980s, National Satellite Meteorological Center (NSMC) has been receiving, processing and archiving data from alien meteorological satellites and Chinese Meteorological satellites. So far, NSMC has become one of the largest satellite data centers in China, even in the world. In order to easily provide the huge volume archived and received satellite data, a web based satellite data service was developed under the support of the FengYun Meteorological Satellite Ground Application System Project. Since 2005, the domestic and foreign users have been able to access to the FengYun Satellite data at http://satellite.cma.gov.cn. Fig.2 shows the portal of the FengYun satellite data services. The portal provides the users with real-time and historical satellite data that were acquired and are acquiring from the FY-1D, FY-3A, FY-3B, FY-2D, FY-2E, NOAA-15, NOAA-16, NOAA-17, NOAA-18, EOS/TERRA, EOS/AQUA, MTSAT-2, MSG-1 and so on. In order to meet the special users’ needs, the communication satellite based data dissemination service is also available, which complements to the web based data distribution service. FENGYUNCast was developed in 2005 in NSMC to disseminate satellite data that NSMC receives. And later on FENGYUNCast joined the GEONETCast as a regional hub for the Asia and Pacific area. GEONETCast is a low cost global environmental information delivery system which transmits the 11
satellite-based, airborne-based and in situ data, products and services from the Global Earth Observation System of Systems (GEOSS) to various users through communication satellites using multi-cast, broadband capability. GEONETCast provides reliable, worldwide and continuous access to information and is a core infrastructure and early success of the Group on Earth Observations (GEO)’s the Global Earth Observation System of Systems (GEOSS). GEONETCast is coordinated within the framework of the GEO by the GEONETCast Implementation Group comprising the China Meteorological Administration (CMA), European Organisation for the Exploitation of Meteorological Satellites (EUMETSAT), the National Oceanic and Atmospheric Administration (NOAA) and the World Meteorological Organization (WMO). Data from each region can be disseminated outside the original region through data-exchange links between regions, such as through dedicated lines, overlapping satellite footprints, or use of the Internet or other existing networks. The data GEONETCast delivers are specifically targeted to address nine society benefit areas such as natural and human-induced hazards, environment and health, environmental-related energy issues, climate change, water management, weather, ecosystem management, sustainable agriculture, and desertification and biodiversity, with the aim at reaching a global coverage and allowing the timely reception of the data at very low cost by nearly anyone on the planet. The CMACast is upgraded from FENGYUNCast and enhanced by CMA in the support of the meteorological operation. CMACast is a newly established DVB-S2 standard satellite data broadcast system. It is maintained by the National Meteorological Information Center of CMA and works as a major component of CMA’s national meteorological data dissemination system. More than 2400 subordinated agencies and local offices of CMA use this system to receive real time observation data and products. It is also the most effective way for common user communities in China to obtain different kinds of meteorological data and products from CMA. CMACast has achieved the ability to offer all services within the framework of GEONETCast and may provide much better services to users in Asia Pacific Region. Fig.3 shows the footprint of CMACast, within which user may use the service that CMACast provides. In order to share data of FengYun meteorological satellite series with countries in the Asia-Pacific region, China has donated a number of user receiving equipments to users in the Asia-Pacific region. The China Meteorological Administration, on behalf of the Chinese government, ever donated six sets of FENGYUNCast user receiving stations to
Bangladesh, Indonesia, Iran, Mongolia, Pakistan and Thailand in 2006 in the framework of the Asia Pacific Space Cooperation Organization. In October 2007, another 11 sets of FENGYUNCast user receiving stations were donated to DPRK, Kyrghyz, Lao P.D.R, Malaysia, Myanmar, Nepal, Philippines, Sri Lanka, Tajikistan, Uzbekistan and Viet Nam in the Framework of Group on Earth Observations. Fig. 4 shows the donation of CMACast user stations in 2007. China Meteorological Administration (CMA) donated CMACast and Meteorological Information Comprehensive Analysis and Process System (MICAPS) to the Asian developing countries at the 40th China Study Tour and Regional WIS Training Seminar opened on 11 April 2011 in Beijing in the framework of WMO. These countries are Thailand, Indonesia, Pakistan, Bangladesh, Philippines, Tajikistan, Sri Lanka, Mongolia, Viet Nam, Malaysia, Kyrgyz, Nepal, Myanmar, Maldives, Lao P.D.R and Uzbekistan. At present, there are 27 user stations in 19 counties in the Asia-Pacific region that are able to receive Earth observation data through the CMACast. 3. POTENTIAL SUPPORTS TO THE AGRICULTURAL MONITORING IN APEC FengYun satellites are designed for the weather forecast but they have been used in many other fields. Agricultural monitoring is one of key application areas. FY-3A and FY-3B were launched in 2008 and 2010, respectively. FY-3A and FY-3B both carry 11 payloads of which VIRR and MERSI are both key valuable sensors for the agriculture monitoring. They have the similar observing capabilities as the NOAA/AVHRR and EOS/MODIS or ENVISAT/MERIS. NSMC is operationally providing the vegetation growth monitoring, the vegetation drought monitoring and the land surface temperature monitoring in China. With the increasing needs of agricultural monitoring in APEC, these applications may be transferred to the APEC area. Of course, the users may be able to use FengYun satellite data to develop their motheds for the agricultural montiroing. It hopes that users in Asia and Pacific area may benefit from the utilization of the Chinese Fengyun Satellite data to monitoring their own agriculture. Fig.5 showcases the vegetation monitoring, drought monitoring and land surface temperature monitoring with FengYun polar-orbiting and geostationary satellite data. The upper left picture is the vegetation growth monitoring. The upper right picture is the drought monitoring. The lower left picture is the land surface monitoring with FY Geostationary satellite data. The lower right picture is the number of days with higher temperature.
12
ENVISAT/MERIS.
4. CONCLUSIONS AND RECOMMENDATIONS
ACKNOWLEDGEMENTS
The Chinese Meteorological Satellite system is becoming a significant component of the Global Earth Observation System of Systems. The Chinese Meteorological Satellite system has put in place two satellite series, polar-orbiting satellite and geostationary satellite. The users, including domestic and international, may get access to the Chinese meteorological satellite data through NSMC’s satellite data services website. The users also may get access to satellite data through CMACast but users are needed to equip the CMACast user station that is inexpensive, small and easily manage. APEC agriculture monitoring community should be equipped with the CMACast user station to facilitate timely access to the satellite data for the operational agriculture monitoring. APEC trust fund and other stakeholders should take this requirement into consideration. The vegetation growth monitoring, vegetation drought monitoring and land surface temperature monitoring that are being done in NSMC showcase the potential supports to the agriculture monitoring in APEC. Two sensors onboard FY-3A and FY-3B, VIRR and MERSI are very important for the agricultural monitoring with the similar observing capabilities as the NOAA/AVHRR and EOS/MODIS or
The research is funded jointly by the National High Technology program with the grant of 2012AA12A307 and the International Scientific Cooperation program with the grant of 2012DFG21710. 5. REFERENCES [1]Dong,C. H., Yang,J., Lu,N. M., Yang,Z. D., Shi,J. M., Zhang,P., Liu,Y. J., Cai,B., 2010. Main characteristics and primary applications of Polar-orbiting satellite FY-3A[J].Journal of Geo-information Science, 12(4): 458-465 (in Chinese) [2]Fan,J. L., 2012. Progrss of the global environmental information dissemination services-GEONETCast[J]. Advances in Earth Science, 27(7):712-716(in Chinese) [3]Fan,T. X., FY-1, 1991. Meteorological satellite ground system[J]. Chinese Space Sci Tech, 2:34-48 (in Chinese) [4]Qian,J. M., Sun,A. L., Xu,Z., 2012. Fengyun series meteorological satellite data archiving and service system[J].Journal of applied meteorological science, 23(3) : 369-376(in Chinese) [5]Yang,J., Dong,C. H., Lu,N. M., Yang,Z. D., Shi,J. M., Zhang,P., Liu,Y. J., Cai, B., 2009. FY-3A: the new generation polar-orbiting meteorological satellite of China[J].Acta Meteorological Sinica, 67(4):501-509(in Chinese).
13
Design of a Decision Support System for Suitability Regionalization of Conservation Tillage Based on GIS Jiao Weihua1, He Yingbin2 1. China Agriculture University; 2. Institute of Agricultural Resources and Regional Planning, CAAS
[email protected] Abstract — Conservation tillage cannot be applied on a large scale on account of the variety of the region and the technology type in China. In order to overcome this problem, a decision support system for suitability regionalization of no-tillage, which belongs to conservation tillage, based on GIS was developed in this paper. On the basis of AHP and cluster analysis, we firstly built the suitability regionalization index of no-tillage, then calculated the weight of each index, and lastly developed the decision support system for suitability regionalization of no-tillage. In this paper, both the methodology on suitability regionalization and the decision support system have some reference for spreading no-tillage in the northern part of Yinshan mountain. Keywords — Conservation tillage; No-tillage; Suitability regionalization; GIS; Decision support system
In this paper, based on the analysis of intrinsically link between the conservation tillage (no-tillage for example), natural environment and socio-economic environment, the study of spatial distribution characteristics of the area of no-tillage technology, and the collecting expert opinions, the application of GIS technology has developed the Technical suitability zoning decision support system. The system can provide divisions of the suitability of different parts’ no-tillage technology with the indicators provided by users. The aim is that to provide scientific methods and decision support for reasonable promotion of no-tillage in everywhere. 2 SYSTEM DESIGN 1.1 Design Target Firstly, we build the suitability regionalization of no-tillage index system on the basic of AHP, then we use the index from users to analyse and evaluate the suitability of the selected area by way of GIS technology, aiming at separating the different suitability regionalization of no-tillage technology from each other and reasonably extend the no-tillage using scientific method and decision support system.
1 INTRODUCTION Currently, conservation tillage has become an important technical means to prevent soil erosions and reduce land desertification(Uri et al, 1998; Gao et al,2003). It also is one of the important supports for sustainable development of international agriculture technology. However, this kind of technology has lots of types and be scattered, with a little normative. This limits the conservation tillage’s promotion and application. So it is very urgent to based on different regions’ natural, social and economic conditions to research the space adaptive and layout of different technologies( Jiao et al, 2010). GIS has unique advantages in the application of the zoning areas. It can combine the existing resources and economic database, the analysis bases on the physical and chemical properties, climatic factors, cultural, economic and many other factors of the minimum system unit, in the end it makes out a variety of regionalization(de Paz ea al, 2006).
1.2 function module design The system include five functional modules (as shown in Fig.1):(1) Knowledge View, introducing the technologies and effects of the conservation tillage. (2) Regionalization Results Query, the nucleus module that receiving the input index from users and dividing the different suitability regionalization. (4) User Login. (5) System Management, won’t go into detail because of it is similar with the routine information system.
14
Fig.1 Function module structure of the system
1.3 structure of index
clustering and Discriminant clustering. In this paper, shortest distance method is employed. Take the two point groups S and T for example, the shortest distance between S and T is used as the distance of them, And the shortest distance is defined as the criteria of judgment on types, presented as dst = min (dij, Pi∈S, Pj∈T). SPSS(Statistical Package for the Social Science), which has a function of cluster analysis for the grid value in the preprocessing layers of planed regionalization regions , is embedded into the system. After obtaining the grid layers and weight which are all one-to-one correspondence with the indices, the system will have a overlying or weighting operation on all the quantified index layers, and will build a preprocessing layer of planed regionalization regions. Due to too much grid values, this system will divided the samples into 50 sample intervals and cluster them into 3 with the Cluster Analysis. The 3 clusters are suitability regions of no-tillage, subaltern suitability regions of no-tillage and unsuitability regions of no-tillage and they will be drew in a regionalization figure in the system .
This article build the index system on the basis of the following principles:(1) Relative Consistency principle. (2) Comprehensive principle and Dominant factor principle. (3) Reginal Conjugatio principle. (4)Combination of qualitative and quantitative analysis principle. (5) integrity of the principle of administrative divisions(Chen et al,2002; Chen et al,2006).We screen and classify the suitability regionalization of no-tillage index into two kinds ,18 different index on the basis of experts’ advice and refer to the above regionalization principle, as is shown on table 1. The D1—D7 are indirect pointer which is calculated from the original data. This system is a decision support system for the related agriculture department, and the users are assumed to have the ability to acquire the relevant data and calculate the system index. D8—D18 are direct index which can be obtained directly. This system regards both indirect index and direct index at as the input parameters. 1.4 confirmation the weight of index
2 SYSTEM IMPLEMENTATION
There are many indexes in the division process of regionalization, but the regionalization of each index to evaluate the role of the object is not equally important. We must assign different weight coefficients to different index after the determination of index system, so as to reflect the different role and importance in the system of evaluation. The value of the index weight directly affects the result of regionalization, the variation of the weight will likely lead to the different quality of regionalization. This system calculates weight of index using the method of Analytical Hierarchy Process. The result is shown in Tab.1.
This decision support system utilizes GIS and Internet synthetically. Arcgis is selected to be the developmental tool and SQL Server2000 is selected to be the data base (Wang et al, 2008; Zhao et al, 2006). The interface for user login is shown in Fig.2. Suitability regionalization could be started after logging in (as shown in Fig.3). Take the selection of soil indicator as the example, each index weight could be calculated in the index calculate interface(Fig.4) Eventually, the result of division shows up, as is shown in Fig.5.
1.5 Cluster Analysis
3 CONCLUSIONS
In the field of environmental science, many different algorithmic Processes have been applied for Cluster Analysis, for example, System Clustering, Gradual decomposition
Conservation tillage cannot be applied on a large scale at the present stage in China. In order to solve this problem, a decision support system for suitability regionalization of no-tillage was 15
designed. Based on AHP and cluster analysis, the suitability regionalization index of no-tillage is firstly build and then the index weight is calculated. And the decision support system was finally established with the help of functions of
GIS in image display and cluster. It is considered that the decision support system is conductive to the spread of no-tillage in the northern part of Yinshan mountain.
Table 1 Index system for no-tillage zoning in the Wuchuan County Overall Layer A
System Layer B
Index Layer C
Variable Layer D D1soil organic matter D2soil nitrogen
C1Soil Index
D3 soil total phosphorus D4soil clay content D5soil relative humidity
B1Natural System
D6slope C2Topography Index D7exposure D8area of cultivated land per capita C3Land Use Status Index
D9 area of grassland area per sleep
Index System D10woodland area proportion for no-tillage zoning D11agricultural machinery total C4Level of Mechanization Index
power D12sowed area ratio D13 acceptance level of no-tillage
B2Social
Economy
C5Peasant Household Index
System
D14agricultural workers proportion D15farmland output-input ratio D16number of livestock D17per capita gross output value of
C6Economics Index
agriculture D18per capita income
Figure 2. user login interface
16
Figure 3. index select interface
Figure 4. index calculate interface
Figure 5.final suitability regionalization
ACKNOWLEDGEMENTS
[1]Chen, Z., Ma, S., 2006. Influential factors and control strategies of farming soil wind erosion in the corss region between farm land and grass land in Yinshan Mountain area[J]. Journal of Anhui Agricultural University, 33(1):130-133. [2]Chen, Z., Wei, E. Shi, S., 2002. Strategies for rejuvenation of degenerated natural grassland within northern agro-grazing ecotone of yinshan mountains, Inner Mongolia[J].Research of Soil and Water Conservation, 3,9(1):41-45. [3]De Paz, J. M., Sánchez, J., Visconti, F. , 2006. Combined use of GIS and environmental indicators for assessment of chemical, physical and biological soil degradation in a
This paper is funded by the National Natural Science Foundation of China (41001049); the Ministry of Science and Technology of China (2010DFB10030); the Key Program of National Natural Science Foundation of China (40930101); the National Basic Research Priorities Program of China(2007FY120100); the Commonweal Foundation of China’s National Academy (201220229). REFERENCES
17
Spanish Mediterranean region[J]. Journal of Environmental Management, 79: 150-162. [4]Gao, H. Li, W.,Li, H., 2003. Conservation tillage technology with Chinese characteristrics[J].Transactions of the CSAE,19(3):1-4. [5]Jiao, W.He, Y., Zhang, X. , 2010. Study on suitability regionalization of conservation Tillage Based on GIS[J].Transactions of the CSAE,41(2):47-51, 67.
[6]Uri, N.D., Atwood, J.D., Sanabria, J., 1998. The environmental benefits and costs of conservation tillage[J]. The Science of the Total Environment, 216:13-32. [7]Wang, Z., Gan, G., Wang, J. , 2008. Crop growth simulation system based on web services and GIS and its application[J].Transactions of the CSAE, 24(1): 179-182. [8]Zhao, P., Liu, G., Li, M. , 2006. Management information system for apple diseases and in sect pests based on GIS[J].Transactions of the CSAE, 22(12): 150-154.
18
Temporal and Spatial Variability of Soil Nutrients in the county scale of Fujian KONG Qing-bo1 , He Yingbin2, ZHANG Ming-qing1 Zhang Qing1 LI Juan1 1.Soil and Fertilizer Institute Fujian Academy of Agricultural Sciences , Fuzhou, 350013,China; 2. Institute of Agricultural Resources and Regional Planning, CAAS
[email protected] characteristics of the soil nutrient spatial variability. At present, the studies of small spatial scales on the area of region or village have been made, but less on the county scale. Bases its analysis on the arable lands of the County regions of Southeast China, analyzing the spatial variation of soil nutrient, this article has an important reference value for guiding the county fertility and nutrient management.
Abstract-Based on the analysis of top soil sampling points, providing theoretic and Practice support for precision fertilization in the county scale of Fujian.. Temporal and spatial variability characteristics of farmland soil nutrient(SOM 、 alkali hydrolysable N 、 available P 、 available K)content were studied employing geostatistics statistics and geographic information system(GIS). Based on the analysis of top soil sampling points the county scale in space, The content of soil nutrient is big difference in different land; A contour map of nutrient content was obtained using ordinary Kriging interpolation, in accordance with soil fertility grades, spatial distribution information of alkali hydrolysable N were deficient in part of the regional, heavily deficient of available K and surplus of available P in Most of the regional respectively; for example, compared with 1980, it presents the uptrend of available P, also confirmed the accumulation of phosphorus in Nutrient balance. Keywords - Soil nutrient; Temporal and spatial variability; soil fertility grades
1 MATERIAL AND METHOD 1.1 The basic situation of the study area Choosing Jingjiang city and Minhou county as the study area. Its geographical location are located between east longitude 118 ° 51 ' to 119 ° 25' ,north latitude 25 ° 47 'to 26 ° 37 ' and east longitude 118 ° 24 ' to 118 ° 43', north latitude 24 ° 30 ' to 24 ° 54'. Lying in the central south and north counties of Fujian Province. Most of its terrain and Geomorphology are hills and alluvial plains. With the subtropical humid monsoon climate, its average annual precipitation is more than 1500 mm.
PREFACE
1.2 Sample collection and analysis
Soil is a natural Continuum, Spatial Variability is a natural essence of soil. It’s a foundation to well manage the soil nutrient and properly implement the fertilization by getting a fully understanding of the spatial variability of the soil. Studies have proved that the soil nutrient is connected with the space, whose variability is different from Nutrient type, soil parent material [2,3], topography [4-8], human activities[9-11] etc. With the difference within A few meters, a few hundred meters, a few kilometers or even hundreds of kilometers, and through using the Kriging technic to analyze the soil nutrient spatial distribution pattern enable the achievement of many significant results. Since the 1980s after the second soil census, the big differences between the Land use, cropping systems, tillage practices, fertilization levels have made a big influence on the variation of the soil nutrient. The original nutrient spatial distribution can no longer meet current production needs, the preparation of knowing the nutrient spatial variability has made to the application of the recommended fertilizer technique. Therefore, it’s a great necessary to analyze the soil nutrient spatial variability of a larger scope, disclosing the
Firstly, the study was planned in the indoor, then setting GPS positioning in the field, analyzing the farmland soil of Jinjiang City and Minhou County by fixed-point sampling, to find the exact position of the sample. Fig. 1 has the distribution. The sampling depth is 0-20 cm, the sampling time is late March 2007 to early April. The selected soil nutrient indicators include soil organic matter, available nitrogen, rapid available phosphorus, rapid available potassium, applying potassium dichromate volumetric method to test soil organic matter and using Olson to test rapid available phosphorus. The rapid available potassium adopted NH4Ac to extract, and flame photometry to test and Available nitrogen can be tested by alkaline hydrolysis diffusion method[18]. 1.3 Spatial Analysis To calculate the variograms of soil nutrient values by using of geostatistics components in GS +5.1, and involving the geostatistical semi variance. Using the ordinary Kriging interpolation to obtain the main nutrient indexes by respectively using ArcGIS9.0 and fitting them 19
to the contour map based on the parameter values
Fig. 1
of the variogram[19].
Location of study region and sample site distribution
certain process on a smaller scale can not be ignored. The Nugget of soil available nitrogen, rapid available phosphorus, potassium of the two counties is relatively large, which may be related to the field management practices such as nitrogen application, methods or types etc. Generally speaking, the abutment value means the total variation within the system, the ratio of the Nugget and the Sill means that the caused by the random part accounted for the proportion of the total variation of the system, if the ratio is high, which means the spatial heterogeneity caused by the random part plays a major role. From the point of structural factors, the ratio of the Nugget and the Sill can indicate the degree of spatial correlation of the system variables. If the ratio is less than 25%, which indicates that the system has a strong spatial correlation; If it’s between 25% and 75%, then the system has a moderate spatial correlation; if more than 75% ,then it’s weak. In Minhou County, the ratios of the Nugget and the Sill of the organic matter, potassium, available phosphorus are 49.9%, 46% and 45.9%, indicating that the spatial distribution of these three nutrients is the medium spatial correlation, which may be related to soil nutrients distribution of structural and stochastic factors.Mainly influenced by the structural factors such as climate, parent material, topography, soil types etc, the three nutrients of Jinjiang City shows strong spatial correlation. While the random factors such as fertilization, tillage, planting system and other human activities make the spatial correlation of the soil nutrient decreases towards the direction of homogenization. The farmland of the organic matter of the two counties shows an interaction between structural and random factors.
2 RESULT AND DISCUSSION The variation of nutrients in farmland soils Table 1 indicates that the available nitrogen, rapid available phosphorus, rapid available potassium content of the farmland soil of Jinjiang City and Minhou County varies greatly. Take Minhou County as an example, the content of Alkali hydrolyzable nitrogen, available phosphorus, available potassium ranges from 10.10~ 735.10mg/kg,0.80~ 667.90mg/kg and 7 ~ 683.40mg/kg, the average values are 162.18mg/kg,45.53 mg/kg,90.94 mg/k. These two types of soil organic matter content varies little, and the skewness and kurtosis of organic matter of are less than other nutrients. Compared with the two counties, the nutrients variation of the Minjiang City ranges more than Minhou County. Because the traditional statistical analysis can only generalize the soil nutrient variation, but cannot reflect its partial characteristics, namely, only reflects the overall samples, but can not quantitatively describe the stochastic , structure, independence and correlativity of soil nutrients. Therefore, to analyze and discuss the Soil Nutrient Spatial Variability structure by further adopting the geostatistics method. Table 2 has the result. Table 2 indicates that the theoretical model of the other nutrients is in good agreement with the spherical model, except that the rapidly available potassium of Minhou County is in line with the exponential model, whose coefficient of determination is comparatively higher. The Nugget value is caused by the experimental error and the less-than-the-actual-sampling-scale, which indicates that the spatial heterogeneity of the random portion. If the Nugget is big, then a 20
Table 1
Chemical characteristics of different type of farmland with county scale Samples
Counties
Nutrients
Std. Mean
Minimum
Maximum
N organic matter %
Kurtosis
Skewness
Deviation
224
2.50
1.10
5.00
0.69
0.54
0.69
2571
162.18
10.10
735.10
57.85
13.54
2.48
2571
45.53
0.80
667.90
58.26
13.04
2.88
2571
90.94
7.00
683.40
77.71
6.35
2.19
2385
2.23
0.41
6.19
0.86
0.51
0.52
2385
101.05
3.00
701.00
64.00
12.20
2.45
2385
33.99
0.90
992.50
46.41
94.82
6.97
2385
83.62
4.00
741.12
98.64
20.16
3.44
available nitrogen mg/kg available Minhou phosphorus mg/kg available potassi um mg/kg organic matter % available nitrogen mg/kg available Jingjiang phosphorus mg/kg available potassi um mg/kg Table2
Theoretical semivariogram models of soil nutrients and corresponding parameters Partial
Nugget variance/
Maximum
Sill
Partial Sill
correlation distance
c0 + c
[c0/(c+c0)]
(km)
Nugget Counties
Nutrients
Modals variance c0
Jingjiang
R2
organic matter
Globular
56.5
124.2
0.455
61.0
0.739**
available nitrogen
Globular
2200
8479
0.259
54.6
0.948**
Globular
1190
4966
0.240
61.1
0.869**
available potassium
Globular
2510
13700
0.183
22.2
0.91**
organic matter
Globular
0.387
0.775
0.499
210.0
0.501**
available nitrogen
Globular
2430
7200
0.337
210.9
0.836**
Globular
2690
5858
0.459
191.9
0.644**
Index
5260
11438
0.460
632.7
0.574**
available phosphorus
Minhou
available phosphorus available potassium
extremely low respectively accounts for 35.51% and 34.57%, 10.23% and 11.36% are the secondary level; High and extremely high 54.36% and 54.06%. Soil potassium fertility being low and extremely low are 69.22% and 60.56 % ; Medium fertility are 5.24% and 9.76%; High and extremely high are 25.53% and 29.68%. And soil organic matter being low and extremely low are 5.452% and 0.0 % ; Medium fertility are 37.11% and 22.77%; High and extremely high 57.44 % and 77.23 % . Results showed that N element is lacking in partial area, while most area is seriously lacking K element, P element is surplus in most region.
2.3 Soil grade index of nitrogen phosphorus potassium fertility According to the characteristics of soil and crop of Fujian Province, combined with the Abundance and deficiency indices of the soil fertility of Fujian, we protocol the soil fertility level index of nitrogen, phosphorus, potassium, organic matter of two places(Table3). According to the standard, Jinjiang and Minhou soil nitrogen fertility being low and extremely low are 57.29% and 5.21%; Medium fertility are 26.54% and 42.82%; High and extremely high 16.27% and 51.96%. Soil phosphorus fertility of low and 21
At present, soil nutrient management should focus on ensuring the nitrogenous fertilizer. Table3 Counties
Fertility index
While at the same time, purposefully put more potash fertilizer and less phosphate fertilizer.
Fertility grade index of soil and their distribution
Items
Extremely high
High
Medium
>200
200-150
150-100
50-100
25
25-20
20-15
15-12
120
120-100
100-80
80-60
30
30-20
20-10
10-5
200
200-150
150-100
50-100
25
25-20
20-15
15-12
120
120-100
100-80
80-60
30
30-20
20-10
10-5