Jul 14, 2008 - the Vienna based International Data Centre for further processing and analysis to ... (CTBT Organisation Preparatory Commission) in Vienna.
The Complexity of CTBT Verification. Taking Noble Gas Monitoring as an Example Verification of the Comprehensive Nuclear-Test-Ban Treaty is a complex undertaking. A monitoring system comprising a global network of 321 seismic, hydroacoustic, infrasound and radionuclide stations is used to detect signals that could indicate a possible nuclear explosion. This system daily sends more than 10 GB of raw data to the Vienna based International Data Centre for further processing and analysis to answer a simple question: have any indications for a possible nuclear explosion been sensed? We will focus on the 40 stations in charge for global radioxenon monitoring and discuss the complexity of solving the nuclear source attribution problem. Ó 2008 Wiley Periodicals, Inc. Complexity 14: 89–99, 2008
INTRODUCTION
T
he verification of international agreements is often a highly complex undertaking. First of all, the cultural gap between scientific analysis and diplomatic thinking has to be bridged. Furthermore, even within the process of measurement, data processing, and analysis, many different methodologies are applied in an interdisciplinary cooperation. The Comprehensive Nuclear-Test-Ban Treaty (CTBT) bans all nuclear explosions. It has not yet entered into force, but its verification system is being established by the Provisional Technical Secretariat (PTS) of the CTBTO PrepCom (CTBT Organisation Preparatory Commission) in Vienna. This verification system consists of three elements: global monitoring, consultation and clarification as well as on-site inspections. The main component is the International Monitoring System (IMS) that will be used to verify compliance with the CTBT once it has entered into force. This system will consist of 321 measurement stations all over the world (see Figure 1). Seismic, hydroacoustic, infrasound, and radionuclide sensors are used to detect signals that could indicate a possible nuclear explosion. Every day, more than 10 GigaByte of raw data will be transmitted through a Global Communication Infrastructure (GCI) system to the International Data Centre (IDC) of the PTS in Vienna. The GCI consists of a network of five satellites that links the data measured at IMS stations directly to Vienna,
MARTIN B. KALINOWSKI ANDREAS BECKER PAUL R. J. SAEY MATTHIAS P. TUMA AND GERHARD WOTAWA
Martin B. Kalinowski and Matthias P. Tuma are from the Carl Friedrich von Weizsa¨cker Center for Science and Peace Research, University of Hamburg, Beim Schlump 83, 20144 Hamburg, Germany (e-mail: Martin.Kalinowski@ uni-hamburg.de) Andreas Becker, Paul R. J. Saey and Gerhard Wotawa are from the Preparatory Commission for the Comprehensive Nuclear Test-Ban-Treaty Organization (CTBTO), Provisional Technical Secretariat, Vienna International Centre, A-1400 Vienna, Austria
This is an invited paper for the Special Issue—Security and Complexity, Guest ¨ rgen Scheffran. The views expressed herein are those of the authors and do Editor: Ju not necessarily reflect the views of the CTBTO Preparatory Commission.
Q 2008 Wiley Periodicals, Inc., Vol. 14, No. 1 DOI 10.1002/cplx.20228 Published online 14 July 2008 in Wiley InterScience (www.interscience.wiley.com)
C O M P L E X I T Y
89
where it is also controlled and managed. The task of the IDC is to process and analyze this huge amount of data in order to break this information down to a simple message: have any indications for a possible nuclear explosion been sensed? This is reported in a daily executive summary bulletin that refers to more elaborate lists and reports. The IDC reports do not contain any interpretation or prejudice. The final judgement is left to the states parties. The raw data and the reports are sent out to the customers, which are authorized users in the member states. National data centers (NDCs) make use of the reports and may conduct own independent analysis on the raw data in order to meet their national obligations. In particular, NDCs report to their governments all events of interest. The 40 station noble gas monitoring system for the Comprehensive NuclearTest-Ban Treaty (CTBT) is taken here as the example to demonstrate the complexity of arms control verification. Focusing on a description of its components and their interconnections, we are not applying any methods to measure or model its complexity. Xenon isotopes and their isomers are the most likely observable radioactive signatures, even in the case of underground nuclear explosions. However, at stations located downwind to regions where nuclear reactors are located, these isotopes will frequently be detected unrelated to nuclear testing, because nuclear reactors release radioactive xenon during normal operation. Therefore, proper source characterization is important for determining whether an event is possibly a nuclear explosion. In doing so, xenon samples will be collected and measured on a daily basis at 40 radionuclide stations of the International Monitoring System (IMS) that is currently being established [1, 2]. Because of their halflives and fission yields, the xenon radionuclides 131mXe, 133mXe, 133Xe, and 135 Xe are relevant for detecting a nu90
C O M P L E X I T Y
clear explosion [3]. The detectors are designed to observe ultra-low concentrations and to quantify them. Yet, it would not be sufficient to detect a relevant signal at a detector site. It is in addition mandatory to attribute these signals to their possible source regions. This in itself is a highly complex task. It requires meteorological analysis data for the whole world, global atmospheric transport simulations as well as development and operation of special post-processing routines. Figure 2 summarizes the routine steps from field measurement through political interpretation on the level of member states.
CTBT Noble Gas Monitoring According to the treaty, at Entry into Force (EIF) there shall be 40 stations capable of measuring the relevant noble gases (Protocol to the CTBT, Part 1, C, 10). The treaty, in its Table 2-A of Annex 1 to the Protocol (see www.ctbto.org), defines where the 80 radionuclide particulate stations have to be installed. In 1999, the Preparatory Commission (PrepCom) of the CTBTO recommended which 40 of these 80 stations shall be in addition capable of noble gas monitoring [4]. The PrepCom tasked the PTS at the same session to perform an International Noble Gas Experiment (INGE) according to its specifications. After entry into force of the CTBT the conference of member states will consider and decide on a plan to implement the noble gas monitoring capability throughout the 80 stations network. There were no noble gas systems available ‘‘off-the-shelf.’’ Four countries announced their willingness to provide radioxenon sensors: the USA made a system called ARSA, Russia constructed ARIX, Sweden built SAUNA, and France offered the SPALAX system. The design criterion for all of them is that the minimum detectable concentration (MDC) of 133Xe should be 1 mBq/m3 or less for a 24-h sampling period [5]. Two of the systems, the
American ARSA and the Swedish SAUNA, use very similar measurement techniques and produce two-dimensional b-gamma coincidence spectra [6–8]. The output of the Russian ARIX system is a b-gated gamma spectrum [9]. The French SPALAX system is based on high-resolution gamma spectroscopy [10]. In 2000, these four systems were tested together for several months in parallel in Freiburg, Germany—the socalled Phase II experiment [11]. Afterwards, these four prototypes were installed at IMS sites in Guanghzou (China), Buenos Aires (Argentina), Spitsbergen (Norway), and Papeete (Tahiti). In the meantime, industrial versions have been developed and more stations are now installed worldwide [12].
Installation of Noble Gas Systems Before a noble gas station is installed at an International Monitoring System (IMS) site, the location is inspected for three main criteria: First of all, the natural radioactive background at the proposed facility is examined. Second, the local availability of logistics, support and security is assessed. Finally, it is investigated to what extend the site is connected to the free atmosphere. For the latter, the long term climatic behavior of meteorological parameters needs to confirm that the future station is not influenced by inversions or other meteorological effects that could prevent the station from sensing air from remote source regions. If one of these factors seriously affects the measurement capability of the station, a coordinate change must be requested to PrepCom. When a final location has been agreed on and a measurement system has been installed, the phase ‘‘Station Connection and Tuning’’ starts. This includes, among other activities, test sample spectra processing and analysis in a test environment at the International Data Centre (IDC); background Q 2008 Wiley Periodicals, Inc. DOI 10.1002/cplx
Q 2008 Wiley Periodicals, Inc. DOI 10.1002/cplx
C O M P L E X I T Y
91
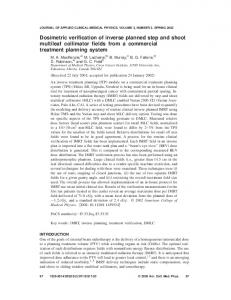
Global map of all 321 monitoring stations of the International Monitoring System. The squares indicate the location of the 80 radionuclide stations. [Color figure can be viewed in the online issue, which is available at www.interscience.wiley.com.]
FIGURE 1
FIGURE 2
Overview of steps required for noble gas monitoring from field measurement through political interpretation on the level of member states.
and blank spectra are collected; a calibration spectrum is measured and daily operations start. Upon successful installation, the phase ‘‘Station Initial Testing’’ commences. During a few months, spectra are routinely processed, analyzed and reviewed. After satisfactory completion of this test phase, a submission to the IDC Configuration Control Board (CCB) is made for admission into the PTS operational system (Ops). Once in Ops, the final ‘‘Testing and Evaluation’’ period starts, where daily operations are commenced and regular ‘‘Station Testing Meetings’’ are held to conclude after a certain period the Testing and Evaluation period. Now having demonstrated that the station fulfils PrepCom specifications, the facility is certified. The requirements of highly reliable and almost completely automated operations add a layer of complexity in addition to the scientific challenges. 92
C O M P L E X I T Y
By mid 2008, 20 stations will be sending noble gas data to the IDC. As more stations begin to transmit data, its sustaining performance becomes a matter of increasing importance. A ‘‘Coordination for Provisional IMS Operation and Maintenance’’ (OMC) group has been formed that focuses on network operations, maintenance (including contract management), and training, striving for continuous improvement of the performance of the IMS operations. Among the resources used is the ‘‘IMS Reporting System’’ (IRS), a troubleshooting, work ticket system tool that serves as a vehicle for communication between the PTS and the Station Operators.
Radioxenon Measurement For the verification of the Treaty, four xenon isotopes are of interest. They all emit photons (X-rays and/or gamma rays) in coincidence with betas or conversion electrons. X-rays are in the 30
keV range and have a total branching ratio of about 50%, except for 135Xe, which has just a 5% X-ray branch. The strongest associated conversion electrons in coincidence with the gamma photons are 129.4, 198.7, 45.0, and 213.8 keV for 131mXe, 133mXe, 133Xe, and 135Xe, respectively. Other strong coincident decay modes are the 346 keV endpoint energy beta decay of 133 Xe in association with a 81.0 keV gamma decay, and the 901 keV endpoint energy beta decay in 135Xe, which is followed by a 249.8 keV gamma ray. The noble gas detectors developed to measure these four isotopes at ultra low level are based on the following principles. Air is sampled at ‘‘high’’ volume with a minimum air flow that has to be larger than 0.4 m3/h. After removal of aerosols, water, radon, CO2, and others, the next step is the extraction of xenon gas from the processed air. This is performed with high effiQ 2008 Wiley Periodicals, Inc. DOI 10.1002/cplx
ciency by adsorption of xenon onto charcoal followed by thermal desorption of xenon and, depending on the system, also with molecular sieve columns. Now the stable xenon volume of the concentrated gas may be quantified, for example, by gas chromatography. After a 12-h cycle, a SAUNA system would have produced about 1 ml of stable xenon, enough for a low level nuclear measurement.
Different Nuclear Counting Systems After separation, the xenon gas flows into the nuclear counting system. This is based on one of the following three methods: two-dimensional b-gamma coincidence (b-g) spectroscopy, b-gated gamma (b-gated g) coincidence spectroscopy or high-resolution gamma (g) spectroscopy. The main element of the b-g detector is a sodium-iodine (NaI) crystal with a cylindrical cavity. It holds a plastic scintillator cell for the gas to enter during measurements. On top and underneath the NaI is a photomultiplier to detect gamma pulses, with another two photomultipliers at the end of the plastic scintillator cell for beta pulses. The electronic system counts the gamma, the beta and the coincidence pulses for around 12 h. Before each measurement, a quality control source (europium-152) enters the cell and is measured, so the analyst at the IDC can verify the stability of the detector. Then, a gas background is measured for 11 h to count the possible memory effect of a previous sample. The b-gated g detector also consists of a cut-out NaI crystal. Its cavity comprises a very thin layer of plastic, triggering the gamma counting system when a beta particle (electron) passes. This detector only counts a beta gated gamma spectrum for 12 h and therefore has no beta resolution. As the plastic cell is very thin, this system has almost no memory effect. The quality control measurement is performed by Q 2008 Wiley Periodicals, Inc. DOI 10.1002/cplx
insertion of a barium-133 source for 5 min. Every 2 h, a spectrum is saved. As this system creates only a one-dimensional low resolution spectrum, all the preliminary spectra and the full spectrum are needed to differentiate and to calculate the activity of the two metastable isotopes of interest, 131mXe and 133m Xe by nuclear decay. The g detector uses a p-type broad energy High Purity Germanium (HPGe) detector. The air flows into a gas sample cell, which is made of low background aluminum, on top of the germanium crystal. At some stations, the standard HPGe end cap, which has an aluminum window, has been replaced by a carbon fiber window to give improved X-ray transmission. The gas sample is measured for 24 h. Above the cell, a quality control source is mounted, which contains a mixture of radioisotopes that emit gamma lines at other energies than radioxenon does. These lines are used to validate the stability of the detector. After the nuclear measurement is finished, the xenon is archived in separate archive bottles, one for each sample. After 5–7 days, these bottles are emptied, flushed with a clean gas and can be reused.
Permanent Data Flow to the PTS The counts of pulses from the nuclear measurements, together with all other necessary information (e.g. site code, collection and acquisition period, xenon volume, etc.) are saved in an ASCII file and send encrypted via the CTBTO GCI to the PTS [13]. During the operation of a noble gas system, state of health (SoH) data of the collection, processing, and acquisition equipment are collected. These parameters consist of temperatures, pressures, flows, voltages, statuses of certain parts, etc. They are measured every 10 s, in most cases averaged over 1 min, then saved and sent every 10 min to the IDC. It is estimated that every day a total of 2.5 million SoH
parameters will be received and have to be assessed. Each IMS station has a meteorological tower, which measures data (temperature, atmospheric pressure, wind direction, wind speed, precipitation, and relative humidity) that are collected every 10 min. These data are also sent via the GCI to the IDC, where they are processed and saved in the database. As an added benefit, these meteorological data are made available to the World Meteorological Organization.
Data Analysis The spectra are processed automatically at the IDC. A program parses the data out of the data messages and saves them in the database. Then, the automatic analysis starts and prepares the spectra for a radionuclide analyst for review. Until EIF, analysts review spectra on an 8 h per day, 5 days per week basis. Depending from which station the spectra came, different analysis and review software is used. The goal of the manual review is to determine if the spectra were collected and processed according to the minimum requirements and to calculate the exact isotopic composition of the sample measured. Beta-gamma analysis software has been developed specifically for the needs of IDC analysis [14, Saey et al., forthcoming, a]. ‘‘Regions of Interest’’ (ROI) for each nuclide are projected on the two-dimensional b-g spectra. The calculations then take into account the gas background measurement to eliminate a possible memory effect, different nuclear effects, e.g. Compton scattering from each isotope on the other present isotopes etc. The calibration of both b and g channels is a complex calculation, which is based on Compton scattering of the caesium-137 isotope. If the activity of the different isotopes in a b-gated g system is high, one calculates the activity concentration out of the gamma peaks. The C O M P L E X I T Y
93
2. Time of the release assuming a pulse release within a few hours 3. Possible location of the release assuming a point source 4. Total activity release estimated from the singular emission required to explain excess above the background level.
FIGURE 3
The latter is based on an understanding of the background that can be expected from known sources.
Source Type Categorization The main methods that could be used to determine whether the observations may indicate a nuclear explosion are based on radioactivity parameters as well as on atmospheric simulations:
Plot of different radioxenon isotopic ratios exhibiting distinct domains for emissions from nuclear reactors (left: squares, diamonds and circles); and explosion events and subsequent decay (right). [Color figure can be viewed in the online issue, which is available at www. interscience.wiley.com.]
meta-stable isotopes, however, do not have a gamma signal in environmental measurements in a NaI detector. Therefore, the X-ray signal, which is for both isotopes at 30 keV, needs to be deconvolved using the 2-h preliminary spectra, as 131mXe and 133mXe have different half-lives (11.9 days respectively 2.19 days). If the activity concentration in the sample measured with a g detector is high, the software used recognizes all the relevant gamma peaks and calculates the activity concentration. If, however, the activity of the meta-stable isotopes is very low, complex mathematics are used to deconvolve their X94
C O M P L E X I T Y
ray peaks at around 30 keV [15]. To be able to perform these ultra-low measurements, several calibrations have to be performed regularly for each detector: energy calibration, resolution calibration, efficiency calibration, total efficiency calibration, step ratio calibration, left and right tail calibration.
Source Characterization To fully characterize a detected signal, one uses all measured parameters. The following source characteristics are of interest: 1. What is the type of the source: nuclear reactor or explosion?
c Use of isotopic ratios to distinguish a signal of a nuclear reactor from that of a nuclear weapon test. If all four isotopes are measured, the isotopic relationships resulting from a nuclear explosion can be clearly distinguished from those generated in a nuclear reactor (see Figure 3) [16]. The only civilian releases that have an isotopic signature in the domain of nuclear explosions are caused by the processing of highly enriched uranium targets after short-term irradiation. These are used for the production of isotopes e.g. for medical applications. c Determine whether the concentration is normal or anomalous by comparing the observed concentration with the expected one. Nuclear tests may have significantly larger emissions than nuclear reactors. The historic and recent radioxenon background at the specific station can be used to set the limits for typical concentrations. If contributing sources are known well enough, atmospheric transport simulations could be used to predict the concentrations at the stations. c Detected signals are traced back to possible source regions. The possible geographic area may harbor either known legitimate sources or suspected nuclear test sites. Q 2008 Wiley Periodicals, Inc. DOI 10.1002/cplx
c With the additional information of the source time, the radioxenon detection might also be correlated in space and time with relevant seismo-acoustic events that show explosion characteristics.
FIGURE 4
The International Data Centre in Vienna issues daily reports with all the parameters that are required to characterize the source and make the interpretation. However, the final judgment is left to the relevant authorities in the State Parties.
Radioxenon Background If only a few isotopes are detected, information about the background is instrumental for the source type categorisation. The first question is whether the measured radioxenon concentration is significantly higher than the background caused by legitimate emissions from known sources. Relevant experience with observed radioxenon background has been gained at experimental stations [17–18; Saey et al., forthcoming, b] set up and operated for the CTBTO Preparatory Commission by the International Noble Gas Experiment (INGE). In order to provide a basis for the assessment of data collected for CTBT monitoring from the radionuclide stations, an inventory of the global existing civilian sources of radioxenon has been proposed [19]. Based on such data, a bandwidth of civil produced radioxenon could be assessed by means of meteorological methods. Using these results, the data measured at the monitoring stations of the Comprehensive Nuclear-Test-Ban Treaty can be accordingly classified as typical or anomalous. So far, the best available aggregated data for emissions from nuclear reactors are given in reports by UNSCEAR (United Nations Scientific Committee on the Effects of Atomic Radiation). They provide the total activity of all released radioactive noble gases. A Q 2008 Wiley Periodicals, Inc. DOI 10.1002/cplx
Map showing the locations and average annual radioxenon emission strengths of European and North American Radioxenon sources.
new emission inventory is being created that is isotope specific [Kalinowski et al., submitted], and the original emission reports of the nuclear power plant operators are used as data sources. These were published by the North American Technical Center for the USA and by the European Commission for Europe. All data are computationally aggregated, and in particular, average emissions of the individual nuclear power stations are calculated or estimated if no reports are available (see Figure 4). Continuous and pulse emissions are accounted for separately. The duration and frequency of batch emissions are calculated as well from reported data. Regional analysis is done in order to determine total emissions for relevant regions like North America and Europe. For both regions, the source rate for the major nuclide, xenon-133, is around 0.3 PBq per year. This has to be compared to the annual source strength of those single sources that are related to isotope production, mainly for medical applications. They are in the order of one or more PBq/a and obviously dominate the atmospheric background.
Source Time Assessment The time information is of high importance for verifying compliance with the Comprehensive Nuclear-Test-Ban Treaty (CTBT). Empirical release data from underground nuclear explosions at the Nevada Test Site [20] have been used to test various approaches to determine the event time. These methods are based on isotopic activity ratios of 131mXe, 133mXe, 133Xe, and 135 Xe. Using three of these isotopes achieves a precision of less than 1 h in determining the explosion time of 102 Nevada tests [21]. The length of the sampling period foreseen for CTBT monitoring purposes compromises this high precision. The shorter the sampling period, the more precise the age determination would be.
Source Location by Means of Atmospheric Transport Modeling In order to attribute measurements of atmospheric trace substances (in our case the aforementioned radio-xenon isotopes) at fixed station locations during predefined collection periods to their possible source regions, C O M P L E X I T Y
95
FIGURE 5
Flow-chart of four layers for atmospheric transport modeling (ATM). [Color figure can be viewed in the online issue, which is available at www. interscience.wiley.com.]
CTBTO/PTS has developed and operates an Atmospheric Transport Modeling suite [22]. The suite consists of four layers (see Figure 5), namely the retrieval of gridded meteorological analysis data from international weather centers (layer 1), the inhouse calculation of source-receptor sensitivity (SRS) fields with backward runs of Lagrangian Particle Diffusion Models (LPDMs; layer 2), the postprocessing of SRS fields regarding source hypotheses and assumptions (layer 3) and the graphical user product generation (layer 4). To define the SRS concept as utilized by CTBTO/PTS [23], let us consider the activity concentration c of one specific radionuclide measured within one sample taken during 24 h at one single radionuclide station operated within the International Monitoring System. Then, c [Bqm23] can be simply expressed as sum of the products of a spatio-temporal source field (emission inventory) S [Bq] and a corresponding source-receptor sensitivity (SRS) field M [m23] at discrete locations (i,j) and time intervals n as follows: c¼
X
Mijn Sijn
i; j; n
96
C O M P L E X I T Y
(1)
M simply provides a multi-dimensional array of multipliers that translates a corresponding multi-dimensional array of sources into a concentration measurement at a receptor. The inverse elements of M have the dimension of a volume, which can be interpreted as the volume that a source mass released at the related geo-temporal reference would be diluted into yielding the concentration to be expected at the receptor. For each sample taken at a defined location during a defined time period, M can be computed by means of a backward (adjoint) run with an atmospheric transport model. For this run, the adjoint point release (at the exact coordinates of the measurement location) starts at the exact stopping time of the measurement, stops at the exact starting date of the measurements, and goes back a certain time period to cover the possible transport period. Both LPDMs and Eulerian Grid Models (EGMs) can be used. The LPDMs are favorable close to the point release and during the first few days, while the EGMs are more efficient in the high-dilution regimes of the well-dispersed retroplumes.
Source-Receptor-Sensitivity (SRS) computations are routinely performed by CTBTO/PTS for all radionuclide stations applying the LPDM FLEXPART [24, 25], on analyzed wind data provided by the four-dimensional Variational Analysis (4-D VAR) system of the European Centre for MediumRange Weather Forecasts (ECMWF) and, alternatively, by the Global Data Assimilation System (GDAS) of the U.S. National Centers for Environmental prediction (NCEP). Also, the HYSPLIT model [26] can be used for the same purpose. The horizontal resolution of the data is 18 in longitude and latitude and the temporal resolution is 3 h (6 h for GDAS). The assumed maximum transport duration is 14 days. For each 24-h measurement being tracked backward in time, 1.5 million particles are released. The SRS information can be postprocessed in various ways regarding source hypotheses and comparison between measured concentrations and concentrations that would result from a certain source hypothesis. In a generalized case, a source hypothesis can be expressed as gridded emission inventory (Sijn). Equation (1) can then be applied to compute the resulting activity concentration of the emitted subQ 2008 Wiley Periodicals, Inc. DOI 10.1002/cplx
CONCLUSIONS
FIGURE 6
Application example for determination of a possible source region based on a continuous single-source hypothesis [23]. The figure shows a map of correlation coefficients related to the (hypothetical) measurement scenario from the four stations marked with black dots (see also time series plots). The hypothetical source is within the field with the maximum correlation coefficients. [Color figure can be viewed in the online issue, which is available at www.interscience.wiley.com.]
stance. Then, using the model-predicted and the measured activity concentrations, a linear regression can be performed: Cmeas ¼ C0 þ aCmod
(2)
With C0, a being parameters of the linear fit. The linear correlation coefficient pertaining to the fit is R2. In case that C0, a are greater than zero, and that R2 is between 0.66 and 1, one can talk about a consistent emission hypothesis. C0 is then the background activity concentration not explained by the emission model, and a is the bias correction factor of the Q 2008 Wiley Periodicals, Inc. DOI 10.1002/cplx
emission hypothesis. In case a � 1, the emission model’s source strength is too low, and in case a � 1 it is too high. An application example based on single-source hypotheses can be found in Wotawa et al. [23] and is repeated in Figure 6. Other examples based on gridded emission inventories are provided by Wotawa et al. [27] and Saey et al. [18]. Finally the SRS information introduces a model output standard allowing also for backward ensemble dispersion modeling addressing the uncertainty inherent to any atmospheric transport calculation and potentially improving the accuracy of the source attribution effort [28].
The system for verifying compliance with the Comprehensive NuclearTest-Ban Treaty (CTBT) is a complex system. Its main component is the International Monitoring System that makes use of 321 stations with different sensor technologies: seismic, hydroacoustic, infrasound, radionuclides. The global monitoring of atmospheric xenon radioactivity is described here as an example to demonstrate the complexity of the system. At all 40 sites the atmospheric concentrations of 135Xe, 133m Xe, 133Xe, and 131mXe are measured. Their interpretation requires information about many legitimate sources (including 439 nuclear reactors) as well as special methods based on parameters like concentration and isotopic ratios in order to determine whether the source could be an explosion. The International Data Centre in Vienna issues daily reports with all parameters that are required to make the interpretation and the final judgment. This is left to the relevant authorities in the State Parties. An additional step is carried out by the IDC: to determine the possible source location of the detected radionuclides. This in itself is a highly complex process. It requires meteorological analysis data for the whole world, global atmospheric transport simulations as well as special post-processing routines. At the end of the day, all this effort leads to a simple result: Getting assurance that no nuclear device has been tested.
ACKNOWLEDGMENTS This paper has been made possible by a grant from the German Foundation for Peace Research (DSF). In addition, we thank an anonymous referee for helpful suggestions. C O M P L E X I T Y
97
REFERENCES 1. Bowyer, T.W.; Perkins, R.W.; Abel, K.H.; Hensley, W.K.; Hubbard, C.W.; McKinnon, A.D.; Panisko, M.E.; Reeder, P.L.; Thompson, R.C.; Warner, R.A. Xenon radionuclides, atmospheric: Monitoring. In: Encyclopaedia of Environmental Analysis and Remediation; Meyers, R.A., Ed.; Wiley: New York, 1998; 5295–5314. 2. Kalinowski, M.B. Comprehensive nuclear-test-ban treaty CTBT verification. In: Verifying Treaty Compliance; Avenhaus, R.; Kyriakopoulos, N.; Richard, M.; Stein, G., Eds.; Springer: Berlin, 2006; p 135. 3. De Geer, L.-E. Comprehensive nuclear-test-ban treaty: Relevant radionuclides. Kerntechnik 2001, 66, 113. 4. CTBT/PC/II/1/Add. 2/Appendix X (1997) Report of WGB to PrepCom II, 9 April 1997. 5. Schulze, J.; Auer, M.; Werzi, R. Low level radioactivity measurement in support of the CTBTO, Appl Radiat Isotopes 2000, 53, 23. 6. Bowyer, T.W.; Abel, K.H.; Hubbard, C.W.; McKinnon, A.D.; Perkins, R.W.; Reeder, P.L.; Thompson, R.C.; Warner, R.A. Automatic Radioxenon Analyzer for CTBT Monitoring, Pacific Northwest National Laboratory Report no. PNNL-11424, 1996. 7. Bowyer, T.W.; Schlosser, C.; Abel, K.H.; Auer, M.; Hayes, J.C.; Heimbigner, T.R.; McIntyre, J.I.; Panisko, M.E.; Reeder, P.L.; Satorius, H.; Schulze, J.; Weiss, W. Detection and analysis of xenon isotopes for the comprehensive nuclear-test-ban treaty international monitoring system. J Environ Radioactivity 2002, 59, 139. 8. Ringbom, A.; Larson, T.; Axelsson, A.; Elmgren, K.; Johansson, C. SAUNA—A system for automatic sampling, processing and analysis of radioactive xenon. Nuclear Instrum Methods Phys Res A 2003, 508, 542. 9. Dubasov, Y. The results of Xenon Measuring after ARIX-01 System Modification in Freiburg during August to December 2001. Proceedings of the Informal Workshop on Xenon, Papeete, Tahiti, 14–18 January, 2002. 10. Fontaine, J.P.; Pointure, F.; Blachard, X.; Taffary, T. Atmospheric xenon radioactive isotope monitoring. J Environ Radioactivity 2004, 72, 129. 11. Auer, M.; Axelsson, A.; Blanchard, X.; Bowyer, T.W.; Brachet, G.; Bulowski, I.; Dubasov, Y.; Elmgren, K.; Fontaine, J.P.; Harms, W.; Hayes, J.C.; Heimbigner, T.R.; McIntyre, J.I.; Panisko, M.E.; Popov, Y.; Ringbom, A.; Sartorius, H.; Schmid, S.; Schulze, J.; Schlosser, C.; Taffary, T.; Weiss, W.; Wernsperger, B. Intercomparison experiments of systems for the measurement of xenon radionuclides in the atmosphere. Appl Radiat Isotopes 2004, 60, 863. 12. Saey, P.R.J.; De Geer, L.-E. Notes on radioxenon measurements for CTBT verification purposes. Appl Radiat Isotopes 2005, 63, 765. 13. Matthews, K.M.; De Geer, L-E. Processing of data from a global atmospheric radioactivity monitoring network for CTBT verification purposes. J Radioanal Nuclear Chem 2005, 263, 235. 14. Axelsson, A.; Ringbom, A. Xenon Air Activity Concentration Analysis from Coincidence Data. FOI-R-0913-SE, ISSN 1650-1942, Swedish Defense Research Agency, FOI, Sweden, 2003. 15. Stocki, T.J.; Bean, M.; Ungar, R.K.; Toivonen, H.; Zhang, W.; Whyte, J.; Meyerhof, D. Low level nobel gas measurements in the field and laboratory in support of the comprehensive nuclear-test-ban treaty. Appl Radiat Isotypes 2004, 61, 231. 16. Kalinowski, M.B.; Pistner, Ch. Isotopic signature of atmospheric xenon released from light water reactors. J Environ Radioactivity 2006, 88, 215. DOI: 10.1016/j.jenvrad. 2006.02.003. 17. De Geer, L.-E. Atmospheric radionuclide monitoring: A Swedish perspective. In: Monitoring a Comprehensive Nuclear Test Ban Treaty; Huseby, E.S.; Dainty, A.M., Eds. Kluwer: The Netherlands, 1996; p 157. 18. Saey, P.R.J.; Wotawa, G.; De Geer, L.-E.; Axelsson, A.; Bean, M.; d’Amours, R.; Elmgren, K.; Peterson, J.; Ringbom, A.; Stocki, T.J.; Ungar, R.K. Radioxenon background at high northern latitudes, J Geophys Res Atmospheres, 2006, 111, D17306. Doi: 10.1029/ 2005JD007038, 2006. 19. Kalinowski, M.B.; Erickson, L.H.; Gugle, G.J. Preparation of a Global Radioxenon Emission Inventory. Understanding Sources of Radioactive Xenon Routinely Found in the Atmosphere by the International Monitoring System for the Comprehensive NuclearTest-Ban Treaty. Reseach Report ACDIS KAL:1.2005. Program for Arms Control, Disarmament and International Security at the University of Illinois at Urbana-Champaign, December 2005. Availble at: http://www.acdis.uiuc.edu/Research/ResReports/ KalinowskiRR.pdf 20. Kalinowski, M.B. Characterisation of prompt and delayed atmospheric radioactivity releases from underground nuclear tests at Nevada as a function of release time. J Environ Radioactivity, in press. 21. Kalinowski, M.B. Nuclear explosion time assessment based on xenon isotopic activity ratios. Appl Radiat Isotopes, in press. 22. Becker, A.; Wotawa, G.; De Geer, L.-E. Review on new PTS modelling capabilities supporting the emerging CTBTO-WMO response system including a proposal for standardised model inter-comparison. WMO, WWW, CBS/ERA-CG/INF. 1/Doc. 8(3), http://www.wmo.ch/web/www/ERA/Meetings/ERACG-Geneva2004/Doc8-3.pdf, 2004. 23. Wotawa, G.; De Geer, L.-E.; Denier, P.; Kalinowski, M.; Toivonnen, H.; D’Amours, R.; Desiato, R.; Issartel, J.-P.; Langner M.; Seibert, P.; Frank, A.; Sloan, C.; Yamazawa, H. Atmospheric transport modelling in support of CTBT verification—Overview and basic concepts Atmospheric Environ 2003, 37, 2529. 24. Stohl, A.; Hittenberger, M.; Wotawa, G. Validation of the Lagrangian particle dispersion model FLEXPART against large scale tracer experiment data. Atmospheric Environ 1998, 32, 4245. 25. Stohl, A.; Forster, C.; Frank, A.; Seibert, P.; Wotawa, G. Technical note: The Lagrangian particle dispersion model FLEXPART version 6.2. Atmos Chem Phys 2005, 5, 2461. 26. Draxler, R.R.; Hess, G.D. An overview of the HYSPLIT_4 modelling system for trajectories, dispersion and deposition. Aust Met Mag 1998, 47, 295–308.
98
C O M P L E X I T Y
Q 2008 Wiley Periodicals, Inc. DOI 10.1002/cplx
27. Wotawa, G.; De Geer, L.-E.; Becker, A.; D’Amours, R.; Jean, M.; Servranckx, R.; Ungar, K. Inter- and intra-continental transport of radioactive cesium released by boreal forest fires. Geophys Res Lett 2006, 37, L12806. doi:10.1029/2006GL026206. 28. Becker, A.; Wotawa, G.; De Geer, L.-E.; Seibert, P.; Draxler, R.R.; Sloan, C.; D’Amours, R.; Hort, M.; Glaab, H.; Heinrich, P.; Grillon, Y.; Sherhakov, V.; Katayama, K.; Zhang, Y.; Stewart, P.; Hirtl, M.; Jean, M.; Chen, P. Global backtracking of anthropogenic radionuclides by means of a receptor oriented ensemble dispersion modelling system in support of nuclear-test-ban treaty verification Atmospheric Environ 2007, 41, 4520.
Q 2008 Wiley Periodicals, Inc. DOI 10.1002/cplx
C O M P L E X I T Y
99