doi:10.1088/0004-6256/145/6/153. C 2013. The American Astronomical Society. All rights reserved. Printed in the U.S.A.. THE CONTRACTION OF OVERLYING ...
The Astronomical Journal, 145:153 (10pp), 2013 June � C 2013.
doi:10.1088/0004-6256/145/6/153
The American Astronomical Society. All rights reserved. Printed in the U.S.A.
THE CONTRACTION OF OVERLYING CORONAL LOOP AND THE ROTATING MOTION OF A SIGMOID FILAMENT DURING ITS ERUPTION X. L. Yan (���)1,2 , G. M. Pan (���)3 , J. H. Liu (���)2,4 , Z. Q. Qu (���)1 , Z. K. Xue (���)1 , L. H. Deng (���)1 , L. Ma (��)1 , and D. F. Kong (���)1 1
National Astronomical Observatories/Yunnan Astronomical Observatory, Chinese Academy of Sciences, Kunming 650011, China 2 Key Laboratory of Solar Activity, National Astronomical Observatories, Chinese Academy of Sciences, Beijing 100012, China 3 College of Mathematics Physics and Information Engineering, Jiaxing University, Jiaxing 314001, China 4 Department of Physics, Shijiazhuang University, Shijiazhuang 050035, China Received 2012 December 17; accepted 2013 April 4; published 2013 May 3
ABSTRACT We present an observation of overlying coronal loop contraction and rotating motion of the sigmoid filament during its eruption on 2012 May 22 observed by the Solar Dynamics Observatory (SDO). Our results show that the twist can be transported into the filament from the lower atmosphere to the higher atmosphere. The successive contraction of the coronal loops was due to a suddenly reduced magnetic pressure underneath the filament, which was caused by the rising of the filament. Before the sigmoid filament eruption, there was a counterclockwise flow in the photosphere at the right feet of the filament and the contraction loops and a convergence flow at the left foot of the filament. The hot and cool materials have inverse motion along the filament before the filament eruption. Moreover, two coronal loops overlying the filament first experienced brightening, expansion, and contraction successively. At the beginning of the rising and rotation of the left part of the filament, the second coronal loop exhibited rapid contraction. The top of the second coronal loop also showed counterclockwise rotation during the contraction process. After the contraction of the second loop, the left part of the filament rotated counterclockwise and expanded toward the right of NOAA AR 11485. During the filament expansion, the right part of the filament also exhibited counterclockwise rotation like a tornado. Key words: Sun: activity – Sun: filaments, prominences – Sun: magnetic topology – Sun: surface magnetism Online-only material: animations, color figure
authors. Liu et al. (2009a) observed the contraction of the extreme-ultraviolet coronal loop overlying the flaring region during the preheating as well as the early impulsion of a C-class flare. The contraction was sustained for about 10 minutes at an average speed of about 5 km s−1 . Liu & Wang (2009) studied the evolution of a group of TRACE 195 Å coronal loops overlying a reverse S-shaped filament on 2001 June 15. They found that the loops were pushed upward by the rising of the filament and then began to contract at a speed of about 100 km s−1 as the filament rose explosively. The loops remained intact during the filament eruption. The fast contraction of coronal loops at the peak of an X-class flare in NOAA AR 10808 was reported by Liu & Wang (2010). The coronal loop first experienced a slow contraction at about 6 km s−1 for about 5 minutes and began a fast contraction at about 120 km s−1 . Gosain (2012) used the high-resolution data observed by SDO/AIA and found that there were three distinct phases of the coronal dynamics during the X2.2-class flare event in NOAA AR 11158 on 2011 February 15. With the slow rise of the underlying flux rope, the overlying coronal loops first exhibited a slow rising motion prior to the flare. Then the coronal loops experienced a quick collapse and an expansion motion during the flare. Next, they began to oscillate after the flare. By using nonlinear force-free extrapolation, Liu et al. (2012) found that the coronal current system underwent an apparent downward collapse after the sigmoid eruption in NOAA AR 11158. Erupting filaments are sometimes observed to undergo a rotation about the vertical direction as they rise (Kurokawa et al. 1987; Ji et al. 2003; Zhou et al. 2006; Green et al. 2007; Liu et al. 2007b; Liu & Alexander 2009; Muglach et al. 2009; Bemporad et al. 2011; Joshi & Srivastava 2011; Thompson 2011; Thompson et al. 2012). Fan (2005) performed MHD
1. INTRODUCTION Sigmoid magnetic structures as a special type of magnetic field topology were often observed to be precursors to flares and coronal mass ejections (CMEs; Sterling & Hudson 1997; Sterling et al. 2000; Pevtsov 2002; Liu et al. 2007a; Jiang et al. 2007; Green & Kliem 2009; Yan et al. 2012) and were statistically more likely to erupt and involved with flares and CMEs (Hudson et al. 1998; Canfield et al. 1999, 2007; Yan et al. 2011). The MHD simulation showed that the shearing motion and the emergence of the flux tube can result in the formation of an S-shaped flux rope (Amari et al. 2000; Magara & Longcope 2001; Fan 2001; Gibson et al. 2004; Aulanier et al. 2010). However, the detailed formation and eruption process of the S-shaped filament is not well understood. Evidence of the magnetic loop shrinkage associated with flares and flare-like events has been shown by a number of ˇ authors (Svestka et al. 1987; Forbes & Acton 1996). The shrinkage of a large-scale nonflare loop observed by the Yohkoh Soft X-ray Telescope was reported by Wang et al. (1997). They suggested that the shrinkage is not an apparent motion, but a real contraction of the coronal loops as a result of the heating at the footpoints followed by gradual cooling. Hudson (2000) conjectured that a magnetic implosion at the preflare energy storage must occur simultaneously with coronal events such as flares and CMEs. Later, shrinkage of flare radio loops, EUV loops, and hard X-ray looptop sources was also observed in several flare events (Sui & Holman 2003; Sui et al. 2004; Li & Gan 2005, 2006; Vrˇsnak et al. 2006; Veronig et al. 2006; Ji et al. 2007; Joshi et al. 2009). Recently, the contraction of the coronal loop associated with the flares and the filament eruptions was observed by several 1
The Astronomical Journal, 145:153 (10pp), 2013 June
Yan et al.
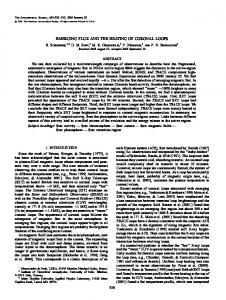
Figure 1. The 304 Å image at 00:00UT on 2012 May 22 with HMI line-of-sight magnetogram at 00:00UT on 2012 May 22 superimposed. The solid white and black lines in the figure are the intensity contours of the positive and negative magnetic fields, respectively. The levels of the contours are ±50 G, ±100 G, and ±200 G. The white box in the figure denotes the position of the filament in NOAA AR 11458.
resolution full-disk images of the corona and the transition region. The observational range of the AIA can extend to 1.3 R� . The data of the AIA has high temporal (∼12 s) and spatial resolution (0.�� 6) in seven EUV and three UV visible wavelength bands, each of which is dominated by an emission line formed at a particular temperature covering a wide temperature range from log T = 3.7 to log T = 7.3. The observations presented here are mostly at 211 Å, 171 Å, and 304 Å wavelengths, dominated by emission of Fe xiv formed at 2 MK, Fe ix formed at ∼0.7 MK, and He ii formed at 104 K. The Hα images observed by NSO/GONG are used to show the evolution of the sigmoid filament in the chromosphere. We use the 304 Å and Hα images to trace the process of the sigmoid filament eruption. The contraction of the coronal loops overlying the filament can be seen clearly from the images acquired at 171 Å and 211 Å. Full disk line-of-sight magnetograms at 45 s cadence with a precision of 10 G observed by the Helioseismic and Magnetic Imager (HMI; Schou et al. 2012) are employed to show the magnetic fields around the filament and to calculate the flow field in the photosphere.
simulations and found that the rotation of a twisted magnetic flux tube changes the direction of the rope apex relative to the overlying arcade, which helps the flux rope to erupt through the arcade field. The filament rotation is generally interpreted as a conversion of twist into writhe in a kink-unstable flux rope. Therefore, MHD helical-kink instability is the primary trigger of these eruptions (T¨or¨ok et al. 2004, 2010; Kliem et al. 2004, 2012; Fan & Gibson 2007; Srivastava et al. 2010; Kumar et al. 2012). The rotation is usually found to be clockwise (as viewed from above) if the post-eruption arcade has right-handed helicity, but counterclockwise if it has left-handed helicity. Although the contraction of the coronal loops and the rotating motion of the filament were reported separately by some authors, the movement characteristic of the coronal loops and the origin of the twist of sigmoid filament are not clear. The relationship between the motion in the corona and the flow field in the photosphere is not well studied. Thanks to the high temporal and spatial data of the Solar Dynamics Observatory (SDO), we can present a case study of the overlying coronal loop contraction and the rotating motion of the sigmoid filament in the corona and the flow field in the photosphere during its eruption to address these issues.
3. THE ERUPTION PROCESS OF THE SIGMOID FILAMENT
2. OBSERVATIONS
There was an inverse S-shaped filament in NOAA AR 11485 on 2012 May 22 observed by SDO. Figure 1 shows the filament seen from the 304 Å observation at 00:00UT with HMI
The Atmospheric Imaging Assembly (AIA; Lemen et al. 2012) on board SDO provides multiple simultaneous high2
The Astronomical Journal, 145:153 (10pp), 2013 June
Yan et al.
(a)
(b)
(d)
(e)
(g)
(h)
(c)
(f)
(i)
Figure 2. Sequence of images acquired at 171 Å to show the process of hot material motion and loop (L1) contraction from 00:20:00UT to 01:16:00UT on 2012 May 22. The black arrows denote the positions of the hot materials, while the white arrows denote the positions of the bright coronal loop overlying the filament.
line-of-sight magnetogram at 00:00UT superimposed. The white box in the figure denotes the position of the filament in NOAA AR 11458. The filament exhibited a dark and absorption structure. The solid white and black lines in the figure are the contours of the positive and negative magnetic fields, respectively. The levels of the contours are ±50 G, ±100 G, and ±200 G. From Figure 1, one can see that one leg of the sigmoid filament was situated in the positive polarity and the other leg was located in the negative polarity. Part of the hot material of the sigmoid filament moved from left to right along the filament prior to its eruption. The movement of the filament material can be seen from a series of the 171 Å images (see Figure 2) or the supplementary movie (171.mpg). The black arrows in Figures 2(a)–(d), (f), and (g) indicate the positions of the hot materials. From 00:20:00UT to
00:58:00UT, the hot materials along the filament moved from the left part to the right part of the filament. At 00:25:00UT, a bright coronal loop (loop 1; L1) astride the filament marked by the white arrow appeared (see Figure 2(b)). L1 was gradually brightened and expanded outward from 00:25:00UT to 00:55:00UT. Next, it began to contract. At 01:16:00UT, it contracted rapidly and disappeared. At 01:15:00UT, the cool material of the filament was seen to move from the middle to the left part of the filament. The black arrows in Figures 3(a)–(c) show the different positions of the cool material. The other bright loop (loop 2; L2) appeared at 01:18:00UT. From 01:18:00UT to 01:30:00UT, L2 was brightened and then exhibited a bright arch-shaped structure. It began to contract at 01:35:12UT and contracted around the middle part of the filament at 01:49:48UT. The contraction of L2 was accompanied by 3
The Astronomical Journal, 145:153 (10pp), 2013 June
Yan et al.
(a)
(b)
(c)
(d)
(e)
(f)
(g)
(h)
(i)
Figure 3. Sequence of images acquired at 171 Å to show the process of cool material motion along the filament and the other coronal loop overlying the filament (L2) contracting from 01:15:00UT to 01:50:00UT on 2012 May 22. The black arrows denote the positions of the cool material, while the white arrows denote the positions of the other bright coronal loop overlying the filament (L2). The white line in panel (a) shows the position of the time slice of Figure 4. (An animation of this figure is available in the online journal.)
obtained from 94 Å images. The contraction of the coronal loops can be seen more clearly in the 171 Å channel than in the 211 Å channel. Therefore, we use 171 Å images to trace the process of contraction. In Figure 4, “loop 1” (L1) and “loop 2” (L2) denote the coronal loops 1 and 2. “First” and “second” denote the first time and second time of the filament across the position marked by the white line in Figure 3(a). “loop 3” denotes the post-flare loops formed after the filament eruption. L1 and L2 were all first brightened and expanded a little. After L1 was brightened, it began to expand at 2 km s−1 for about 27 minutes. Then L1 started to contract at about 3 km s−1 for about 26 minutes. During the contraction of L1, L2 became bright and began to expand at 1 km s−1 for about 26 minutes. Then
the counterclockwise deflection of the left part of the filament. The top of L2 also displayed counterclockwise rotation during the contraction process. After L2 contracted and disappeared, the left part of the filament experienced a rapid counterclockwise motion and expanded toward the right of the filament. The detailed contraction process of the overlying coronal loops can be seen from the movie (171.mpg) linked to Figure 3. Figure 4 shows the time slices at the position marked by the white line in Figure 3(a). The contraction of the coronal loop overlying the filament along the white line can be seen clearly. The upper panel of Figure 4 shows the time slice acquired from 171 Å images. The middle panel shows the time slice obtained from 211 Å images and the lower panel shows the time slice 4
The Astronomical Journal, 145:153 (10pp), 2013 June
Yan et al.
(a)
(b)
(c)
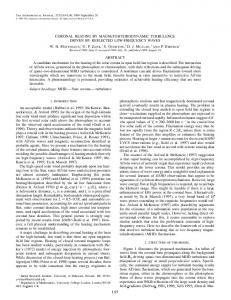
Figure 5. (a) The evolution of GOES soft X-ray emission from 00:00UT to 03:00UT on 2012 May 22 (solid line: 1–8 Å; dashed line: 0.5–4 Å). (b) Time derivatives of GOES fluxes (solid line: 1–8 Å; dashed line: (0.5–4 Å) × 5). (c) Temperature derived from GOES observation. Three peaks are marked by 1, 2, and 3 on the GOES 0.5–4 Å fluxes and the temperature curves. Figure 4. Upper panel: the time slice at the position marked by the white line in Figure 3(a) by using the 171 Å observation. Middle panel: the time slice at the same position marked by the white line in Figure 3(a) by using the 211 Å observation. Lower panel: the time slice at the same position marked by the white line in Figure 3(a) by using the 94 Å observation. “loop 1” and “loop 2” denote the coronal loops 1 and 2 overlying the filament. “First” and “second” denote the first time and second time of the filament crossing the position marked by the white line in Figure 3(a). “loop 3” denotes the post-flare loops formed after the filament eruption. The distance along the vertical axes is measured from upper left to lower right along the white line in Figure 3(a).
of L1 was associated with the small rising of GOES fluxes. After GOES fluxes decreased, L1 began to contract. However, the increase of GOES fluxes did not originate from this active region. After examining the activities on the solar disk, we find that the increase of the intensity in the chromosphere and the corona came from NOAA AR 11483 (see Figure 6). Figure 6 shows the 171 Å image at 00:30:00 UT on 2012 May 22 (left) and the difference image (right). The green circles indicate the active regions on the solar disk. From a sequence of the difference images from 00:10 UT to 00:30 UT on 2012 May 22, the intensity of NOAA AR 11483 increased during this period (see the right panel of Figure 6). After the brightening of L2 reached the maximum, the GOES 0.5–4 Å fluxes and the temperature of the corona exhibited the second peak in the curves. After the contraction of L2, the GOES 0.5–4 Å fluxes and the temperature began to decrease. No significant change of GOES 1–8 Å fluxes was detected during the expansion and contraction of L2 (see Figure 5(a)). The derivatives of GOES soft X-ray fluxes (Figure 5(b)) usually resemble the hard X-ray profile due to the Neupert effect (Neupert 1968). During the expansion and contraction of L2, the profile of the GOES 1–8 Å flux had no significant change. The curve of the temperature derived from GOES diagnostics was the same as that of the GOES 0.5–4 Å fluxes (see Figure 5(c)). The third peak in the GOES 0.5–4 Å fluxes and the temperature curves was caused by post-flare loops after the filament eruption. From the radio observation of the Yunnan Astronomical Observatory, no radio burst was detected during the contraction of the coronal loops overlying the filament.
L2 stopped expanding. Following this, they underwent a much slower contraction at about 14 km s−1 for about 5 minutes and then L2 contracted fast at about 45 km s−1 for about 5 minutes. After the contraction of L2, the coronal loop observed in 94 Å images began to contract. The contraction speed reached 41 km s−1 and then decreased to 12 km s−1 . The expansion of the other bright loop followed the contraction. The expansion speed was 16 km s−1 . There was an eight-minute time delay for the contraction of the coronal loop observed in 94 Å images with regard to the contraction of the coronal loop observed in 171 Å images. Note that all these speeds mentioned above are based on Figure 4. The corresponding speeds were calculated along the green and black lines marked on the upper and lower panels of Figure 4. Figure 5 shows the evolution of GOES soft X-ray emission, time derivatives of GOES fluxes, and temperature derived from GOES observation from 00:00UT to 03:00UT on 2012 May 22. There are three peaks marked by 1, 2, and 3 on the GOES 0.5–4 Å fluxes and the temperature curves. The brightening 5
The Astronomical Journal, 145:153 (10pp), 2013 June
Yan et al.
Figure 6. Left: the 171 Å image at 00:30:00 UT on 2012 May 22. Right: the difference image (00:30:00 UT − 00:10:00 UT). The green circles indicate active regions on the solar disk. (A color version of this figure is available in the online journal.)
the right. According to the methods of identifying filament chirality (Martin 1998; McAllister et al. 2002; Martin et al. 2008; Muglach et al. 2009), we judge that the filament is a dextral filament with left-handed twist (i.e., negative helicity). The counterclockwise rotation of the right leg of the filament can also produce left-handed twist. From the process of the filament eruption, we find that the rotating motion of the filament was not caused by the unwinding motion of the filament. The local correlation tracking technique (November & Simon 1988; Chae 2001) was used to derive the velocity fields from the HMI line-of-sight magnetograms. Figure 10 shows the computed horizontal velocity vectors superposed on HMI longitudinal magnetograms at 01:03 UT on 2012 May 22. We find that there was a counterclockwise flow in the photosphere at the right feet of the sigmoid filament and the contraction loops and a convergence flow at the left foot of the filament before the filament eruption. Therefore, the flow twisted the filament in the lower atmosphere and caused the rotation of the filament. The detailed rotating process of the filament can be seen from the movie (304.mpg) linked to Figure 8.
Figure 7 shows the Hα observation from 00:00:54UT to 02:04:14UT on 2012 May 22. The inverse S-shaped filament can be seen clearly in Figure 7(a). The filament became darker and wider at 01:24:54UT. The left part of the filament began to darken at 01:34:54UT. From the 171 Å observation, it can be inferred that the darkening of the left part of the filament was caused by the cool material flowing from the middle to the left end of the filament. At 01:53:54UT, the middle part of the filament became invisible. From the movies (171.mpg and 304.mpg), one can see that the middle part of the filament was heated following the rising and rotation of the left part of the filament. The disappearance of the middle part of the filament may be due to the rising and the heating of the filament. In the following, the left part of the filament began to rotate counterclockwise. Figure 8 shows the rotation process of the left part of the filament from 01:48:08UT to 02:04:08UT on 2012 May 22. Following the fast contraction of L2, the left part of the filament began to rise and rotated counterclockwise. After the rising of the left part of the filament, the bright material near the filament can be seen to move toward the filament at 25 km s−1 (see the upper panel of Figure 4). Moreover, the middle part of the filament was twisted with the rotation of the left part of the filament. Following the rising and rotation of the left part of the filament, the right part of the filament began to rotate around the vertical direction. The motional morphology of the filament was like a tornado (Zhang & Liu 2011; Li et al. 2012; Su et al. 2012). In Figure 9, a sequence of images acquired at 304 Å are used to show the rotating process of the right part of the filament from 02:05:08UT to 02:45:08UT on 2012 May 22. The arrows in Figure 9 indicate the right leg of the filament. The rotating motion of the filament was accompanied by the expansion of the body of the filament. After the right part rotated several cycles, the whole body of the filament erupted toward
4. CONCLUSION AND DISCUSSION In this paper, we investigate the eruption of an inverse S-shaped filament in NOAA AR 11458 by using the data of SDO and NSO/GONG. Before the filament eruption, the hot material of the filament was seen clearly from the left part to the right part of the filament seen from the 171 Å observation. Moreover, a coronal loop overlying the filament was seen to brighten and then contracted quickly. In the following, the cool material of the filament was seen to move from the middle part of the filament to its left part. Next, the other coronal loop overlying the filament brightened and also experienced contraction. The top of it displays counterclockwise rotation during the contraction process. There was an eight-minute time 6
The Astronomical Journal, 145:153 (10pp), 2013 June
Yan et al.
(a)
(b)
(c)
(d)
(e)
(f)
(g)
(h)
(i)
Figure 7. Sequence of Hα images showing the eruption process of the filament from 00:00:54UT to 02:04:14UT on 2012 May 22.
This phenomenon needs more observations to confirm. The inverse motion of filament matter implies that the filament was in the sub-equilibrium state. In this event, we find the contraction of the coronal loops overlying the filament at the beginning of the filament eruption. The coronal loops overlying the sigmoid filament first brightened. Next, the coronal loops expanded a little and then contracted quickly. The coronal loop contraction occurred at the rising of the left part of the filament. The loops with the suitable temperature and density can be visible in a narrow EUV filter. The magnetic loops over the flaring region were observed to contract and then to expand (Ji et al. 2007; Liu et al. 2009a). The contraction of the flaring loops associated with the downward motion of the hard X-ray looptop source and the converging motion of the Hα or hard X-ray footpoints is interpreted by Ji et al. (2006, 2007) and Liu et al. (2009a) to be the relaxation of the sheared magnetic field. Hudson (2000) conjectured that
delay for the contraction of the coronal loop observed in 94 Å images with regard to the contraction of the coronal loop observed by 171 Å images. The successive contraction of the coronal loops overlying the filament occurred in the corona at the initial stage of the filament eruption. After the contraction of the other coronal loop, the left part of the filament began to rotate counterclockwise. The middle of the filament was seen to be twisted accompanying the rotation of the left part of the filament. Subsequently, the right part of the filament experienced a counterclockwise rotation like a tornado. The rotation of the filament leg added the twist of the filament. Finally, the filament expanded toward the right and became invisible. With the high temporal and spatial resolution of the observation, the movement of the hot material was found from left to right along the filament and then the cool material moved from right to left along the filament before the filament eruption. The same phenomenon was reported by Yan et al. (2012). 7
The Astronomical Journal, 145:153 (10pp), 2013 June
Yan et al.
(a)
(b)
(c)
(d)
(e)
(f)
Figure 8. Sequence of images acquired at 304 Å showing the rotation process of the left part of the filament from 01:48:08UT to 02:04:08UT on 2012 May 22. (An animation of this figure is available in the online journal.)
right feet of the filament and the contraction loops and a convergence flow at the left feet of the filament before the filament eruption. Consequently, it is reasonable to understand the counterclockwise rotation of the overlying coronal loop and the filament in this manner. It is shown that the flow in the photosphere added the twist of the filament. That is to say, the filament derived the magnetic energy from the lower atmosphere. The observation also showed that the rotating rotation was a consequence of the filament eruption. Due to the expansion of the filament, the motion of the legs of the filament can be easier to observe. The counterclockwise flow must twist the magnetic field lines around the filament and cause the rotation motion of the filament. The rotating motion can transmit the energy and material from the lower atmosphere to higher atmosphere. The result is consistent with the result obtained by Wedemeyer-B¨ohm et al. (2012). They found that the
the release of the stored free energy must result in a magnetic implosion. Liu & Wang (2009) suggested that the release of the free magnetic energy and the consequent decrease of the magnetic pressure in the flaring region resulted in the contraction of the overlying coronal loops. Our observation supported that the decrease of the magnetic pressure under the filament caused by the rising of the filament resulted in the contraction of the overlying magnetic loops. Compared with former observations, we also find that before the expansion of the coronal loops overlying the filament, the coronal loops first brightened and became visible at the 171 Å observation. Moreover, the contraction of the coronal loops overlying the filament was not associated with big flares unlike the events investigated by Liu & Wang (2009, 2010) and Ji et al. (2007). From the velocity fields, we find that there was a counterclockwise flow in the photosphere at the 8
The Astronomical Journal, 145:153 (10pp), 2013 June
Yan et al.
(a)
(b)
(c)
(d)
(e)
(f)
(g)
(h)
(i)
Figure 9. Sequence of images acquired at 304 Å showing the eruption process of the sigmoid filament from 02:05:08UT to 02:45:08UT on 2012 May 22. The arrows indicate the right leg of the filament.
energy generated by vortex driving of the magnetic footpoints on small spatial scales can be channeled into the outer solar atmosphere by magnetic fields. The observed rotation motion is around the vertical direction as the sigmoid filament rises. The counterclockwise flow in the photosphere can add the twist of the filament and the coronal loop overlying the filament. When the twist of the filament reaches the critical value, the twist can be transformed into writhe in the kink-unstable filament. It is well accepted that the energy release during flares and CMEs occurs in a current sheet (Forbes 2000; Priest & Forbes 2002; Lin et al. 2004). The model of Lin & Forbes (2000) predicted that when the flux rope or filament reaches the instability, the opposite magnetic field lines under the flux rope or filament begin to reconnect and form a current sheet. The loops first brightened before their expansion and then began to contract. The contraction of the coronal loop was due to a suddenly reduced magnetic pressure underneath the filament, which was caused by the rising of the filament. After the contraction of the coronal loops, we found that the brightening and the material flow moved toward the filament at the middle of the filament. Therefore, this process implies that the magnetic reconnection below the filament occurred during the expansion of the filament.
Figure 10. Computed horizontal velocity vectors superposed on HMI longitudinal magnetograms. The maximum velocity is 1.6 km s−1 . The field of view is the same as Figure 1.
9
The Astronomical Journal, 145:153 (10pp), 2013 June
Yan et al.
The authors thank the referee for constructive suggestions. SDO is a mission of NASA’s Living With a Star Program. The authors are indebted to the SDO and NSO/GONG teams for providing the data. This work is supported by the National Science Foundation of China (NSFC) under grant numbers 10903027, 11078005, 40636031, and 11178016; Yunnan Science Foundation of China under number 2009CD120; Key Laboratory of Solar Activity of CAS under number KLSA201220,KLSA201227; HeBei Natural Science Foundation of China under number A2010001942; Youth innovation promotion association of CAS, and the National Basic Research Program of China 973 under grant number G2011CB811400.
Kumar, P., Cho, K. S., Bong, S. C., Park, S. H., & Kim, Y. H. 2012, ApJ, 746, 67 Kurokawa, H., Hanaoka, Y., Shibata, K., & Uchida, Y. 1987, SoPh, 108, 251 Lemen, J. R., Title, A. M., Akin, D. J., et al. 2012, SoPh, 275, 17 Li, X., Morgan, H., Leonard, D., & Jeska, L. 2012, ApJL, 752, L22 Li, Y. P., & Gan, W. Q. 2005, ApJL, 629, L137 Li, Y. P., & Gan, W. Q. 2006, ApJL, 644, L97 Lin, J., & Forbes, T. G. 2000, JGR, 105, 2375 Lin, J., Raymond, J. C., & van Ballegooijen, A. A. 2004, ApJ, 602, 422 Liu, C., Deng, N., Liu, R., et al. 2012, ApJL, 745, L4 Liu, C., Lee, J., Yurchyshyn, V., Deng, N., & Cho, K. 2007a, ApJ, 669, 1372 Liu, R., & Alexander, D. 2009, ApJ, 697, 999 Liu, R., Alexander, D., & Gilbert, H. R. 2007b, ApJ, 661, 1260 Liu, R., & Wang, H. M. 2009, ApJL, 703, L23 Liu, R., & Wang, H. M. 2010, ApJL, 714, L41 Liu, R., Wang, H. M., & Alexander, D. 2009a, ApJ, 696, 121 Liu, W., Petrosian, V., Dennis, B., & Holman, G. 2009a, ApJ, 693, 847 Magara, T., & Longcope, D. W. 2001, ApJ, 559, 55 Martin, S. F. 1998, SoPh, 182, 107 Martin, S. F., Lin, Y., & Engvold, O. 2008, SoPh, 250, 31 McAllister, A. H., Mackay, D. H., & Martin, S. F. 2002, SoPh, 211, 155 Muglach, K., Wang, Y. M., & Kliem, B. 2009, ApJ, 703, 976 Neupert, W. M. 1968, ApJL, 153, L59 November, L. J., & Simon, G. W. 1988, ApJ, 333, 427 Pevtsov, A. A. 2002, SoPh, 207, 111 Priest, E. R., & Forbes, T. G. 2002, A&AR, 10, 313 Schou, J., Scherrer, P. H., Bush, R. I., et al. 2012, SoPh, 275, 229 Srivastava, A. K., Zaqarashvili, T. V., Kumar, P., & Khodachenko, M. L. 2010, ApJ, 715, 292 Sterling, A. C., & Hudson, H. S. 1997, ApJL, 491, L55 Sterling, A. C., Hudson, H. S., Thompson, B. J., & Zarro, D. M. 2000, ApJ, 532, 628 Su, Y., Wang, T., Veronig, A., Temmer, M., & Gan, W. 2012, ApJL, 756, L41 Sui, L., & Holman, G. D. 2003, ApJL, 596, L251 Sui, L., Holman, G. D., & Dennis, B. R. 2004, ApJ, 612, 546 ˇ Svestka, Z. F., Fontenla, J. M., Machado, M. E., Martin, S. F., & Neidig, D. F. 1987, SoPh, 108, 237 T¨or¨ok, T., Berger, M. A., & Kliem, B. 2010, A&A, 516, 49 T¨or¨ok, T., Kliem, B., & Titov, V. S. 2004, A&A, 413, L27 Thompson, W. T. 2011, JASTP, 73, 1138 Thompson, W. T., Kliem, B., & T¨or¨ok, T. 2012, SoPh, 276, 241 Veronig, A. M., Karlicky, M., Vrsnak, B., et al. 2006, A&A, 446, 675 Vrˇsnak, B., Temmer, M., Veronig, A., Karlicky, M., & Lin, J. 2006, SoPh, 234, 273 Wang, J., Shibata, K., Nitta, N., et al. 1997, ApJL, 478, L41 Wedemeyer-B¨ohm, S., Scullion, E., Steiner, O., et al. 2012, Natur, 486, 505 Yan, X. L., Qu, Z. Q., & Kong, D. F. 2011, MNRAS, 414, 2803 Yan, X. L., Qu, Z. Q., Kong, D. F., & Xu, C. L. 2012, ApJ, 754, 16 Zhang, J., & Liu, Y. 2011, ApJL, 741, L7 Zhou, G. P., Wang, J. X., Zhang, J., et al. 2006, ApJ, 651, 1238
REFERENCES Amari, T., Luciani, J. F., Mikic, Z., & Linker, J. 2000, ApJ, 529, 49 Aulanier, G., T¨or¨ok, T., D´emoulin, P., & DeLuca, E. E. 2010, ApJ, 708, 314 Bemporad, A., Mierla, M., & Tripathi, D. 2011, A&A, 531, 147 Canfield, R. C., Hudson, H. S., & McKenzie, D. E. 1999, GeoRL, 26, 627 Canfield, R. C., Kazachenko, M. D., Acton, L. W., et al. 2007, ApJL, 671, L81 Chae, J. 2001, ApJL, 560, L95 Forbes, T. G. 2000, JGR, 105, 23153 Forbes, T. G., & Acton, L. W. 1996, ApJ, 459, 330 Fan, Y. 2001, ApJL, 554, L111 Fan, Y. 2005, ApJ, 630, 543 Fan, Y., & Gibson, S. E. 2007, ApJ, 668, 1232 Gibson, S. E., Fan, Y., Mandrini, C., Fisher, G., & Demoulin, P. 2004, ApJ, 617, 600 Green, L. M., & Kliem, B. 2009, ApJL, 700, L83 Green, L. M., Kliem, B., T¨or¨ok, T., van Driel-Gesztelyi, L., & Attrill, G. D. R. 2007, SoPh, 246, 365 Gosain, S. 2012, ApJ, 749, 85 Hudson, H. S. 2000, ApJL, 531, L75 Hudson, H. S., Lemen, J. R., St. Cyr, O. C., Sterling, A. C., & Webb, D. F. 1998, GeoRL, 25, 2481 Ji, H., Wang, H., Schmahl, E. J., Moon, Y.-J., & Jiang, Y. 2003, ApJL, 595, L135 Ji, H. S., Huang, G. L., & Wang, H. M. 2007, ApJ, 660, 893 Ji, H. S., Huang, G. L., Wang, H. M., et al. 2006, ApJL, 636, L173 Jiang, Y. C., Chen, H. D., Shen, Y. D., Yang, L. H., & Li, K. J. 2007, SoPh, 240, 77 Joshi, A. D., & Srivastava, N. 2011, ApJ, 730, 104 Joshi, B., Veronig, A., Cho, K. S., et al. 2009, ApJ, 706, 1438 Kliem, B., Titov, V. S., & T¨or¨ok, T. 2004, A&A, 413, L23 Kliem, B., T¨or¨ok, T., & Thompson, W. T. 2012, SoPh, 281, 137
10