Hindawi Publishing Corporation International Journal of Distributed Sensor Networks Volume 2014, Article ID 870792, 7 pages http://dx.doi.org/10.1155/2014/870792
Research Article The Degree-Constrained Adaptive Algorithm Based on the Data Aggregation Tree Xiaogang Qi,1 Zhaohui Zhang,1 Lifang Liu,2 and Mande Xie3 1
School of Mathematics and Statistics, Xidian University, Xi’an 710071, China School of Computer Science and Technology, Xidian University, Xi’an 710071, China 3 College of Computer and Information Engineering, Zhejiang Gongshang University, Hangzhou 310018, China 2
Correspondence should be addressed to Mande Xie;
[email protected] Received 29 September 2013; Accepted 25 January 2014; Published 27 February 2014 Academic Editor: Ying-Hong Wang Copyright © 2014 Xiaogang Qi et al. This is an open access article distributed under the Creative Commons Attribution License, which permits unrestricted use, distribution, and reproduction in any medium, provided the original work is properly cited. In the PEDAP algorithm, a minimum spanning tree considering the energy consumption is established based on the Kruskal algorithm, and updated every 100 rounds. There exists a defect that the energy of some nodes rapidly expires because the degrees of nodes differ significantly, and the delay time is not considered. Based on the above analysis, a new algorithm called DADAT (a Degree-based Adaptive algorithm for Data Aggregation Tree) is proposed. The energy consumption and the delay time are both considered, and a weight model to construct a minimum spanning tree is established. Furthermore, the node degree on the tree is readjusted according to the average degree of the network, and nodes are labeled by red, yellow, and green colors according to their remaining energy; the child nodes of the red nodes are adaptively transferred to their neighbor nodes which are labeled as green. Finally, we discuss the weight and the update rounds’ impact on the network lifetime. Experimental results show that the algorithm can effectively balance the energy consumption and prolong the lifetime of the network, as well as achieving a lower latency.
1. Introduction With the development of wireless communication technology, more and more high-performance, low-cost products are widely used and this significantly promotes the progress of the wireless sensor networks (WSNs). Wireless sensor networks are composed by a large number of stationary or mobile sensors. Its widely used in national defense, environmental monitoring, traffic management, biomedicine, disaster monitoring, manufacturing, gas turbine engine testing, and other fields [1, 2]. Wireless sensor nodes have the characteristics of large number as well as small size, limited communications, and computing ability; the power of nodes’ battery is limited and cannot be charged. In addition, its initial energy is heterogeneous. Therefore, how to utilize energy effectively, to ensure effective data transmission and prolong the network lifetime, will be the key issues in the process of design the network algorithms or protocols. The sensor nodes in the monitoring region always send its information to sink node by the way of ad hoc network,
and the sink node is located at the centre or on the border of the network, so the other nodes must transmit data directly or indirectly to the sink node through single hop or multiple hops. Densely deployed sensor network for data collection and transmission contains large number of redundant data, but the node energy consumption in data process is far less than that in the data transmission. Accordingly, the data aggregation techniques to minimize the energy consumption of data transmission are necessary and helpful to reduce the amount of the transmission data and achieve efficient utilization of energy. The mediate nodes aggregate the received data based on aggregate functions, segment the aggregated data into fixed-size packets, and then transmit to the next hop node [3], and thus the redundant information and unnecessary energy consumption is reduced in communication process according to the data correlation. To solve the problem, the most common method is to build an aggregation tree rooted at the sink [4, 5], in which each mediate node aggregates the data from their children and the data their own sensing information into a fixed-size
2 packet and then sends to its parent node. As the tree is the minimal connectivity subgraph structure in a network, the tree-based data collection protocol would ensure network connectivity and reliability with guaranteed QoS effectively and easily implement efficient energy saving and so forth, and the tree-based schemes become a hot one currently. Typical tree-based data collection protocols include EDAET (an energy-aware distributed heuristic) [6], PEDAP (power efficient data gathering and aggregation protocol) [7], MNL (maximum network lifetime) [8], IAA (iterative approximation algorithm) [9], CNS (center at nearest source), SPT (shortest path tree), and GIT (greedy incremental tree) [10]. In practical applications, the amount of sensor nodes is great and the nodes are widely distributed, so the topology control and the data transmission are hard, and some distributed algorithms are difficult to be carried out considering the data aggregation. Sensor nodes independently select the data return path, the path formed by the intersection is random and cannot implement the effective aggregation of sensing data, so it can be further optimized. In addition, the source nodes have a large number of data packets sent to the sink in case of the network link failure; the time waiting data packet and the different data aggregation computing time lead to an increase in the network delay. In many real-time applications, especially in target tracking, medical care, fire monitoring, and structural health diagnosis, it requires the strict time limits for data packet transmission. Also, the outdated information may lead to a negative impact on detection system, and the data in complex delay-constrained network is required to be transmitted with priority to eliminate the queuing delay on the mediate nodes. Therefore, during the network algorithm design, we have to consider how to establish efficient routing strategies for data aggregation and reduce the energy consumption and network data transmission delay to ensure the real-time application requirements and prolong the network lifetime. Based on the above analysis, several key factors are considered in our scheme, such as the number of hops, residual energy, aggregation factor, and so on, and then a distributed algorithm based on the degree of adaptive dynamic aggregation tree (DADAT) is proposed. In DADAT, the weight of the node model is established, and then an aggregation tree rooted at the sink is built up based on the Kruskal’s greedy algorithm. In addition, the nonleaf node updates and maintains the tree according to the average degree and its own energy information and ensures a balanced use of energy in each round. The data packets are aggregated in nonleaf node based on aggregation strategy, and this can reduce the amount of data transmitted, so that the node energy is consumed in a more efficient way, and the network lifetime is prolonged and a lower latency is achieved.
International Journal of Distributed Sensor Networks to the sink node periodically. Sink node is on the edge of the monitoring region and is responsible for receiving collected data for analysis. The wireless sensor network topology can abstract into a two-dimensional plane undirected graph 𝐺(𝑉, 𝐸), where 𝑉 and 𝐸 represent the set of nodes and edges, respectively. 𝐸 ⊆ 𝑉 × 𝑉, |𝑉| = 𝑁, represents the number of nodes. The energy of each node initialization is 𝐸init ; the current residual energy is 𝐸current . In order to facilitate model analysis and describe WSNs’ topology, we make the following assumptions: (1) all nodes no longer move after deploying; (2) all nodes in the same structure and with the same initial energy and energy cannot be added; (3) each node has the same communication radius 𝑟; (4) all nodes know the network location information of all neighbors. 2.2. Communication Model 2.2.1. Energy Consumption of Communication. Our energy model is the same as what is described in the literature [11], the energy consumption of sending data and receiving data according to the wireless communication model is formulated, respectively, as follows, and 𝐸da is the energy consumption while aggregating 1 bit data: 𝐸𝑡𝑥 (𝑙, 𝑑) = 𝑙𝐸elec + 𝑙𝜀fs 𝑑2 , 𝐸𝑟𝑥 (𝑙) = 𝑙𝐸elec , 𝐸ag = 𝑙𝐸da , where 𝐸𝑡𝑥 (𝑙, 𝑑) is the energy consumption of receiving 𝑙 bit data, 𝐸𝑟𝑥 (𝑙) is the energy consumption of sending 𝑙 bits data, 𝐸elec is the energy consumption of wireless transceiver circuit in sending and receiving data, and 𝜀fs is the magnification of the signal amplifier power in the free-space model. 2.2.2. Communication Delay. To save energy, MAC layer communication protocol should work between the sleeping and listening modes. First, all nodes in the network are set in sleeping state, and some will switch to the listening mode when they are awakened and begin aggregating data while listening mode is completed. When the transmitting process is completed, these nodes will switch to sleeping mode again and continue to wait the beginning of the next listening period. Therefore, the delay for the node is calculated as Delay (𝑖) = 𝐷𝑠 (𝑖) + 𝐷𝑙 (𝑖) + 𝐷tr (𝑖) + 𝐷ag (𝑖) ,
2. Network and Communication Model 2.1. Network Model. Assume that 𝑁 sensor nodes are randomly deployed in the area of size 𝐿 ∗ 𝐿; the nodes send data
(1)
(2)
where 𝐷𝑠 (𝑖) is the 𝑖th node’s sleeping time, 𝐷𝑙 (𝑖) is the listening time, and 𝐷tr (𝑖) and 𝐷ag (𝑖) represent the time for the 𝑖th node’s transmitting and aggregating the data packets,
International Journal of Distributed Sensor Networks
3
respectively. The 𝐷tr (𝑖) and 𝐷ag (𝑖) are calculated according to the following formulas: 𝐷tr (𝑖) = 𝐷ag (𝑖) =
Packet(𝑖)numbef × Packetsize 𝐵 Packet (𝑖)numaft × Packetsize 𝜙
, (3) ,
where Packetnumbef and Packetnumaft are the number of data packets before and after aggregation for the node 𝑖, respectively, Packetsize is the size of a data packet, 𝐵 is the channel width, and 𝜙 represents the time aggregate unit packet. Accordingly, the average network delay is calculated as 𝐷=
1 𝑁 ∑Delay (𝑖) , 𝑁 1
(4)
where 𝐷 is the average network delay, Delay(𝑖) is the delay for the 𝑖th node, and 𝑁 is the number of the nodes. 2.2.3. Aggregation Strategy. In the PEDAP, the 𝑖th node aggregates its own originated packets and children’s data packets into a new data packet and then transfers it out. However, the sink node requires a certain amount of original data requirements in some networks [12], but the amount of data of a lot of nodes to the sink node is little based on above aggregation algorithm. This will result that the accuracy of the data cannot be guaranteed, so the original data from source nodes to the sink should be as much as possible. We assume that the parent of source node 𝑖 is 𝑗, the parent of node 𝑗 is 𝑘, and node 𝑘 is out of the communication radius of node 𝑖, so correlation between nodes 𝑖 and 𝑘 is relatively low, and we hope that a small amount of original data of node 𝑖 is aggregated and more of original data is reserved on node 𝑘. For example, there just exists 25 percent data originated from its child node 𝑖 on node 𝑘 while the amount of the data decreases by about 50% after each aggregation; the original information to sink node through multiple hops will be very little or almost all lost. So there exist fatal flaws for these types of data aggregation algorithms. To solve the above flaws, we redesign the aggregation policy as follows, and the definition of node aggregation coefficient 𝜌(𝑖) is calculated 𝜌 (𝑖) =
hop (𝑖) − 1 , hopmax
(5)
where hopmax is the maximum number of hops from leaf nodes to sink on its branch, and hop(𝑖) is the hop numbers from node 𝑖 to the sink. Therefore, there exists a relationship between the original data packet and the aggregated data packet for the node 𝑖 as listed in (6), where 𝜌(𝑖) is the data aggregation coefficient on node 𝑖. This is significant in the aggregation mode and leads to achieve a better data collection of accurate network information: Packet (𝑖)numaft = Packet(𝑖)numbef × (1 − 𝜌 (𝑖)) .
(6)
3. Data Aggregation Based Spanning Tree Algorithm In GIT algorithm, the distance between each pair nodes is taken into account to build a tree which starts from the sink node, and its performance is much better. However, it needs the global information and is difficult to be achieved in the distributed pattern. In PEDAP algorithm, it is a near optimal minimum spanning tree-based routing scheme, and the tree structure is updated for each 100 rounds. Because it does not take into account the residual energy of nodes, the minimal energy nodes are easily to be dead. PEDAP-PA uses the information about the residual energy of each node and considers the balance of energy consumption. 3.1. Weight Model. To solve the problem, we select the numbers of hops, the residual energy, and aggregation coefficient to redesign the data collection scheme to prolong the network’s survival time while ensuring data accuracy. The weight model is formulated as follows: 𝑊=
hoppre 𝐸(𝑖)current 1 ]. [𝛼 × + (1 − 𝛼) × 𝜌 hoppre (𝑖) 𝐸init
(7)
Based on (7) and (5), we have 𝑊=
hoppre hopmax 𝐸(𝑖)current + (1 − 𝛼) × ] [𝛼 × hop(𝑖)pre − 1 hoppre (𝑖) 𝐸init
=𝛼× ×
hopmax × hoppre (hop(𝑖)pre − 1) × hoppre (𝑖) hopmax × 𝐸(𝑖)current
(hop(𝑖)pre − 1) × 𝐸init
+ (1 − 𝛼)
, (8)
where hop(𝑖)pre represents the prehop of node 𝑖(hoppre (𝑖) = ⌈dist(𝑖, sin 𝑘)/𝑟⌉ + 1), dist(𝑖, sin 𝑘) is the distance from node 𝑖 to sink node. hopmax is the maximum of prehop, hoppre is the average prehop, 𝐸(𝑖)current is current energy, and 𝐸init is the initial energy. Because the network is homogeneous, here the initial energy of each node is 𝐸init . In Section 4, we will discuss the weight of 𝛼 in detail. 3.2. The Establishment of the Tree and Adaptive Maintenance. In Section 3.1, we create a weight model, establish a tree starting from the sink node, and select the maximum weight node to be added to the current tree until all nodes in the network are added to the tree, which is reconstructed after a certain number of rounds. In the process of establishing tree, we take into account the hops, residual energy, and amount of data, but the load of the node cannot be balanced. Some nodes have more children while others have few; this may lead to sharp energy consumption on some nodes. To solve this subproblem, we have to reorganize some nodes in the network. First, we compute the average degree of nonleaf nodes and let the
4
International Journal of Distributed Sensor Networks Sink
Sink
9
9
1
Begin
Establishment of tree
1
2
6
2
6 5
3
4
8
7
5
3
4
7
8
Adjust the node’s degree based on load
Figure 1: The node transfer operation.
Sink
Sink
1
1
2
3
2
4
5
11 6
7
8 (a)
9
10
Adjust the node’s degree based on the node residual energy
Node dies?
3
No
4
5
11 6
7
8
9
Yes
10
After a certain number of rounds
(b)
End
Figure 2: The transfer diagram among red nodes, yellow nodes, and green nodes.
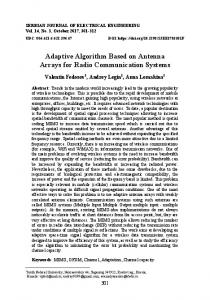
degree of other nodes approach the average degree of nonleaf nodes. For example, in Figure 1, the average degree of nonleaf nodes is 2.3 and the degree of node 1 is 4, which may lead to rapid energy consumption on node 1, and we introduce the node transfer operation to reduce the energy consumption. For node 3, its current parent is node 1, and its neighbor’s parent is node 2 whose degree is 2 and less than the average degree of nonleaf nodes, so node 2 may be a potential parent for node 3. If we let node 3 be a child of node 2, the energy consumption of the network should be well balanced, and thus the network’s lifetime is prolonged. According to the above method, some nodes consume more energy than others do in the network because the nodes in different layers consume energy differently. When the residual energy of these nodes is not enough to meet the energy requirements of the transmission of data, this will result in the loss of the data packets. To solve this problem, we can transfer the children of these nodes to the node with more residual energy in the same layer to prolong the lifetime of the network. The node is labeled in red color if the node’s residual energy is less than a given value 𝐸low , the node is labeled in green color if its residual energy is more than another certain value 𝐸high , and the remaining nodes are to be set in yellow color. In Figure 2(a), node 3 is a red node, node 4 is a yellow node, others are green nodes, and node 3 will die soon if the network topology control does not change in time. For node 3, node 2 and node 4 become the potential parents for the children of node 3. It is noted that node 4 is yellow already but node 2 is green, so node 2 becomes the parent of node
Figure 3: Algorithm flowchart.
6. Therefore, this can well balance the energy consumption for node 3 and its neighbor nodes and prolong the network’s lifetime. Such a tree is adaptively revised based on average degree to make the tree maintain a better structure. It is helpful to prolong the network lifetime while ensuring the data latency and data volume requirements. Algorithm for the specific process is listed as follows. Step 1. Set sink as the root, then apply the Kruskal greedy algorithm, select the node which has the largest value based on formula 11, and join the tree firstly; turn to Step 2. Step 2. Calculate the average degree of nonleaf node, transfer the node based on it average degree of the node, and then calculate the degree of each node, turn to Step 3. Step 3. Calculate the residual energy of each node; if the number of dead nodes reached a certain number, the algorithm stops; otherwise divide all nodes according to the residual energy into red, yellow, and green nodes. And then transfer the red node’s children to the green nodes in the same layer, and calculate the degree of each node; turn to Step 4. Step 4. When the number of rounds to meet certain conditions, turn to Step 1, rebuild the new aggregation tree, or turn to Step 2. And the algorithm flowchart is shown as in Figure 3.
International Journal of Distributed Sensor Networks
5
Table 1: Experimental parameters. Value 300 m × 300 m 300 32 (0, 0), (150.150) 50 10 0.0013 5 1000 2 250 kbps 200 kbps
5500 Network lifetime
5000 4000 3000 2000 1000 50
60
70
80
90 100 Fresh times
110
120
130
140
Figure 5: The relationship between update numbers and lifetime.
6000
round number is optimized. Therefore, nodes in the same layer almost consume the same energy in each round and die almost in the same time, and no node is to be the bottleneck node to influence the transmission performance of the network. However, PEDAP and PEDAP-PA algorithms establish the tree under the condition of energy efficience because some nodes in the tree die due to its high degree. After GIT builds the tree, it can be further optimized because there do not exist maintenance operations.
5000
4500
4000
3500 0.2
6000
Network lifetime
Parameter Network distribution field Node number Sensing range (m) BS position 𝐸fs (nJ/b) 𝜀fs (pJ/b/m2 ) 𝜀mp (pJ/b/m4 ) 𝐸da (nJ/b/m2 ) Data packet size (bits) Initial energy (J) Channel width Second aggregation data numbers
7000
0.3
0.4
0.5 0.6 Weight factor
0.7
0.8
Figure 4: The relationship between weight and lifetime.
4. Experimental Analysis 4.1. Experimental Environment. Some algorithm parameter values are listed in Table 1. To determine the weight factor 𝑎, we have to analyze the number of rounds when the first node dies. As shown in Figure 4, DADAT has a longest network lifetime when 𝑎 = 0.5, so we take 𝑎 = 0.5. In Section 4.3, we find the updating round numbers for PEDAP and PEADAPPA algorithm which is 100, and it is too empirical to solve the problem. So we have to simulate for the optimal update numbers, and the results are shown in Figure 5, and the better updating round numbers is 90 which is adopted in our algorithm. 4.2. The Survival Node Numbers of the Network. In this section, we compare the algorithm performance among GIT, PEDAP, PEDAP-PA, and DADAT. Figure 6 shows the comparison of four algorithms with the survival node numbers in the same round. We find that DADAT can prolong the lifetime of the network, because DADAT in the establishment of a tree adopts the adaptive revision and the updating
4.3. Network Delay. Figure 7 shows the network delay comparison among GIT, PEDAP, PEDAP-PA, and DADAT algorithms under the different networks scale. As shown in Figure 7, DADAT achieves a minimal delay because DADAT algorithm takes into account the number of hops to be the delay factor while the other three algorithms do not consider the distance factor and the node residual energy. However, the other three algorithms did not consider this factor of the number of hops, so it leads to the network average delay being too large. 4.4. The Energy Consumption. We compare the energy consumption of the four algorithms: GIT, PEDAP, PEDAP-PA, and DADAT. As shown in Figure 8, we can see that the trend of energy consumption is similar because they are all based on the minimum spanning tree topology. However, DADAT has minimum energy consumption than others; this because it is based on energy-aware simultaneously maintenance tree operations. The GIT only considers the distance factor, but the energy consumption and the updating tree operation are absent, so the tree has maximum energy consumption. The PEDAP-AP algorithm considers the node residual energy; therefore PEDAP-PA algorithm’s energy consumption is less than GIT and PEDAP, but PEDAP-PA does not frequently adopt the adaptive tree maintenance, so it is not as effective as DADAT. In addition, we can conclude that our algorithm has good scalability from Figure 6 to Figure 8; also it displays some
6
International Journal of Distributed Sensor Networks 22.4
290
22.2 Average delay of the network (ms)
300
Number of alive nodes
280 270 260 250 240 230 220 210 0.4
0.6
0.8
1
1.2
1.4 1.6 Rounds
1.8
2
2.2
22 21.8 21.6 21.4 21.2 21 20.8 20.6 200
2.4 ×10⁴
450
500
450
500
PEDAP-PA DADAT
(a) Scenario 1. Sink in the center
(a) Scenario 1. Sink in the center
22.2
300 Average delay of the network (ms)
290 280 Number of alive nodes
300 350 400 Numbers of the nodes
GIT PEDAP
PEDAP GIT
DADAT PEDAP-PA
250
270 260 250 240 230
22 21.8 21.6 21.4 21.2
220 210
0.4
0.6
0.8
DADAT PEDAP-PA
1
1.2 1.4 1.6 Rounds
1.8
2
2.2 2.4 ×10⁴
PEDAP GIT
(b) Scenario 2. Sink at the edge
Figure 6: The relationship between the number of rounds and survival node numbers.
good properties in different scenarios (sink node is located both in the center and on the edge).
5. Conclusion In this paper, data collection problem is studied. We consider the number of hops, the residual energy, and aggregation factor, and then a distributed dynamic aggregation tree algorithm based on constrained-degree is established. The degree of nodes in the tree can be adjusted according to the average degree of the tree, and then all nodes are labeled by red, yellow, and green colors according to their remaining energy; red nodes can transfer their child nodes adaptively.
21 200
250
300 350 400 Numbers of the nodes
GIT PEDAP
PEDAP-PA DADAT
(b) Scenario 2. Sink at the edge
Figure 7: The delay under different node numbers.
We finally discuss the weight and the updating rounds’ impact on the network lifetime. The simulation results show that our proposed approaches can effectively balance the energy consumption, prolong the network lifetime, and result in a lower latency. In the next work we will consider heterogeneous data aggregation in wireless sensor networks, while meeting the QoS requirements of a boundary [13].
Conflict of Interests The authors declare that there is no conflict of interests regarding the publication of this paper.
International Journal of Distributed Sensor Networks
7
Average energy consumption of the network
2
1.8 1.6 1.4 1.2 1 0.8 0.6 0.4 0.2 0
0.5
0
1
1.5
2
2.5 ×10⁴
Rounds PEDAP GIT
PEDAP-PA DADAT
(a) Scenario 1. Sink in the center
Average energy consumption of the network
2
1.8 1.6 1.4 1.2 1 0.8 0.6 0.4 0.2 0
0.5
0
1
1.5 Rounds
PEDAP-PA DADAT
2
2.5 ×10⁴
PEDAP GIT
(b) Scenario 2. Sink at the edge
Figure 8: The residual energy of different algorithm.
Acknowledgments This project is supported by the National Natural Science Foundation of China (Grants nos. 60703118, 71271165, and 61373174), the Open Research Funds of CEMEE (Grants nos. CEMEE20120207B and CEMEE20140302A), and Zhejiang Province Research Funds (2010R50041 and 2011C14024).
References [1] K. Kucuk, A. Kavak, H. Yigit, and C. Ozdemir, “A novel localization technique for wireless sensor networks using adaptive antenna arrays,” in Proceedings of the IEEE Radio and Wireless Symposium, pp. 483–486, Orlando, Fla, USA, 2008.
[2] P. Kułakowski, J. Vales-Alonso, E. Egea-L´opez, W. Ludwin, and J. Garc´ıa-Haro, “Angle-of-arrival localization based on antenna arrays for wireless sensor networks,” Computers and Electrical Engineering, vol. 36, no. 6, pp. 1181–1186, 2010. [3] E. Fasolo, M. Rossi, J. Widmer, and M. Zorzi, “In-network aggregation techniques for wireless sensor networks: a survey,” IEEE Wireless Communications, vol. 14, no. 2, pp. 70–87, 2007. [4] P. Wan, S. C. Huang, L. Wang, Z. Wan, and X. Jia, “Minimumlatency aggregation scheduling in multihop wireless networks,” in Proceedings of the 10th ACM International Symposium on Mobile Ad Hoc Networking and Computing (MobiHoc ’09), pp. 185–193, 2009. [5] J. Zhang, Q. Wu, F. Ren, T. He, and C. Lin, “Effective data aggregation supported by dynamic routing in wireless sensor networks,” in Proceedings of the IEEE International Conference on Communications (ICC ’10), pp. 1–6, Cape Town, South Africa, 2010. [6] M. Ding, X. Cheng, and G. Xue, “Aggregation tree construction in sensor networks,” in Proceedings of the IEEE 58th Vehicular Technology Conference (VTC ’03), vol. 4, pp. 2168–2172, Orlando, Fla, USA, 2003. ¨ Tan and I. K¨orpeoˇglu, “Power efficient data gathering and [7] H. O. aggregation in wireless sensor networks,” SIGMOD Record, vol. 32, no. 4, pp. 66–71, 2003. [8] W. Liang and Y. Liu, “Online data gathering for maximizing network lifetime in sensor networks,” IEEE Transactions on Mobile Computing, vol. 6, no. 1, pp. 2–11, 2007. [9] Y. Wu, S. Fahmy, and N. B. Shroff, “On the construction of a maximum-lifetime data gathering tree in sensor networks: NPcompleteness and approximation algorithm,” in Proceedings of the 27th IEEE Communications Society Conference on Computer Communications (INFOCOM ’08), pp. 356–360, Washington, DC, USA, 2008. [10] B. Krishnamachari, D. Estrin, and S. Wicher, “Modelling datacentric routing in wireless sensor networks,” in Proceedings of the 21st IEEE Conference on Computer Communications (INFOCOM ’02), pp. 1–11, 2002. [11] X. Qi, Z. Zhang, and F. Han, “A novel clustering and routing algorithm for wireless sensor networks,” International Journal of Advancements in Computing Technology, vol. 3, no. 9, pp. 114– 121, 2011. [12] M. H. Yeganeh, H. Yousefi, N. Alinaghipour, and A. Movaghar, “RDAG: a structure-free real-time data aggregation protocol for wireless sensor networks,” in Proceedings of the 17th IEEE International Conference on Embedded and Real-Time Computing Systems and Applications (RTCSA ’11), pp. 51–60, Toyama, Japan, 2011. [13] D. Zhang, C.-P. Zhao, Y.-P. Liang, and Z.-J. Liu, “A new medium access control protocol based on perceived data reliability and spatial correlation in wireless sensor network,” Computers and Electrical Engineering, vol. 38, no. 3, pp. 694–702, 2012.
International Journal of
Rotating Machinery
Engineering Journal of
Hindawi Publishing Corporation http://www.hindawi.com
Volume 2014
The Scientific World Journal Hindawi Publishing Corporation http://www.hindawi.com
Volume 2014
International Journal of
Distributed Sensor Networks
Journal of
Sensors Hindawi Publishing Corporation http://www.hindawi.com
Volume 2014
Hindawi Publishing Corporation http://www.hindawi.com
Volume 2014
Hindawi Publishing Corporation http://www.hindawi.com
Volume 2014
Journal of
Control Science and Engineering
Advances in
Civil Engineering Hindawi Publishing Corporation http://www.hindawi.com
Hindawi Publishing Corporation http://www.hindawi.com
Volume 2014
Volume 2014
Submit your manuscripts at http://www.hindawi.com Journal of
Journal of
Electrical and Computer Engineering
Robotics Hindawi Publishing Corporation http://www.hindawi.com
Hindawi Publishing Corporation http://www.hindawi.com
Volume 2014
Volume 2014
VLSI Design Advances in OptoElectronics
International Journal of
Navigation and Observation Hindawi Publishing Corporation http://www.hindawi.com
Volume 2014
Hindawi Publishing Corporation http://www.hindawi.com
Hindawi Publishing Corporation http://www.hindawi.com
Chemical Engineering Hindawi Publishing Corporation http://www.hindawi.com
Volume 2014
Volume 2014
Active and Passive Electronic Components
Antennas and Propagation Hindawi Publishing Corporation http://www.hindawi.com
Aerospace Engineering
Hindawi Publishing Corporation http://www.hindawi.com
Volume 2014
Hindawi Publishing Corporation http://www.hindawi.com
Volume 2014
Volume 2014
International Journal of
International Journal of
International Journal of
Modelling & Simulation in Engineering
Volume 2014
Hindawi Publishing Corporation http://www.hindawi.com
Volume 2014
Shock and Vibration Hindawi Publishing Corporation http://www.hindawi.com
Volume 2014
Advances in
Acoustics and Vibration Hindawi Publishing Corporation http://www.hindawi.com
Volume 2014