The Effect of Respiration-Induced Heart Movements on the ECG. RAMON PALLAS-ARENY, SENIOR MEMBER, IEEE, JOSEP COLOMINAS-BALAGUE,.
sns
IEEE TRANSACTIONS ON BIOMEDICAL ENGINEERING. VOL. 36, NO. 6, JUNE 1989
The Effect of Respiration-Induced Heart Movements on the ECG RAMON PALLAS-ARENY,
SENIOR MEMBER, IEEE, JOSEP COLOMINAS-BALAGUE, STUDENT MEMBER, IEEE, AND F. JAVIER ROSELL, STUDENT MEMBER, IEEE
Abstruct-We present a model describing the rotation of the cardiac vector as a possible mechanism resulting in the presence of respiratory information in the ECG. The way in which this information is revealed is analyzed and the predictions subjected to qualitative experimental assessment via spectral analysis. The results show that respiratory frequencies occur in the ECG spectrum due to heart movement. By measuring on a patient wearing a pacemaker and ventilated to control respiratory rate we show that even in the absence of respiratory sinus arrhythmia (RSA) there is a baseband information in the ECG spectrum, attributable neither to electrode artifacts nor to emg, and sidebands from the respiratory cycle.
I. INTRODUCTION HE ECG has been considered a respiratory information-carrying signal by some authors, mostly because of respiratory sinus arrhythmia (RSA) [ 11. But given the proximity between lungs and heart, the measurements carried out in the respiratory and cardiovascular systems are also subjected to the physical influences of the other. When recording the ECG, for example, efforts are usually made to reduce these interactions or their consequences. On the other hand, when analyzing heart rate variability spectral methods are normally used without taking into account any respiratory effect other than RSA. Some authors analyze the cardiac rate signal [2], but others ana[5]. lyze the ECG [3] or the pulse wave [4], We present a model describing how a rotation of the cardiac vector introduces respiratory information into the ECG. After considering the effects of respiratory sinus arrhythmia (RSA), the results obtained in the qualitative experimental assessment of this model are also discussed. Our aim is to show that heart movements produce respiratory frequencies in the ECG spectrum similar to those resulting from RSA.
attributed to these movements and to respiratory-induced cardiac rhythm variations. These effects were most noticeable in the standard I1 lead. Nowadays it is a wellknown fact that respiratory action produces a rotation of the cardiac vector and the effect by the respiratory sinus arrhythmia on the ECG signal is also well known. In order to describe the result of this interaction, a first step is to consider the projection of the cardiac vector on the frontal plane and a rotation round an axis perpendicular to it. If the inclination of the cardiac vector with respect to lead I is a,the voltage measured on this lead, for example, will be
T
ON 11. EFFECTSOF RESPIRATION
THE
FRONTAL ECG
The effects on the ECG of heart displacements produced by respiratory movements were first systematically analyzed by Einthoven et al. [6]. In this classic paper, most of the changes in ECG amplitude and waveform were
v, = Vcos a.
If the ECG is considered to be a periodic signal and if, at an initial stage, the periodic rotation produced by respiration is assumed to be sinusoidal, V, can then be expressed as
v, = ( c v, cos (nw,t + +,,) *
(COS
)
(ao + Aa cos U?))
(2)
where w, is the cardiac pulsation, w, is the respiratory pulsation, and A a is the maximum angular displacement caused by the respiratory action. The second cosine term for (2) can be expressed as a product of circular functions COS
(ao
+ A a COS U?)
=
COS a0
-
*
COS
( A a COS
U$)
sin a. . sin ( A a cos U?).
(3) Whenever A a c< a/2, the sine and cosine functions can be approximated by the first terms of their series development. In our case-and according to Ruttkay-Nedecky [7] and Beswick and Jordan [8]-Aa = 10" is an acceptable value. Therefore we have cos ( A a cos
Manuscript received December 28, 1987; revised October 17, 1988. This work was supported in part by the Comision Asesora de Investigacion Cientifica y Tecnica Project 2671-83. The authors are with the Division de Instrumentacion y Bioingenieria, Departamento de Ingenieria Electronica, 08080 Barcelona, Spain. IEEE Log Number 8826259.
(1)
UJ)
= 1
-
sin ( A a cos w j ) = Aa
cos U?.
(5)
By substituting (4)and ( 5 ) in (3), and if second-order terms in A a are considered small enough to be disre-
0018-9294/89/0600-0585$01.OO 0 1989 IEEE
586
IEEE TRANSACTIONS ON BIOMEDICAL ENGINEERING. VOL. 36. NO. 6. J U N E 19x9
garded, the result is
piratory-induced variation of the cardiac rhythm should be revealed by the presence in the ECG of the respiratory v, = (cos (Yo) n v,, cos (nu,t an) rhythm and its harmonics. In a rather different work [ 111, Rompelman et al. studied the amplitude spectrum of an event series whose frequency depended on a modulating periodic signal. This cos ((nu, u r ) t an)). ( 6 ) spectrum included components proportional to the correThe interpretation is now a simple one. As a conse- sponding components of the modulating signal and the quence of the periodic rotation of the cardiac vector, the harmonics of the unmodulated pulse repetition frequency, spectrum of the resulting signal consists of the initial one accompanied by sum and difference components of this plus a set of lateral bands at each side of the cardiac har- frequency and that of the modulating signal. monics located at a distance determined by the respiratory Thus, in the case of a respiratory sinus arrhythmia, a frequency. If the ECG has a direct component ( n = 0), spectral analysis of the ECG should reveal a baseband the movement described by the cardiac vector appears as content determined by the respiratory frequency and its a baseband signal. Depending on the frequency response harmonics, and lateral bands at each side of the cardiac of the electrocardiograph, this component will undergo a frequency and its harmonics, located at a distance determore or less pronounced attenuation. mined by the respiratory rhythm. The respiratory-induced movement is probably not sinThe measurements carried out in a normal situation are usoidal and the analytical expression of the real ECG subject to the variability of the respiratory rhythm itself. spectrum will thus be more involved. One clue to it is Its effect on the ECG spectrum through its influence on obtained by considering that the “distorted” ECG can be the cardiac rhythm will therefore be more complex than described by the product of two temporal functions, one is indicated by the above-mentioned analysis. In fact, associated with the respiration, the other with the cardiac Richardson et al. [3] showed that “in the case when the activity, in a manner similar to that indicated by (2). The fundamental frequency (of the ECG) is a random variable ECG spectrum can therefore be obtained by the convo- (frequency modulation) with a Gaussian distribution, the lution of the corresponding frequency spectra of the tem- comb structure of the power spectrum of the original peporal functions. The result can be interpreted as if the res- riodic model gets smoothed out, leaving a broadened bellpiratory signal had been sampled by the cardiac signal. shaped structure at each location of the tooth instead of a According to our simplified interpretation, the ECG spec- discrete impulse. trum will have a baseband information (respiratory signal) 111. EXPERIMENTAL RESULTSA N D DISCUSSION and a lateral band at each side of the cardiac rhythm and its harmonics. In other words, the result obtained for a The model we have derived in Section I1 suggests that sinusoidal rotation can be extended to other periodic ro- a spectral analysis of the ECG signal should include a tations. baseband content and sidebands on each cardiac harmonic The preceding model does not include the linear dis- determined by the respiration. placement of the cardiac vector. Using a theoretical ecIn order to verify, to a certain extent, whether heart centric spheres model, Rudy et al. [9] showed that an 1 movements result in the presence of respiratory informacm variation in the location of the heart produces a 24.2 tion in the ECG, we have carried out measurements. In percent variation in surface potential. This change in am- order to eliminate the foreseeable consequences of cardiac plitude will also have a repercussion on the ECG spec- rhythm variability, a patient wearing a pacemaker was setrum. Its effect can be analyzed by considering that the lected. Although it was a demand pacemaker, during the “distorted” ECG can again be described by the product recording there was no spontaneous cardiac activity, the of two temporal functions. The spectrum, therefore, will cardiac rhythm thus being well known (2.05 Hz). For be similar to that described above. better identification of the presence of respiratory inforOne way of checking whether or not the modulation mation, we decided to measure on a patient who at the described by (6) in fact takes place is by means of ECG same time was undergoing artificial ventilation. The resspectral analysis. Yet in doing so, other factors producing piratory frequency had been set at 0.3 Hz. spectral modulation must be taken into account. One of The ECG was recorded using a magnetic recorder conthese factors is the variability of the cardiac rhythm, in nected to a Cardioline electrocardiograph, model eta 150. particular as a result of respiration. The electrodes for the standard leads were placed at the In [lo] a method is described for enhancing the infra- extremities so that there were no respiratory-induced cardiac frequency content of cardiovascular signals, in movements, and no diaphragm emg. The signal was anaparticular pulse and flow. This consists of a frequency lyzed off-line using a Hewlett Packard 3582A Spectrum modulation of the cardiac rhythm by a periodic signal of Analyzer. lower frequency. They show that the new spectral comFor the standard I11 lead, which amplitude was interponents are those of the modulating signal. Thus, a res- mediate with respect to those of leads I and 11, the spec-
c
-
*
+
+
”
PALLAS-ARENY et
U/.:
EFFECT OF HEART MOVEMENTS O N THE ECG
-10 d8V
-20
-30
E
E88
-40
-50
-60
-70
-80
-90 0.00
0.25
0.50
0.75
1.00
1.25
1.50
1.75
2.00
2-25
2 . 5 0 ~ ~
10.0
10.5H-z
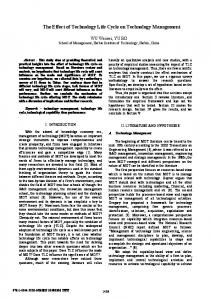
Fig. 1 . Spectrum of the ECG signal (lead III), from 0 to 2.5 Hz, showing the respiratory baseband (0.3-1.8 H z ) and lateral components ( 1.45, 1.75, and 2.35 Hz). The patient was paced at 2.05 Hz and placed in a ventilator set at 18 respirations/min. Frequency resolution was 0.01 Hz.
-10 ._
5.5
6.0
6.5
7.0
7.5
8.0
8.5
9.0
9.5
Fig. 2 . Lateral bands at each side of the fourth harmonic (8.20 H z ) for the same signal analyzed in Fig. 1. Three components related to respiration can be identified at each side of that harmonic. Similar bands at each side of the third and fifth harmonic are present. Frequency resolution was 0.02 Hz.
trum shown in Fig. 1 was obtained in the band from 0 to 2.5 Hz, using a Hanning window. Leads I and I1 showed the same bands with different amplitudes. The presence of respiration harmonics from 0.3 to 1.8 Hz is apparent. The components at 1.75 and 2.35 Hz are located at 0.3
Hz from the cardiac rhythm (2.05 H z ) and there is also a component at 1.45 Hz; that is to say, at 0.6 Hz below this rhythm. This is completely in accordance with (6). The presence of lateral bands at each side of the cardiac harmonics can be better assessed by an analysis of the
588
IEEE TRANSACTIONS ON BIOMEDICAL ENGINEERING. VOL. 36. NO. 6. JUNE 19x9
0 dBV
-10
-20
-30
-40
-50
-60 1
-70
-80
I"
J
0.00
4
0.25
0.50
0.75
1.00
1.25
1.50
1.75
2.00
2.25
2 . 5 0 Hz
Fig. 3. Spectrum of the ECG signal (lead 111). from 0 to 2.5 Hz, for a normal adult. The predominant respiratory and cardiac frequencies were, respectively, 0.39 and 0.96 Hz. The component of 2.5 Hz is the lower respiratory-induced sideband of the third cardiac harmonic. Frequency resolution was 0.01 Hz.
0 dBV
-10
-20 0.86
1.82
-30
6 4. E4
9
-40
4.94
-50
-60
-70
-a0 0.5
1.0
1.5
2.0
2.5
3.0
3.5
4.0
4.5
5.0
5.5Hz
Fig. 4. Lateral bands at each side of the cardiac harmonics from 0.5 to 5.5 Hz for the same signal analized in Fig. 3 . All prominent sidebands correspond to infrarespiratory frequencies. Frequency resolution was 0.02 Hz.
frequency components with higher amplitude. A scanning of the entire spectrum showed that the fourth harmonic was the most suitable one. The spectrum obtained in the
band from 5.5 to 10.5 Hz for the very same signal whose baseband is the one shown in Fig. 1 is presented in Fig. 2. The presence of bands at each side of the 8 . 2 Hz com-
PALLAS-ARENY
et
589
al.: EFFECT OF HEART MOVEMENTS ON THE ECG
ponent, placed at 0.3,0.6, and 0.9 Hz apart is quite clear. Similar bands can be seen at each side of the 6.15 and 10.25 Hz components of the ECG. There is a complete frequency symmetry, as predicted by (6). The cardiac rhythm being constant, the presence of baseband information can in principle be attributed, at least in part, to the displacement of the heart vector. In any case, it is true that there is respiratory information in addition to that provided by the RSA, because in Figs. 1 and 2 the patient had a fixed pacing rhythm. Furthermore, even in the absence of RSA, the distortion of the ECG produced by the respiration is important if judged from the spectral analysis. The movement of the cardiac generator as described by our model can explain the presence of components in the spectrum of the ECG that are not harmonics of the cardiac rhythm. The spectrum for normals is complex on account of the variability in heart and respiratory rhythms. Fig. 3 shows the spectrum corresponding to lead I11 in a healthy subject. Certain sidebands related to the main respiratory component of 0.39 Hz can be measured on either side of some cardiac harmonics. The band at 2.5 Hz corresponds to 3 X 0.96-0.38 Hz, that is to say, the lower respiratory band from the third cardiac harmonic (shown in Fig. 4 at 2.86 f 0.02 Hz). When comparing with Fig. 1, it can be noted that in Fig. 3 there are some sidebands in addition to the respiratory ones. Also that the respiratory rhythm itself produces a broad band-around 0.39 Hz-because of its own variability. In Fig. 3, therefore, it is impossible to say whether the bands produced by the respiration are due to heart movements or to RSA. Fig. 4 shows the spectrum from 0.5 to 5.5 Hz for the same ECG signal analized in Fig. 3. Now it is even difficult to identify respiratory-induced sidebands similar to those in Fig. 2. By contrast, some components placed at 0.8 to 0.12 Hz from the cardiac harmonics can clearly be distinguished. According to the model by Rompelman et al. [3] these bands can be linked to heart rate variability. But, according to the same model, the presence of bands from 0.8 to 0.12 Hz in Fig. 3 can either be a result of heart rate or respiratory rate variability. IV. CONCLUSIONS By using a simple model we have shown how heart displacement can result in the presence of respiratory information in the ECG. Some easily recognizable effects of this interaction are a presence of a baseband and lateral bands at each side of the cardiac harmonics in the ECG spectrum. The description of the consequences of these interactions brings new information which is useful when analyzing the ECG signal. For example, the experimental results indicate that a spectral analysis of the ECG signal intended to study the respiratory sinus arrhythmia [5] may lead to the wrong
conclusions because the mechanical action of the respiration on the ECG results in the same kind of frequency bands as those of the RSA. From a different point of view, it can also be concluded that just as signals modulating the cardiac rhythm reveal themselves in the ECG spectrum as baseband components, signals modulating the respiratory rhythm should also be apparent in the same spectrum. Therefore, whepever the respiratory frequency is not constant, an analysis of the presence of infrarespiratory components in the spectrum of the ECG, or, for that matter, of any other cardiovascular signal, should take this effect into account. Finally, if a mechanical interaction between the respiratory activity and arterial pressure is considered, the results discussed above for the spectrum of the ECG can also be applied to the pulse wave. Kitney et al. [ 5 ] observed that a respiratory component was present within the blood pressure signal despite fixed rate cardiac pacing. By applying our results, their observation has a straightforward explanation. ACKNOWLEDGMENT
The authors are deeply indebted to Dr. A. M. Mufioz, Head of Cardiology at the Hospital General Nuestra Sra. del Mar in Barcelona for his advice, help, and encouragement during the experimental part of this work. The authors appreciate many useful comments and suggestions made by two anonymous reviewers.
REFERENCES [I] B. F. Womack, “The analysis of respiratoly sinus arrhythmia using spectral analysis and digital filtering,” lEEE Trans. Biomed. Eng. , vol. BME-18, pp. 399-409, 1971. [2] 0. Rompelman, J. B. I. M. Snijders, and C. J. Van Spronsen, “The measurement of heart rate variability with the help of a personal computer,” IEEE Trans. Biomed. Eng., vol. BME-29, pp. 503-510, 1982. 131 J. M. Richardson, V. K. Murthy, and L. J. Haywood, “Effect of random frequency modulation on ECG power spectra,” IEEE Trans. Biomed. Eng., vol. BME-26, pp. 109-112, 1979. [4] W. Craelius, V. K. H. Chen, M. Restivo, and N. El-Sherif, “Rhythm analysis of arterial blood pressure,” IEEE Trans. Biomed. Eng., vol. BME-33, pp. 1166-1172, 1986. [SI R. I. Kitney, T. Fulton, A. H. McDonald, and D. A. Linkens, “Transient interactions between blood pressure, respiration and heart rate in man,” J. Biomed. Eng., vol. 7 , pp. 217-224, 1985. [6] W. Einthoven, G. Fahr, and A. de Waart, “On the direction and manifest size of the variations of potential in the human heart and on the influence of the position of the heart on the form of the electrocardiogram,” Pfluger’s Arch. f.d . ges. Physiol., vol. 150, pp. 275315, 1913. English translation by H. E. Hoff and P. Sekelj, Amer. HearrJ., vol. 40, pp. 163-193, 1950. [7] I. Ruttkay-Nedeckf, “Effects of respiration and heart position on the cardiac electric field,” in The Theoretical Basis of Elecrrocardiography, C. V. Nelson and D. B. Geselowitz, Eds. Oxford: Clarendon Press, 1976, pp. 120-134. [8] F. W. Beswick and R. C. Jordan, “Effect of expiratory and inspiratory breath-holding on the lead-field spatial vectorcardiogram,” Amer. HeartJ., vol. 62, pp. 379-390, 1961. [9] Y. Rudy, R. Plonsey, and J. Liebman, “The effects of variations in conductivity and geometrical parameters on the electrocardiogram, using an eccentric spheres model,” Circ. Res., vol. 44, pp. 104-1 11.
590
IEEE TRANSACTIONS ON BIOMEDICAL ENGINEERING, VOL. 36, NO. 6. JUNE 1989
J. A. Ringo, K. B. Campbell, N. S . Peterson, and R. A. Baker, “Frequency modulation of heart rate to increase low-frequency content of cardiovascular signals,” IEEE Trans. Biomed. Eng., vol. BME-29, pp. 537-541, 1982.
Ram6n Pallis-Areny (M’81 -SM’88) received the degrees of Ingeniero Industrial and Doctor Ingeniero Industrial in 1975 and 1982, respectively, both from the Politechnic University of Catalonia, Barcelona, Spain. He is currently Professor of Bioengineering, Electronic Instrumentation and Transducers, and Head of the Instrumentation and Bioengineering Division of the Department of Electronic Engineering at the same University. His present research interests are high resolution ECG and physiological measurements based on electrical impedance methods. He is author of Basic Electronic Instruments (1987) and Transducers and Signal Conditionning (1989), and coauthor of An Introduction to Bioengineering (1988). all published in Spanish by Marcombo (Barcelona, Spain).
Josep Colominas-Balaguk ( S ’ 8 5 ) received the degree of Ingeniero de Telecomunicaci6n from the Politechnic University of Catalonia, Barcelona, Spain, in 1985. He is currently Assistant Professor at the Department of Electronic Engineering where he is working towards the Ph.D. degree. His major research interests are high resolution ECG and bioelectric signal processing.
F. Javier Rosell (S’84) received the degree of Ingeniero de Telecomunicaci6n from the Politechnic University of Catalonia, Barcelona, Spain, in 1983. He is currently Assistant Professor at the Department of Electronic Engineering where he is working towards the Ph.D. degree. His major research interest is physiological measurements based on electrical impedance methods, in particular electrical impedance imaging.