www.ccsenet.org/ijef
International Journal of Economics and Finance
Vol. 4, No. 2; February 2012
The Forecasting Power of the Volatility Index in Emerging Markets: Evidence from the Taiwan Stock Market Ming Jing Yang Department and Graduate Institute of Finance, Feng Chia University 100 Wenhwa Road, Seatwen, Taichung 407, Taiwan Tel: 886-4-2451-7250 ext.4158
E-mail:
[email protected]
Meng-Yi Liu (Corresponding author) College of Business, Feng Chia University, 100 Wenhwa Road, Seatwen, Taichung 407, Taiwan Tel: 886-4-2451-7250 ext.4459 Received: October 11, 2011 doi:10.5539/ijef.v4n2p217
E-mail:
[email protected]
Accepted: October 24, 2011
Published: February 1, 2012
URL: http://dx.doi.org/10.5539/ijef.v4n2p217
Abstract This paper explores the predictive power of the volatility index (VIX) in emerging markets from December 2006 to March 2010. The results of the study show that the models including both the volatility indicator and the option market information have a stronger predictive power. The predictive power of the models is improved by 88% in explaining the future volatility of stock markets, much better than that of other models merely considering the volatility indicator. With respect to the trading information from different types of investors in option markets, the trading information from the foreign institutional investors in option markets demonstrates a significantly positive relationship with the stock market volatility. In addition, the results of this paper also reveal that the volatility index (TVIX) of Taiwan stock index options is a strong indicator of future stock market volatility. The TVIX outperforms the historical volatility and the GARCH volatility forecast in assessing the activities of Taiwan’s stock market. Keywords: VIX, Investor fear gauge, Implied volatility, Volatility forecasting, Emerging markets 1. Introduction The volatility of financial markets usually demonstrates a continuous and clustering character (Poon and Granger, 2005) and has attracted widespread attention. The majority of researchers adopt the historical volatility, implied volatility, and time series volatility models to conduct different types of volatility prediction research. However, most of them fail to reach a consensus due to the fact that the market volatility has always been unpredictable. Thus, the optimal solution can be found if the model can achieve the least prediction error. In 1993, the Chicago Board Options Exchange (CBOE) launched a volatility index (VIX) based on the calculations of the S&P 100 stock index options. It provides more comprehensive information and the trading guidance to investors by means of observing the changes in the future volatility of the stock market. The volatility index has become the leading indicator for measuring and predicting the performance of stock markets in the U.S. since then. In 2003, the CBOE adjusted its volatility index by adopting the S&P 500 index options as the core criteria to provide traders and hedgers with more accurate figures by broadly analyzing the put and call option contracts of the S&P 500 index. After the CBOE launched a new version of the volatility index, it renamed the code of the old version of the volatility index from 1993 as VXO and retained the VIX for the new version, in order to make a difference. The new method is more practical than the former method in the real life scenarios. The VIX uses the current prices of the S&P 500 index options to reflect investors’ expectations regarding the stock market volatility over the next 30 days (Whaley, 2009). A higher VIX indicates that market traders are expecting a higher volatility in the stock index, while a lower VIX suggests that only a moderate fluctuation is expected in the stock index. As the VIX is meant to reflect investors’ expectations, it has also been referred to as “the investor fear gauge.” As the volatility index has attracted growing attention in recent years, the CBOE has also launched many different volatility indices based on other underlying targets, such as the NASDAQ-100 Volatility Index (VXN), the DJIA Volatility Index (VXD), the Russell 2000 Volatility Index (RVX), and the S&P 500 3-Month Volatility Index (VXV), etc. Nevertheless, the VIX still remains to be the most widely-used and discussed information indicator in security
Published by Canadian Center of Science and Education
217
www.ccsenet.org/ijef
International Journal of Economics and Finance
Vol. 4, No. 2; February 2012
markets. For example, in the 1998 LTCM and the 2002 WorldCom bankruptcy, the VIX rapidly increased to a level over 40. In the 2007 worldwide financial tsunami caused by the sub-prime mortgage crisis, the VIX even exceeded 80 when the Lehman Brothers filed for bankruptcy. Hence, the research conducted by Aboura and Villa (2003), Majmudar and Banerjee (2004), Corrado and Truong (2007), and Whaley (2009) indicates that the VIX serves as a powerful predictive indicator of the developed derivative markets. Meanwhile, exploring the predictive power and accuracy of different models and volatility indicators regarding the future stock market volatility has become one of the major topics in the field of risk management of financial markets in recent years. Poon and Granger (2003, 2005) reviewed 93 papers addressing the predictive performances of the volatility indicators over the last 20 years and pointed out that most papers suggest that the implied volatility generates the greatest predictive power, followed by the volatility measured by the GARCH family models and the historical volatility. Transactions of index options in Asia have grown rapidly in recent years. The trading volume of index options increased from 40 million contracts in 1998 to 3,057 million contracts in 2008, a 54% compound annual growth rate exceeding those in America and Europe. Taiwan Futures Exchange (TAIFEX) launched the Taiwan Stock Exchange capitalization weighted stock index (TAIEX) options in 2001, with the trading volume increasing very quickly and ranked the sixth place in the world financial markets in 2008, behind only Korea and India among the Asian countries (Note 1). Therefore, in this study, we intend to compare the predictive performance of the historical volatility, the implied volatility, the volatility index (TVIX) of Taiwan stock index options, and the GARCH volatility forecasts, regarding the future stock price movements in Taiwan. Besides, the valuable detailed trading information with respect to TAIEX options for different types of investors recorded in TAIFEX database is also included, such as the trading dates, investor codes, trading positions, put or call options, trading volumes, opening or closing positions, etc. Additionally, the put-call ratio introduced by Pan and Poteshman (2006) is also employed to analyze the impact of option market information on the volatility of an emerging stock market, namely the Taiwan stock market. According to the comparison of the empirical results with the models merely considering the volatility indicator, the predictive performance of the models that incorporate both the volatility indicator and option market information is improved substantially. (The adjusted R2 of the models is increased by 88%). Among all of the volatility indicators, the average implied volatility of put and call options has the greatest predictive power, followed by the implied volatility of the put options and the TVIX. The empirical results of this paper show that the predictive power of the TVIX remains fairly close to that of the implied volatility, irrespective of the models adopted. Its performance exceeds that of the implied volatility of the call options in some scenarios. The results are consistent with the findings of Majmudar and Banerjee (2004), Corrado and Truong (2007), and Whaley (2009). Therefore, the results of our study show that the VIX is a powerful predictive indicator for the stock market volatility in the emerging markets, as documented in Taiwan. Investors can thus make use of the volatility index to further understand the stock market movement and adjust their international portfolios accordingly. In addition, the information variables from option market in this research are divided into four components, which are constructed by the Put-Call ratios from four different types of investors trading in option market, including the foreign institutional investors, domestic institutional investors, individual investors, and market makers. The results of the study also reveal that the information flows from foreign institutional investors have significant predictive power in terms of future volatility of TAIEX spot index, as documented in Chang et al. (2010). 2. Background and Related Work In the 1987 U.S. stock market crash, the New York Stock Exchange (NYSE) launched the “Circuit Breakers” mechanism, which can manually suspend stock trading if stock prices fluctuate abnormally, in order to stabilize stock markets and protect investors. This mechanism has been used to reduce abnormal fluctuations in the stock market, stabilize market orders, and reassure investors since then. In 1993, the CBOE launched a volatility index to observe market volatility by using the prices of the most heavily-traded S&P 100 index options (OEX) (Note 2). In 2003, the CBOE adjusted its original volatility index and switched the measurement target to the S&P 500 index options in attempts to deliver the information for the stock market volatility over the next 30 trading days. Whaley (2009) pointed out that there are two important implications of promoting the VIX. First, the VIX can provide a criterion for measuring the short-term market volatility. Second, its related derivatives can also offer investors more choices, for instance, in investment portfolio management and risk management. Therefore, the CBOE launched futures and options based on the VIX in May 2004 and February 2006, respectively. The difference between the VXO and the VIX has been investigated extensively by academics, researchers, and investors. Mark (2003) indicated that the VIX is generally 3.8% lower than the VXO. The VIX and VXO have been shown to have similar analytical capabilities in predicting the future market volatility. Mayhew and Stivers (2003) studied the top 50 most heavily-traded options of the CBOE and demonstrated that the VXO contains more 218
ISSN 1916-971X
E-ISSN 1916-9728
www.ccsenet.org/ijef
International Journal of Economics and Finance
Vol. 4, No. 2; February 2012
information. However, no consensus was reached with respect to the lightly-traded options. Whaley (2000) analyzed the S&P 100 index and the VXO and suggested that the relation between stock market returns and VXO variation is asymmetric. Aboura and Villa (2003) analyzed and compared the volatility indices of the U.S. (VXO), France (VXI), and Germany (VDAX) and pointed out that the VXO, the VXI, and the VDAX are useful tools to predict the future volatility. Whaley (2009) studied the connection between the VIX and the stock markets and indicated that the movement trends in the VIX exhibits a rather powerful explanation for the change in the performance of S&P 500 index portfolio. Some other studies focused on the information content of VIX derivatives. Becket et al. (2009) and Chung et al. (2011) suggested that VIX options essentially possess the incremental information about the future dynamics of the S&P 500 index. The results of their studies show that the predictions of returns, volatility, and density in the S&P 500 index are improved significantly by using the information embedded in the VIX options for various measures of realized volatility. Chen et al. (2011) demonstrated that adding the VIX-related assets can enlarge the investor’s investment opportunity set. Daigler and Rossi (2006) and Szado (2009) reported that the potential diversification benefits of adding a long VIX and VIX futures to the base portfolio are significant. Although the VIX derivatives have achieved widespread recognition, it is still challenging on the pricing of VIX options and futures. Several studies have explored the pricing of VIX options and futures under various approaches (see Zhang and Zhu, 2006; Seep, 2008; Lin and Chang, 2009; Zhang et al., 2010; Wang and Daigler, 2011). In contrast to the studies of the theoretical models, Konstantinidi et al. (2008) and Konstantinidi and Skiadopoulos (2011) investigated the information efficiency of the VIX futures. Shu and Zhang (2011) suggested that although the VIX futures have some price-discovery function, overall the VIX futures market is still considered informationally efficient. Additionally, the prediction of market volatility has been a research focus in the fields of investment decisions and portfolio management. Day and Lewis (1992) and Canina and Figlewski (1993) conducted studies on S&P 100 index options and individual stock options and reported that the historical volatility is better than the implied volatility in predicting the future volatility of stock markets. However, the results of their studies may be attributed to the overlapping samples selected in the research and the maturity mismatches of the samples (Yu, Lui, and Wang, 2010). Christensen and Prabhala (1998) utilized the non-overlapping samples to restudy S&P 100 index options and documented that the implied volatility is superior to the historical volatility in predicting the future market volatility. Szakmary et al. (2003) explored 35 major futures and options markets in the U.S., and their findings corroborated the fact that the implied volatility predicts the future market volatility better than the historical volatility. Similar results were also found by Corrado and Miller (2005) and Carr and Wu (2006), who showed that the VIX outperforms the historical volatility and the volatility estimated from GARCH models in forecasting the S&P 500 index volatility. Yu et al. (2010) studied the exchanges and OTC markets in Hong Kong and Japan and concluded that the implied volatility is a better predictor of the future volatility in the exchanges and OTC markets than the GARCH volatility forecasts and the historical volatility. Poon and Granger (2003, 2005) reviewed the volatility prediction research papers of the past 20 years. In these papers, the implied volatility achieves the best predictive power, followed by the volatility from GARCH models, the historical volatility, and the volatility from stochastic models. The research discussed above mainly focused on the U.S. markets. After the CBOE launched the new volatility index in 2003, the findings of most empirical studies indicate that the VIX is an excellent predictor for the future volatility of well-developed security markets. Nowadays the international financial markets have become closely connected, and the empirical studies from other security markets outside the U.S. should also be performed, especially those from the emerging markets. For instance, Taiwan also constructed the volatility index of Taiwan stock index options in 2006. Thus, this study aims to fill a gap in the research by exploring the predictive power of the volatility index in one of the emerging markets, Taiwan. The calculation of the volatility index is performed independently of the derivative pricing models and entails a kind of forward-looking concept, which is different from the implied volatility derived from the option pricing model. Based on the research design of Corrado and Miller (2005) and Yu et al. (2010), the volatility index is first included in the analysis model of the study. Then, the information sets of options are further included, such as the trading volume for index options and for different types of investors, to examine the explanatory power of the volatility index in predicting the future volatility in the emerging stock markets. Finally, the empirical results of the study are also compared with those measured by the historical volatility, the implied volatility, and the volatility estimated from GARCH models. The findings of the study will provide investors with more comprehensive information about the future market volatility and thus improve their investment decisions and portfolio performance. 3. Methodology and Research Models 3.1 Data Source The data sources of our empirical study are stated as follows. (1) The daily data of the implied volatility, trading Published by Canadian Center of Science and Education
219
www.ccsenet.org/ijef
International Journal of Economics and Finance
Vol. 4, No. 2; February 2012
volume, and open interest of Taiwan stock index options are collected from the Taiwan Economic Journal database. (2) The valuable detailed transaction data of Taiwan stock index options for different types of investors are collected from TAIFEX database, including the trading dates, investor codes, trading positions, put or call options, trading volumes, opening or closing positions, etc. The volatility index (TVIX) of Taiwan stock index options and the trading information for the different types of investors in option markets are also provided by TAIFEX, including the foreign institutional investors, domestic institutional investors, individual investors, and market makers. This study analyzes the time period between December 1, 2006 and March 31, 2010, matching the period in which the TAIFEX aggressively promoted the volatility index. 3.2 The Research Models This study follows the methods of Alizadeh et al. (2002), Szakmary et al. (2003), Covrig and Low (2003), Chang et al. (2010), and Yu et al. (2010) in measuring the related volatilities and building the research models. The research methods of Ni et al. (2008) and Chang et al. (2010) are employed to measure the daily realized volatility of Taiwan stock market. As the volatility index and implied volatility are both annualized figures, this study also adopts the methods of Claessen and Mittnik (2002) and Yu et al. (2010) to annualize the volatility measures by using 250 trading days, so as to reconcile the data periods. The formulas for estimating the realized volatility and the historical volatility are listed below: H t Lt (1) 250 Ct H Lt i (2) 250 HVt t i C t i where ARVt and HVt are the realized volatility (annualized) and the historical volatility (annualized) of the TAIEX on ARV t
day t, respectively. H t and Lt are the highest and the lowest prices of daily TAIEX on day t, respectively. C t is the closing price of daily TAIEX on day t , and i is the lag length (i = 1, 5, 10, 20). In order to investigate whether the volatility index is an unbiased estimator of the future market volatility and whether the volatility index is better in predicting the future market volatility than the implied volatility, the historical volatility, and the GARCH forecast volatility, the research models are further built up as follows: ARV t a o a1 HV t i t
(3)
ARV t a o a 2 IV t i t
(4)
ARV t a o a 3TVIX t i t
(5)
ARV t ao a 4 GFV t i t
(6)
where TVIX t denotes the volatility index derived from the TAIEX options on day t. IV t is the implied volatility on day t. GFV t is the volatility forecast by the GARCH model on day t. The equations of Black-Scholes are used to inversely derive the annual volatility implied from the market prices of options. The implied volatility represents investors’ expectations of the future volatility of stock returns and helps investors determine whether the option prices are reasonable. The implied volatilities of put and call options may differ because of the differences in moneyness between the call and put options. To mitigate the problems in measuring the implied volatility, this research adopts three different measures of the implied volatility in our analysis, including the implied volatility of the (nearest) at-the-money call option (IV_C), put option (IV_P), and the averages of both (IV_A) with the shortest maturity (of at least five trading days) (Note 3). As the calculation procedures are quite complicated, this study uses the Newton-Raphson approximation method to measure the implied volatility. To avoid the observation errors generated by the implied volatility when it is an independent variable that may affect the results of regression, this study adopts the untransformed and the log-transformed data of the volatility measures, as in Corrado and Miller (2005). This study is designed primarily to test the predictive power of the volatility index in terms of the future market volatility in one of the emerging markets. The volatility index, constructed according to the new version of the CBOE VIX computation formulas in 2003, is based on a series of different exercise prices of the TAIEX options. Such a volatility index is not derived from any specific option pricing model, and its calculation is also irrelevant to any other option pricing models. Instead, it is derived from the weighted average of the put and call option premiums. In order to reconcile the volatility measures across different models, the volatility index (TVIX) used in this study is calculated as follows (Note 4).
220
ISSN 1916-971X
E-ISSN 1916-9728
www.ccsenet.org/ijef
International Journal of Economics and Finance
2
2 T
K i
K i
e RT Q( K i )
2 i
Vol. 4, No. 2; February 2012
1 F [ 1] 2 T K0
(7)
TVIX
(8)
where T refers to the time to expiration. F is the forward index level derived from the index option prices. Ki is the strike price of ith out-of-the-money option. Ki denotes the interval between two strike prices, measured by half the difference between the strike prices on either side of Ki. K for the lowest strike price is simply the difference between the lowest strike price and the next higher strike price. Likewise, K for the highest strike price is the difference between the highest strike price and the next lower strike price. K0 is the first strike price below the forward index level F. R is the risk-free interest rate to expiration. Q(Ki) is the midpoint of the bid-ask spread for each option with strike price Ki. The TVIX measures the 30-day expected volatility of the TAIEX. It uses the put and call options with the two nearest expiration terms (near-term and next-term). In order to minimize pricing anomalies that might occur close to expiration, the near-term options must have a maturity in excess of one week. When the near-term options have less than one week until expiration, the TVIX rolls to the second and third TAIEX options contract months. T is calculated in minutes rather than days in order to assure the precision. The time to expiration is calculated by the following formula:
T M Current
day
M Settlement
day
M Other
days
/ Minutes
in a year
where MCurrent day, MSettlement day and MOther days are the minutes remaining until midnight of the current day, the minutes from midnight until 8:30 a.m. on the settlement day of TAIEX options, and the total minutes in the days between the current day and the settlement day, respectively. Furthermore, Engle (1993) claimed that the conditional variance in the GARCH model is more effective in predicting the volatility of stock returns than the historical volatilty. Based on the methods proposed by Brailsford and Faff (1996), Covrig and Low (2003), and Yu et al. (2010), this study also uses the volatility estimated from the GARCH model to forecast the future volatility of stock markets. The conditional mean and conditional variance equations of stock returns are defined below. Rt a 0 a1 Rt 1 t ht 0 1 t2 1 2 ht 1
(9) (10)
where R t , ht , and t are the daily return, the conditional variance of returns, and the residual of returns on the weighted average stock index on day t, respectively. According to Engle and Bollerslev (1986) and Yu et al. (2010), a rolling-over method is adopted to obtain the volatility estimated from the GARCH model in equation (11). hˆt 1 is the volatility in period (t+1), which is derived from the parameter estimates of β1 and β2 for t-250~t days. Similarly, hˆt 2 is the volatility in period (t+2) derived from the parameter estimates of β1 and β2 for t-249~t+1 days. In order to reconcile the comparative bases, the variance hˆt estimated by the GARCH model is also adjusted and annualized according to equation (12). We incorporate the results of the estimated GFVt into equation (6) to compare its predictive power with the volatility index, historical volatility, and implied volatility. hˆt i ˆ 0
i 2
(ˆ
1
ˆ 2 ) j ( ˆ1 ˆ 2 ) i 1 hˆt 1
(11)
j 0
GFVt hˆt 250
(12)
Different from the index spot markets, the index option markets are highly-leveraged security markets. After investors pay the option premium, they are entitled to purchase or sell a certain amount of the underlying assets from or to the sellers of contracts based on the exercise prices stipulated on the option contracts. If investors expect future stock prices to be on the rising trend, they would tend to buy call options or sell put options. On the contrary, if they predict future stock prices to be on the downward trend, they would tend to buy put options or sell call options in order to make profits. Jayaraman et al. (2001), Kawaller et al. (2001), Pand and Poteshman (2006), and Fung (2007) found that the trading volume and open interest of option markets possess the explanatory power regarding the future volatility of stock prices. The trading volume and open interest of option markets may reflect investors’ expectations of future movement in stock markets. Thus, the paper further incorporates the market information from the option transactions, including the trading volume and open interest of option markets, into our models for analysis. The realized volatilities of the past five days (ARVt-1~ARVt-5) are also included as the control variables (Note 5). The model is defined below.
Published by Canadian Center of Science and Education
221
www.ccsenet.org/ijef
International Journal of Economics and Finance
Vol. 4, No. 2; February 2012
ARV t bo b1 ARV t 1 b2 ARV t 2 b3 ARV t 3 b 4 ARV t 4 b5 ARV t 5 b6Volatility t i b7VOL t i b8 OI t i t
(13)
where Volatilityt-i in equation (13) represents IV_At-i , IV_Ct-i , IV_Pt-i , TVIXt-i , or GFVt-i on day t-i. VOLt-i stands for the trading volume of options on day t-i, and OIt-i represents the open interest of options on day t-i. In addition, our models further analyze the valuable dataset provided by the TAIFEX, which classifies the related information of option transactions (such as the trading dates, trading time, investor IDs, types of options, settlement dates, strike prices, number of contracts, and opening/closing positions) by different types of investors (such as the foreign institutional investors, domestic institutional investors, individual investors, and market makers). The trading information from different types of investors is further included to analyze the predictive power of each model for future stock market movement. According to the definitions introduced by Pan and Poteshman (2006), this study adopts the information variables of the put-call ratios for different types of investors. The put-call ratio is measured as follows: Put Call ratio
Pt Pt C t
(14)
Pt and Ct are the number of put and call option contracts purchased by different types of investors to open new positions on day t. If an investor is informed of negative private information on an underling stock and acts on this information by building new long put option positions, the put-call ratio would increase. On the other hand, building new long call option positions based on positive private information would lower the put-call ratio. To strengthen our analysis, this study also utilizes the public information variables of the trading volumes of put and call options. The put-call ratio of public information is determined from the volume of put and call options purchased by different types of investors. Thus, the models highlight the distinctive influences of private and public information. The information-based model is described as follows (Note 6): ARV t o 1 ARV t 1 2 ARV t 2 3 ARV t 3 4 ARV t 4 5 ARV t 5 6Volatility t i 7 FI t i 8 II t i 9 DI t i 10 MM t i t
(15)
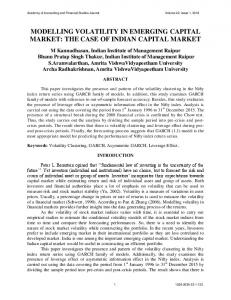
where FIt , IIt , DIt , and MMt are the Put-Call ratios of the foreign institutional investors, individual investors, domestic institutional investors, and market makers on day t, respectively. The predictive power of different volatility indicators and different types of investors toward future market volatility can be determined in equation (15). 4. Empirical Results 4.1 Summary Statistics Table 1 summarizes the descriptive statistics of the realized volatility (ARV), implied volatility (IV_A, IV_C, IV_P), volatility index (TVIX), and GARCH forecast volatility (GFV). Among the volatility indicators, the IV_P has the highest mean value, followed by TVIX and IV_A, and GFV has the lowest mean value. The values of skewness are positive for all variables, indicating the data distributions are skewed to the right. Moreover, the statistics of kurtosis show that the distributions of all variables appear to be leptokurtic except the GFV. Table 2 reports the correlation coefficients for the main variables used in our empirical analysis. The correlation matrix demonstrates a positive correlation coefficient of about 0.5 between the realized volatility and other volatility indicators. Furthermore, the correlation between IV_A, IV_P, and TVIX is as much as 0.95, implying that the implied volatility and the volatility index may have a very similar capacity to predict the realized volatility. Figure 1 shows the trends of the TAIEX and different volatility indicators. Struck by the worldwide financial tsunami of the century caused by the U.S. sub-prime mortgage crisis, the TAIEX fell around 58%, from 9,809 to 4,089. The realized volatility calculated for this period reached a peak of 113.49% on October 27, 2008. The TVIX reached 60.41%, which is the highest level of TVIX during the research period. It indicates that investors were panicky. Therefore, the selling pressure was amplified and reflected in the TVIX. It is important to note that the trends of the TVIX and the IV_A are very close to that of the realized volatility. Thus, we expect that the predictive power of both volatility indicators would be very similar. 4.2 Comparison of Different Volatility Indicators The empirical results for the predictive power of each type of volatility indicator regarding the future market volatility are shown in Table 3 (Note 7). Panel A is for the untransformed data and Panel B is for the log-transformed data. The regression coefficients, t-statistics, R2, adjusted R2, and F Value from all models are recorded in the Table. The empirical results reveal that when different volatility indicators are used as a single independent variable, the regression coefficients of the volatility indicators are significantly positive at the 1% level, regardless of whether the
222
ISSN 1916-971X
E-ISSN 1916-9728
www.ccsenet.org/ijef
International Journal of Economics and Finance
Vol. 4, No. 2; February 2012
untransformed data or the log-transformed data are used. The highest t-statistic is 21.7287 for IV_A, followed by 20.6674 for IV_P and 20.2658 for TVIX, based on the log-transformed data with the lag length equal to 1 (i=1). The values of the adjusted R2 are 0.3641, 0.3411 and 0.3324, respectively. In addition, we further include HVt-i in equations (4)~(6) to determine whether the model simultaneously combining the historical volatility and other types of volatility indicators could enhance the explanatory power. The empirical results show that the coefficients of volatility indicators in each model are all significantly positive at the 1% level. After including HVt-i in the regression, most of the models show higher values of adjusted R2. The highest value of model adjusted R2 is 0.3946 (HV+IV_A), followed by 0.3828 (HV+IV_P) and 0.3731 (HV+TVIX). In general, when a single volatility indicator is adopted as an independent variable in the model, regardless of the lag periods (i = 1, 5, 10, or 20), IV_A generates the best predicative performance, followed by IV_P, TVIX, GFV, IV_C, and HV. As documented in Christensen and Prabhala (1998), Szakmary et al. (2003), and Yu et al. (2010), the predictive performance of the implied volatility is better than that of the historical volatility. Meanwhile, the predictive power of the TVIX is very close to that of the implied volatility. As reported in Aboura and Villa (2003) and Whaley (2009), the volatility index is an effective predictive indicator of the future market volatility. In addition, the results suggest that the explanatory power (adjusted R2) of all models is reduced when the number of lag periods i increases. The models with the lag period equal to 1 (i=1) have the higher explanatory power. It implies that the ability of volatility indicator to reflect market information is better in shorter time periods. Regardless of whether the sample data are log-transformed, the empirical results are identical and the ranking of the predictive performance of volatility indicators is not affected. After HV is incorporated into equations (4)~(6), the results remain the same and the values of adjusted R2 in most models slightly increase. Overall, the results suggest that the volatility indicators adopted in this study have significant impacts in determining the future realized volatility. 4.3 Incorporation of the Control Variables From the results of the above analysis, we found that each type of volatility indicator is able to reflect the market information of recent periods. Thus, this paper incorporates the realized market volatility of the past 5 days into the models as the control variables to observe whether the results would be affected by including the recent realized volatility. The empirical results are listed in Table 4. The results show that the explanatory power of the models including the control variables (ARVt-1~ARVt-5) is significantly enhanced, compared with that of the models with one single volatility indicator. The maximum value of model adjusted R2 is 0.4020 (based on the log-transformed data with the lag length equal to 1 (i=1)). The coefficients of IV_A, IV_C, IV_P, TVIX, and GFV are all significantly positive at the 1% level. When the ARVt-1~ARVt-5 are added into the regression models, the coefficients of the ARVt-1 and ARVt-2 are all significantly positive at the 1% level, whereas most coefficients of the ARVt-5 are significantly positive at the 10% level. These results are in line with the expectation that market information from the recent periods can effectively reflect the future volatility. The overall results of Table 4 are similar to those previously analyzed. The model adopting IV_A as an independent variable achieves the greatest predictive performance, and the performance of TVIX is quite close to that of IV_A, suggesting that the implied volatility and the volatility index are good indicators in predicting the future volatility of stock markets. Furthermore, the results also suggest that the models including ARVt-1~ARVt-5 perform better than those without ARVt-1~ARVt-5 in terms of predicting the future realized volatility. 4.4 Inclusion of the Option Market Information Pan and Poteshman (2006) and Fung (2007) addressed that the option market information may reflect the future market volatility. Table 5 reports the empirical results generated upon the inclusion of option market information, such as the trading volume and open interest of option markets. The empirical results show that the coefficient of each volatility indicator is statistically significant at the 1% level. The coefficients of VOL in most of the models are statistically significant at the 10% level. It proves that the option trading volume can indeed reflect the future market volatility. The results coincide with the findings in Jayaraman et al. (2001), Kawaller et al. (2001), Pan and Poteshman (2006), and Fung (2007). As the empirical results of the open interest are not the same as those of the option trading volume, the information covered in the option trading volume may have included the information set covered in the open interest. Incorporating the option market information in the model can slightly enhance the explanatory power of the models. The maximum value of model adjusted R2 is 0.4043 (based on the log-transformed data with the lag length equal to 1 (i=1)). Finally, among all the models, the model using the IV_A as an independent variable achieves the greatest predictive performance, followed by the models using the TVIX and IV_P. 4.5 Incorporation of the Information from Different Types of Investors The TAIFEX launched TAIEX options in December 24, 2001 and recorded the detailed information of each
Published by Canadian Center of Science and Education
223
www.ccsenet.org/ijef
International Journal of Economics and Finance
Vol. 4, No. 2; February 2012
transaction. The trading volume of put and call options will affect the volatility of stock markets. The valuable dataset provided by the TAIFEX enables us to further classify the types of option transactions. By adopting the approach reported in the prior studies of Pan and Poteshman (2006) and Chang et al. (2009), we divide the investors into four types: the foreign institutional investors, domestic institutional investors, individual investors, and market makers. We also use the information variables of put-call ratios developed by Pan and Poteshman (2006) to conduct our analysis. In order to strengthen our analysis, we adopt the public information variables and private information variables in our empirical analysis. For the public information variables, the put-call ratios of different types of investors are measured based on the volume of long call and long put option contracts. For the private information variables, the Pt and Ct are the number of put and call option contracts purchased by different types of investors to open new positions on date t. Table 6 lists the empirical results of the equation (15) for the models including the public information variables (in Panel A) and the private information variables (in Panel B). The empirical results are similar between the models including the public information variables and private information variables. The positive relationship is found between the volatility indicators (IV_A, IV_C, IV_P, TVIX, and GFV) and the realized volatility (ARV), and the coefficients are significant. The trading information from different types of investors is likely to generate different results. Most coefficients of the put-call ratios of foreign institutional investors (FIt) are significantly positive at the 5% level, whereas most coefficients of the put-call ratios of market makers (MMt) are negative and significant. However, the information variables of individual investors and domestic institutional investors are not statistically significant. The results indicate that foreign institutional investors are able to predict the market volatility more precisely than the other three types of investors. The results are consistent with the findings of Chang et al. (2009), who pointed out that foreign institutional investors have the significant predictive power in the Taiwan stock market. Meanwhile, market makers consistently play the role of matchmaking or revising quotes. When market volatility is high, the need for matchmaking or revising quotes would tend to be reduced. Therefore, the coefficients of MMt are significantly negative with respect to ARV. Finally, we found that the explanatory power of the models is significantly enhanced through the incorporation of the trading information variables (put-call ratios) of different types of investors. The adjusted R2 values of the models adopting both the option information variables and the volatility indicator are enhanced by 88% (from 0.2373 to 0.4457), compared with those of the models adopting the single volatility indicator. When the private information terms are included, the explanatory power (adjusted R2) of the models is able to reach a maximum of 0.4457. Except for the models using IV_C and GFV as an independent variable, the adjusted R2 values of other models all exceed 0.40, indicating that the models including the IV_A, IV_P, or TVIX, as well as the investors’ option trading information variables, can significantly enhance the explanatory power in terms of the future volatility of Taiwan’s stock market. Similar to the findings previously mentioned, the models incorporating IV_A as an independent variable perform the best, followed by the models including TVIX and IV_P, whose results are very close to those of IV_A. 5. Conclusions This paper investigates the predictive power of different types of volatility indicators in Taiwan’s stock market, including the historical volatility, the implied volatility, the TVIX, and the GARCH forecast volatility. Different models are developed to examine the explanatory power of the volatility indicators in predicting the stock market volatility. Furthermore, the detailed trading information compiled in the dataset of the TAIFEX is used to explore the influence of the information from option markets on the stock market volatility. Finally, our study compares the various models of volatility indicators, incorporating the trading information of different types of investors from option markets into the models and verifying the applicability of the volatility index to the emerging markets, in an attempt to fill the gap in the research. The empirical results of our study suggest that the models including the option market information perform better than the models merely adopting a single volatility indicator. As for the predictive power of the volatility indicators, the implied volatility is demonstrated to have the best predictive power, followed by the TVIX, with both generating the similar results. However, the performance of the historical volatility and the GARCH forecast volatility is inferior to that of the implied volatility and the TVIX in determining the future realized volatility. The conclusions generated by this study conducted on the implied volatility and historical volatility coincide with the findings of Christensen and Prabhala (1998), Szakmary et al. (2003), and Yu et al. (2010). Compared with the implied volatility derived from the Black-Scholes option pricing model, the volatility index is an indicator independent of any option pricing model. It is calculated by the daily information released by the option markets and does not rely on the complicated calculations and assumptions. Therefore, the TVIX is more accessible to investors. The empirical results of our study indicate that the ability of the TVIX to predict the future market volatility is very similar to that of the implied volatility of put options. In various types of models, the predictive
224
ISSN 1916-971X
E-ISSN 1916-9728
www.ccsenet.org/ijef
International Journal of Economics and Finance
Vol. 4, No. 2; February 2012
power of TVIX is superior to that of the implied volatility of call options. Thus, the volatility index is an effective predictive indicator in the emerging markets, as documented in Taiwan’s stock market. Especially after incorporating the option market information into the models, the explanatory power of our models can even exceed 40%. It proves that the TVIX is effective in predicting the future realized volatility of Taiwan’s stock market. Finally, we further analyze the influence of option market information variables, provided by Pan and Poteshman (2006), on the future market volatility. We found that the trading information of foreign institutional investors from the option markets provides strong predictive power in explaining the future volatility of stock markets. References Aboura, S., & Villa, C. (2003). International Market Volatility Indexes: A Study on VX1, VDAX, and VIX. Working paper. Paris Dauphine University and Audencia Nantes School of Management. Alizadeh, S., Brandt, M. W., & Diebold, F. X. (2002). Range Based Estimation of Stochastic Volatility Models. Journal of Finance. 57. 1047-1091. http://dx.doi.org/10.1111/1540-6261.00454 Brailsford, T. J., & Faff, R. W. (1996). An Evaluation of Volatility Forecasting Techniques. Journal of Banking and Finance, 20. 419-438. http://dx.doi.org/10.1016/0378-4266(95)00015-1 Canina, E. C. and Figlewski, S. (1993). The Information Content of Implied Volatility. Review of Financial Studies, 6(3). 659-681. http://dx.doi.org/10.1093/rfs/6.3.659 Carr, P., & Wu, L. R. (2006). A Tale http://dx.doi.org/10.3905/jod.2006.616865
of Two Indices. Journal of Derivatives, 13. 13-29.
Chang, C. C., Hsieh, P. F., & Lai, H. N. (2009). Do Informed Option Investors Predict Stock Returns? Evidence from the Taiwan Stock Exchange, Journal of Banking and Finance, 33. 757-764. http://dx.doi.org/10.1016/j.jbankfin.2008.11.001 Chang, C. C., Hsieh, P. F., & Wang, Y. H. (2010). Information Content of Options Trading Volume for Future Volatility: Evidence From the Taiwan Options Market. Journal of Banking and Finance, 34. 174-183. http://dx.doi.org/10.1016/j.jbankfin.2009.07.015 Chen, H. C., Chung, S. L., & Ho, K. Y. (2011). The Diversification Effects of Volatility-Related Assets. Journal of Banking and Finance, 35. 1179-1189. http://dx.doi.org/10.1016/j.jbankfin.2010.09.024 Chung, S. L., Tsai, W. C., Wang, Y. H., & Weng, P. S. (2011). The Information Content of the S&P 500 Index and VIX Options on the Dynamics of the S&P 500 Index. Journal of Futures Markets, 31(12). 1170–1201. http://dx.doi.org/10.1002/fut.20532 Christensen, B. J., & Prabhala, N. R. (1998). The Relation between Implied and Realized Volatility. Journal of Financial Economics, 50. 125-150. http://dx.doi.org/10.1016/S0304-405X(98)00034-8 Claessen, H., & Mittnik, S. (2002). Forecasting Stock Market Volatility and the Informational Efficiency of the DAX-Index Options Market. European Journal of Finance, 8. 302-321. http://dx.doi.org/10.1080/13518470110074828 Corrado, C. J., & Miller, T. W. (2005). The Forecast Quality of CBOE Implied Volatility Indexes. Journal of Futures Markets, 25(4). 339-373. Corrado, C., & Truong, C. (2007). Forecasting Stock Index Volatility: Comparing Implied Volatility and the Intraday High-Low Price Range. Journal of Financial Research, 30(2). 201-215. http://dx.doi.org/10.1111/j.1475-6803.2007.00210.x Covrig, V., & Low, B. S. (2003). The Quality of Volatility Traded on the Over-the-Counter Currency Market: A Multiple Horizon Study. Journal of Futures Markets, 23(3). 261-285. http://dx.doi.org/10.1002/fut.10066 Daigler, R. T., & Rossi, L. (2006). A Portfolio of Stocks and Volatility. Journal of Investing, Summer. 99-106. http://dx.doi.org/10.3905/joi.2006.635636 Day, T. E., & Lewis, C. M. (1992). Stock Market Volatility and the Information Content of Stock Index Options. Journal of Econometrics, 52. 267-287. http://dx.doi.org/10.1016/0304-4076(92)90073-Z Ederington, L. H., & Guan, W. (2002). Measuring Implied Volatility: Is an Average Better? Which Average? Journal of Futures Markets, 22. 811-837. http://dx.doi.org/10.1002/fut.10034 Engle, R. F. (1993). Statistical Models for Financial Volatility. Financial Analyst Journal, 49. 72-78. http://dx.doi.org/10.2469/faj.v49.n1.72 Engle, R. F., & Bollerslev, T. (1986). Modelling the Persistence of Conditional Variances. Econometric Reviews, 5. Published by Canadian Center of Science and Education
225
www.ccsenet.org/ijef
International Journal of Economics and Finance
Vol. 4, No. 2; February 2012
1-50. http://dx.doi.org/10.1080/07474938608800095 Fung, J. K. W. (2007). The Information Content of Option Implied Volatility Surrounding the 1997 Hong Kong Stock Market Crash. Journal of Futures Markets, 27(6). 555-574. http://dx.doi.org/10.1002/fut.20259 Jayaraman, N., Frye, M. B., & Sabherwal, S. (2001). Informed Trading around Merger Announcements: An Empirical Test Using Transaction Volume and Open Interest in Options Market. Financial Review, 36. 45-74. http://dx.doi.org/10.1111/j.1540-6288.2001.tb00010.x Kawaller, I. G., Koch, P. D., & Peterson, J. E. (2001). Volume and Volatility Surrounding Quarterly Redesignation of the Lead S&P 500 Futures Contract. Journal of Futures Markets, 21. 1119-1149. http://dx.doi.org/10.1002/fut.2202 Konstantinidi, E., & Skiadopoulos, G. (2011). Are VIX Futures Prices Predictable? An Empirical Investigation. International Journal of Forecasting, 27(2). 543-560. http://dx.doi.org/10.1016/j.ijforecast.2009.11.004 Konstantinidi, E., Skiadopoulos, G., &Tzagkaraki, E. (2008). Can the Evolution of Implied Volatility Be Forecasted? Evidence from European and US Implied Volatility Indices. Journal of Banking and Finance, 32. 2401-2411. http://dx.doi.org/10.1016/j.jbankfin.2008.02.003 Lin, Y. N., & Chang, C. H. (2009). VIX Option Pricing. Journal of Futures Markets, 29. 523-543. http://dx.doi.org/10.1002/fut.20387 Majmudar, U., & Banerjee, A. (2004). VIX Forecasting. The 40th Annual Conference of the Indian Econometrics Society. Mark, H. (2003). The 'New' VIX and What It May Mean. [Online] Available: http://www.marketwatch.com/story/ (December 20, 2009). Mayhew, S., & Stivers, C. (2003). Stock Return Dynamics, Option Volume, and the Information Content of Implied Volatility. Journal of Futures Markets, 23(7). 615-646. http://dx.doi.org/10.1002/fut.10084 Ni, S. X., Pan, N., & Poteshman, A. M. (2008). Volatility Information Trading in the Option market. Journal of Finance, 63(3). 1059-1091. http://dx.doi.org/10.1111/j.1540-6261.2008.01352.x Pan, J., & Poteshman, A. M. (2006). The Information in Option Volume for Future Stock Prices. Review of Financial Studies, 19. 871-908. http://dx.doi.org/10.1093/rfs/hhj024 Poon, S. H., & Granger, C. (2003). Forecasting Volatility in Financial Markets: A Review. Journal of Economic Literature, 41(2). 478-539. http://dx.doi.org/10.1257/002205103765762743 Poon, S. H., & Granger, C. (2005). Practical Issues in Forecasting Volatility. Financial Analysts Journal, 61( 1). 45-56. http://dx.doi.org/10.2469/faj.v61.n1.2683 Seep, A. (2008). VIX Option Pricing in Jump-Diffusion Model. Risk, April. 84-89. Shu, J., & Zhang, J. E., (2011). Causality in the VIX Futures Market. Journal of Futures Markets, 32. 24-46. http://dx.doi.org/10.1002/fut.20506 Szado, E. (2009). VIX Futures and Options - A Case Study of Portfolio Diversification During the 2008 Financial Crisis (Working paper). Amherst, MA: University of Massachusetts. http://dx.doi.org/10.3905/JAI.2009.12.2.068 Szakmary, A., Ors, E., Kim, J. k., & Davidson Ⅲ, W. N. (2003). The Predictive Power of Implied Volatility: Evidence from 35 Futures Markets. Journal of Banking and Finance, 27. 2151-2175. http://dx.doi.org/10.1016/S0378-4266(02)00323-0 Wang, Z. C., & Daigler, R. T. (2011). The Performance of VIX Option Pricing Models: Empirical Evidence beyond Simulation. Journal of Futures Markets, 31(3). 251-281. http://dx.doi.org/10.1002/fut.20466 Whaley, R. E. (2000). The Investor Fear Gauge. Journal of Portfolio Management, 26. 12-17. http://dx.doi.org/10.3905/jpm.2000.319728 Whaley, R. E. (2009). Understanding VIX. The Journal of Portfolio Management, 35(3). 98-105. http://dx.doi.org/10.3905/JPM.2009.35.3.098 Yu, W. W., Lui, E. C. K., & Wang, J. W. (2010). The Predictive Power of the Implied Volatility of Options Traded OTC and on Exchanges. Journal of Banking and Finance, 34. 1-11. http://dx.doi.org/10.1016/j.jbankfin.2009.06.017 Zhang, J. E., Shu, J. H., & Brenner, M. (2010). The New Market for Volatility Trading. Journal of Futures Markets, 30(9). 809-833. http://dx.doi.org/10.1002/fut.20448 Zhang, J. E., & Zhu, Y. Z. (2006). VIX Futures. Journal of Futures Markets, 26(6). 521-531. http://dx.doi.org/10.1002/fut.20209 226
ISSN 1916-971X
E-ISSN 1916-9728
www.ccsenet.org/ijef
International Journal of Economics and Finance
Vol. 4, No. 2; February 2012
Notes Note 1. See the World Federation of Exchanges, “2008 IOMA Derivatives Market Survey.” [Online] Available: http://www.world-exchanges.org (March 2, 2010). Note 2. Whaley (2009) pointed out that the OEX trading volume accounted for 75% of the trading volume of index options in 1992. Note 3. Yu et al. (2010), Szakmary et al. (2003), Covrig and Low (2003), and Ederington and Guan (2002) also adopted the implied volatilities of both call options and put options in their studies. Note 4. The formulas can be found in “The CBOE volatility index – VIX”, [Online] Available: http://www.cboe.com/micro/vix/vixwhite.pdf. Note 5. The realized volatilities of the past five days are selected as the control variables by the Akaike Information Criterion, as suggested by Wang et al. (2006). Note 6. We would like to thank the Taiwan Futures Exchange for providing the valuable data, which greatly contribute to our research. As the data stem from December 1, 2006 to October 31, 2008, the research period for the equation (15) is set accordingly between December 1, 2006 and October 31, 2008. Note 7. Due to space constraints, only the results for the lag length equal to 1 are reported in Tables 3~6, and only the results for the untransformed data are reported in Tables 4~6. The results for other lag length (i=5, 10, 20) and for the log-transformed data are available upon request. Table 1. Summary Statistics for the Realized Volatility, Implied Volatility, Volatility Index, GARCH Forecast Volatility, Option Market Trading Volume, and Option Market Open Interest. Var. Mean Median Maximum Minimum Std. Dev. Skewness Kurtosis N
ARVt 0.2541 0.2190 1.1349 0.0526 0.1502 1.6552 7.1422 825
IV_At 0.2870 0.2767 0.8615 0.1121 0.1115 1.0741 4.7566 825
IV_Ct 0.2586 0.2472 0.8697 0.0862 0.0967 1.1182 5.9973 825
IV_Pt 0.3155 0.2999 1.3816 0.0956 0.1456 1.8835 9.9594 825
TVIXt 0.2883 0.2829 0.6041 0.1174 0.0914 0.5548 3.1461 825
GFVt 0.2462 0.2382 0.5577 0.0632 0.0979 0.4690 2.2904 825
VOLt 348693.00 324712.00 955561.00 78893.00 139332.00 1.08 4.63 825
OIt 702585.20 696440.00 1313587.00 230219.00 214602.70 0.20 2.63 825
Table 2. The Correlation Coefficients between Six Types of Volatility Indicators and Two Types of Option Market Information Variables. Var. ARVt IV_At IV_Ct IV_Pt TVIXt GFVt VOLt OIt
ARVt 1.00 0.56 0.54 0.50 0.56 0.54 0.30 -0.17
IV_At 1.00 0.88 0.95 0.95 0.83 -0.09 -0.35
IV_Ct 1.00 0.68 0.88 0.75 -0.09 -0.36
Published by Canadian Center of Science and Education
IV_Pt
1.00 0.87 0.78 -0.08 -0.30
TVIXt
1.00 0.84 -0.14 -0.38
GFVt
1.00 -0.08 -0.31
VOLt
1.00 0.62
OIt
1.00
227
www.ccsenet.org/ijef
International Journal of Economics and Finance
Vol. 4, No. 2; February 2012
Table 3. The Information Content of the Historical Volatility versus the Implied Volatility, the Volatility Index, and the GARCH Forecast Volatility. Intercept
HVt-i
IV_At-i
Panel A Untransformed Data 0.1442*** 0.4326*** (15.5315) (13.7547) 0.0378*** 0.7536*** (3.1536) (19.3545) 0.0581*** (4.4515) 0.0807*** (7.6256) 0.0073 (0.4946) 0.0647*** (5.2731) 0.0313*** 0.1735*** 0.6227*** (2.6329) (5.0446) (13.4404) 0.0489*** 0.2396*** (3.8237) (6.8198) 0.0606*** 0.2208*** (5.6406) (6.6361) 0.0094 0.2064*** (0.6500) (5.8664) 0.0531*** 0.2285*** (4.3909) (6.5388) Panel B Log-transformed Data *** -0.7454 0.5105*** (-15.3379) (17.0118) -0.3559*** 0.8848*** (-6.3718) (21.7287) -0.3633*** (-5.6328) -0.5738*** (-11.8319) -0.2412*** (-3.7014) -0.3945*** (-6.5704) -0.2805*** 0.2239*** 0.6835*** (-5.0340) (6.5123) (13.5784) -0.2776*** 0.2947*** (-4.4318) (8.5662) -0.4288*** 0.2547*** (-8.4507) (7.5223) -0.1939*** 0.2553*** (-3.0544) (7.3782) -0.2942*** 0.2781*** (-4.9797) (8.1639)
Implied Volatility IV_Ct-i
IV_Pt-i
TVIXt-i
GFVt-i
***
0.7581 (16.0348)
0.5498*** (18.0553)
***
0.8560 (17.4826)
0.7696*** (16.6274)
***
0.5584 (10.2363)
0.4355*** (12.6913)
***
0.6668 (11.5293)
0.5807*** (10.8309)
***
0.8171 (18.5683)
0.7624*** (20.6674)
***
0.9904 (20.2658)
0.7610*** (19.4874)
***
0.5613 (10.8604)
0.5673*** (12.8587)
***
0.7266 (12.2468)
0.5431*** (11.7820)
R2
Adj-R2
F
0.1871
0.1861
189.1920
0.3130
0.3122
374.5952
0.2383
0.2373
257.1153
0.2840
0.2831
325.9968
0.2710
0.2702
305.6404
0.2517
0.2508
276.4694
0.3337
0.3321
205.5919
0.2791
0.2773
158.9301
0.3204
0.3188
193.5516
0.3004
0.2987
176.2397
0.2887
0.2870
166.6349
0.2604
0.2595
289.4011
0.3648
0.3641
472.1376
0.2955
0.2946
344.7831
0.3419
0.3411
427.1396
0.3332
0.3324
410.7009
0.3160
0.3152
379.7578
0.3960
0.3946
269.1664
0.3533
0.3517
224.2614
0.3844
0.3828
256.3038
0.3746
0.3731
245.9186
0.3674
0.3658
238.3686
This table reports the regression coefficients and t-statistics (in parentheses). The number of lag periods is set to be 1 (i=1). * ** , and *** denote significance at the 10%, 5% and 1% levels, respectively.
228
ISSN 1916-971X
E-ISSN 1916-9728
www.ccsenet.org/ijef
International Journal of Economics and Finance
Published by Canadian Center of Science and Education
Vol. 4, No. 2; February 2012
229
www.ccsenet.org/ijef
230
International Journal of Economics and Finance
Vol. 4, No. 2; February 2012
ISSN 1916-971X
E-ISSN 1916-9728
www.ccsenet.org/ijef
International Journal of Economics and Finance
Vol. 4, No. 2; February 2012
Note: SI is the TAIEX. ARV is the annualized realized volatility. IV_A is the average of the implied volatilities of put and call options. IV_P is the implied volatility of put options. IV_C is the implied volatility of call options. VIX is the TVIX. GFV is the GARCH forecast volatility.
Figure 1. The Trends of Different Types of Volatility Indicators versus TAIEX
Published by Canadian Center of Science and Education
231