Computers, Environment and Urban Systems 54 (2015) 347–355
Contents lists available at ScienceDirect
Computers, Environment and Urban Systems journal homepage: www.elsevier.com/locate/ceus
The immersive visualization theater: A new tool for ecosystem assessment and landscape planning Daniel E. Orenstein ⁎, Hagit Zimroni, Efrat Eizenberg Faculty of Architecture and Town Planning, Technion — Israel Institute of Technology, Israel
a r t i c l e
i n f o
Article history: Received 16 June 2014 Received in revised form 12 October 2015 Accepted 13 October 2015 Available online 20 October 2015 Keywords: Immersion Landscape planning Cultural ecosystem services Environmental perceptions Visualization
a b s t r a c t In this study focusing on human–environment interactions, we analyze the use of an immersive visualization theater (IVT) for exploring how humans use and value cultural ecosystem services provided by natural landscapes in Israel's Carmel Forest. Our goal in this inductive, exploratory study is to assess the impact of the IVT on the quality and content of stakeholder discussions held in the theater. We facilitated 10 focus group discussions in the IVT, where a series of high-resolution photographs were projected. Participants were asked (in writing and orally) to choose from among the scenes where they would prefer to spend time, and then asked to explain their answers. Next, they were asked to describe activities in selected scenes in which they were likely to participate. We suggest that the immersion theater, due to screen size, photo resolution, social interaction, and group isolation within the theater, elicited attention to detail and triggered memories and sensory responses to various landscapes. The qualitative data derived from focus group discussions add to our understanding of the diverse meanings and importance that different people attribute to the landscape, contribute to understanding the social processes and conditions through which participants attribute value to cultural ecosystem services, and allow us to generate testable hypotheses for continuing research. © 2015 Elsevier Ltd. All rights reserved.
1. Introduction In this research, we assess the utility of a relatively new research venue – the immersive visualization theater (IVT) – for experimental inquiries into public preferences regarding natural landscapes and the cultural ecosystem services derived from these landscapes. Three interconnected fields of scholarly inquiry converge around our experimental venue, including 1) ecosystem services (ES) assessment (cultural ES in particular), 2) human perceptions of landscapes, and 3) the potential role of stakeholders in land use planning and policy. The first is a relatively new science, while the latter two are well-established research foci that have traditionally utilized visualization (Steinitz, 1990, Oh, 1994, Daniel & Meitner, 2001, Lange, 2001, Lange & Bishop, 2005, Sheppard, 2005, Lewis & Sheppard, 2006). Utilizing high-definition photographs of landscapes from Israel's Carmel Mountain in an IVT has enabled us to form insights regarding the potential utility of the IVT as a research tool. Further, using the IVT (rather than other visualization tools) has challenged us to reconcile the benefits and shortcomings of this technology. Here we ask: What are the possible advantages and added value of using the IVT for research on landscape preferences and perceptions? By addressing this question, we add to the emerging literature that assesses the contribution of ⁎ Corresponding author. E-mail addresses:
[email protected] (D.E. Orenstein),
[email protected] (H. Zimroni),
[email protected] (E. Eizenberg).
http://dx.doi.org/10.1016/j.compenvurbsys.2015.10.004 0198-9715/© 2015 Elsevier Ltd. All rights reserved.
advanced-technology visualization tools to the study of landscape perception and planning (Sheppard, 2001, Paar, 2006). We begin with a short overview of related work concerning cultural ES assessment, human perceptions of landscapes, and visualization theory and research applications. We then describe the experimental venue, the IVT, and the experimental methodology, focus group discussions. Next, using the predominant themes that arose during focus group discussions, we outline the suggested contribution of our IVT – called the VIZ-Lab – in eliciting responses from participants to our research questions. We conclude with a discussion regarding the proposed strengths and weaknesses of the experimental venue compared to those of other potential media and venues as described in the research literature. 2. Background Cultural ES are defined as processes and characteristics of an ecosystem that provide benefits to humans in the form of spiritual, educational, social and recreational value (Reid et al., 2005, Church, Burgess, & Ravenscroft, 2011). The ES conceptual framework (which also includes provisioning, supporting and regulating services — all crucial to human survival and wellbeing) has proliferated across the research, planning and policy-making communities (Braat & de Groot, 2012, Maes et al., 2012). While the framework has gained popularity, understanding of cultural ES has remained rather generic, partially due to the dearth of social scientists participating in ES assessment and research (Duraiappah &
348
D.E. Orenstein et al. / Computers, Environment and Urban Systems 54 (2015) 347–355
Rogers, 2011). With the recent influx of social scientists into this realm, definitions of cultural ES and the methodologies for assessing them are becoming increasingly nuanced and structured (Chan et al., 2012, Daniel et al., 2012, Tengberg et al., 2012, Gould et al., 2015). The study of cultural ES demands a focus on the non-material values derived from ecosystems, including spiritual and aesthetic values, cultural identity, social cohesion and heritage value, among others (Church et al., 2011, Chan et al., 2012, Gould et al., 2015). Since cultural ES provide non-material benefits (e.g., experiences, activities) as an outcome of socio-ecological interactions, there is a crucial need for understanding peoples' ways of life, and especially the meanings and interpretations that people relate to the benefits they experience from their interactions with natural environments )Tilley, 1994, Chan et al., 2012, Tengberg et al., 2012). As such, cultural ES research builds upon existing bodies of knowledge provided by environmental psychology, human geography, anthropology and landscape architecture. Further, cultural ES research borrows from the research methodologies of these disciplines, including observations, ethnographies, surveys and interviews, and guided group discussion. With the recent increase in social research on cultural ES, ES research has begun to focus on the landscape itself, rather than on its particular biotic components (e.g. Fagerholm, Käyhkö, Ndumbaro, & Khamis, 2012, Tengberg et al., 2012). Several studies investigating ES through a social lens revealed that aesthetic and cultural landscapes were the most highly-valued components of the ecosystem (Gee & Burkhard, 2010, Tengberg et al., 2012, Sagie, Morris, Rofè, Orenstein, & Groner, 2013, Orenstein & Groner, 2014). This discovery poses a particular challenge for land use and natural resource management and for ES scholars, who have tended to focus on ecosystem services that could be measured in ecological terms or valued in economic terms, and who were criticized for these reasons (Spangenberg & Settele, 2010, Luck et al., 2012). New questions have been raised, including: What ES should be managed within the landscape? What biotic components of the landscape provide cultural ES? Does a particular species composition or level of biological diversity create more favorable landscapes? Do people appreciate landscapes regardless of their biological composition (Orenstein & Groner, 2015)? These questions bring cultural ES research closer to the disciplines that have traditionally studied landscape perceptions including, in particular, landscape architecture, natural resource planning and management, and environmental psychology (and have led some researchers to adopt the term “landscape services”, e.g. Termorshuizen & Opdam, 2009, Brown, Montag, & Lyon, 2011). Likewise, these disciplines have been engaged in the theoretical and applied development of visualization methodologies. The use of visualization for research of natural and constructed landscapes has a long and rich history (Ribe, 1989, Daniel, 2001, Lange & Bishop, 2005, Lange, 2011), and interest in its use continues to rise alongside growing interest in public participation in natural resource management and environmental planning (Bell, 2001, Sheppard, 2001). The reasons provided for employing visualization in landscape research, planning and design fall within a spectrum ranging from theoretical research for understanding aesthetic preferences and perceptions to applied research aimed at procuring stakeholder opinions regarding specific planning, design and management issues. But overall, there is a strong bias towards applied research for planning and management. The oeuvre of Zube et al. is noted for its focus on the development of a theory of human perceptions of landscapes (Zube & Pitt, 1981, Zube, Sell, & Taylor, 1982, Zube, 1984), but even they emphasize applied value as their motivation; “Inquiry centered on the landscape itself is most strongly motivated by the pragmatic concerns of environmental management, planning or design” (Zube et al., 1982; p. 6). Visualization, regardless of the medium, uses visual imagery to engender a response from the viewer. Bell (2001) asserts forthright that “people tend to judge things on the basis of what they see as much as or more than on what they know”. If this is true, then simply showing someone a given landscape could be the first step in obtaining their
opinion of the site, and should elicit a more germane response than asking them about a scene in the absence of a visual image, actual or reproduced. There are diverse tools for employing visualization, the most common of which are the use of photographs, which are generally small enough to be held in one's hand or to have several spread across a table in front of the viewer (e.g., Arriaza, Cañas-Ortega, Cañas-Madueño, & Ruiz-Aviles, 2004, Natori & Chenoweth, 2008, Shipley & Feick, 2009, and others). As early as 1967, Sonnenfeld (cited in Zube & Pitt, 1981) used photo-slides for comparing native and non-native residents' landscape preferences for residential settlement in Arctic and non-Arctic environments. Apart from actual site visits, photographs were the first medium to be used in experiments assessing the aesthetic preferences of individuals for landscapes, which sometimes attempted to establish mathematical relationships between landscape characteristics and aesthetic preferences (Shafer & Brush, 1977, Ribe, 1989). In other early work, photographs were shown to park users as a basic strategy in developing a visual preference model, which then was used to produce concrete recommendations for landscape planning (Steinitz, 1990). Landscape visualization techniques underwent a substantial shift with the development of computer graphics and 3D capabilities (Lewis & Sheppard, 2006, Paar, 2006). This shift included the growing utilization of computer-generated images or photographs – ‘photo-realistic landscape visualizations’ (Lewis & Sheppard, 2006) – displayed on a computer screen or projected in either 2D or 3D. The rise of 3D landscape simulations and other technologies greatly improved the quality of virtual reality (VR) environments (Bowman & McMahan, 2007) and their potential utility for stakeholder-integrated landscape planning. Some research of the past two decades has focused on the relative strengths and weaknesses of various visualization tools for planning purposes. For example, Bailey, Brumm, and Grossardt (2001) compared the efficacy of three visualization modes for computer-generated images, including 2D, 3D and VR, each projected on a computer screen, for use in collaborative highway planning. They found that users preferred 3D images, citing realism and functionality among their primary advantages (in particular, the ability to observe a scene from multiple angles). Lewis and Sheppard (2006) compared the use of photorealistic images to GIS maps in planning and found that use of images led to a more in-depth, lively and meaningful discussion regarding interviewees' landscape preferences. The comparative response of individuals exposed to different visualization tools is an ongoing topic of dispute and research (Daniel & Meitner, 2001, Sheppard, 2001, Lewis & Sheppard, 2006, Paar, 2006). Zube and Pitt (1981) provided evidence that landscape evaluations using wide angle photographs yielded results that were highly correlated with evaluations made in situ. Daniel and Meitner (2001) provided an inventory of additional research that supported this finding. However, noting exceptions to this claim, they conducted their own study of landscape perceptions using various levels of photorealism. They concluded that more abstract representations of landscapes do not provide correlating results with those produced using photographs. In contrast, Paar (2006), who surveyed planners regarding the efficacy of 3D landscape simulations, found that photorealism ranked relatively low in importance, while ease of learning and interoperability were ranked the most important characteristics of 3D visualization software. The immersive visualization theater (IVT) provides a unique venue for visualization. While the technical profile of each theater is unique, we refer to a theater-like environment that includes a large surround or semi-surround projection screen and high-definition projectors. The immersive aspect of these theaters can, as stated eloquently by Fraser et al. (2012), have “the ability to dominate the viewer's senses, focus the viewer's attention on the stimuli, provoke the senses, and cause the viewer to become absorbed by the story and characters” (Fraser et al., 2012, p. 4‐4). IVT can include a range of features and capabilities, such as 3D projection, tracking cameras for allowing participants to interact with the projected images, internet and conferencing
D.E. Orenstein et al. / Computers, Environment and Urban Systems 54 (2015) 347–355
capacities, sound system and furnishings to facilitate for group interaction and discussion. VR systems build upon the benefits of IVT, including exploitation of the IVT's wide field of view and shared group experiences (Brooks, 1999, Bowman & McMahan, 2007). IVT are used by military agencies (for training purposes), commercial enterprises (including marketing research and entertainment), government agencies, and a growing number of academic institutions. Recently, several research institutions have constructed such theaters as research tools for stakeholder-integrated land use planning and policy-making (MacEachren et al., 1999). Arizona State University's Decision Theater Network (https://dt.asu.edu) is notable in this regard, where researchers are exploring the purported advantages of visualization tools and theaters for public participation in policy decision making (see, for example, Edsall & Larson, 2009, Guhathakurta et al., 2009, Larson & Edsall, 2010, White et al., 2010). Early examples within an academic setting include the Immersive Visualization Laboratory of the University of Toronto's Centre for Landscape Research (Danahy, 2001) and the Swiss Federal Institute of Technologies “VISDOME” (Lange, 2002). Other examples include the Visualization Center at Helmholtz Centre for Environmental Research (http://www.ufz.de/index.php? en=14171), The James Hutton Institute's Virtual Landscape Theater in Scotland (http://www.hutton.ac.uk/learning/exhibits/vlt), and the University of British Columbia's Hydro Theater (http://calp.forestry. ubc.ca/bc-hydro-theatre/). While the technical parameters and the research applications vary from site to site, in general, IVT enables the use of panoramic, high-definition photographs of landscapes to offer an advanced research tool and a new venue for interactive landscape planning and assessment. Several advantages to such immersive theaters have been suggested in the literature when compared to smaller-scale visualization media, including 1) enabling viewers to use their entire field of view to scan and understand landscape detail and structure (Danahy, 2001); 2) intensifying the emotional impact of the media on the observer (Reeves, Lang, Kim, & Tatar, 1999, Codispoti & De Cesarei, 2007); and 3) facilitating synergistic energy between multiple audience members that generates a more visceral collective response to the media than what an individual would experience watching alone on a small screen (Hanich, 2010). Meitner (2004) found that use of panoramic imagery improved the ability to quantify scenic beauty as compared to the use of individual photographs. IVT is claimed to accentuate the power that visualization has on human perceptions of knowledge, attention, emotional processing, interpretation of and inference on reality (Daniel & Meitner, 2001). In the educational realm, the quality of immersive experiences conveyed via large screens has been shown to have positive impacts on educational experiences due to increased interest, engagement and motivation on behalf of the participants (Fraser et al., 2012). Immersive theaters, provided with the necessary data input, can thus be said to optimize the desired factors for creating a virtual reality as defined by Hein (cited in MacEachren et al., 1999), which include immersion, interactivity, information intensity, and intelligence of objects. Danahy (2001) and others emphasize the important role of peripheral vision and scanning in the assessment of visual images. The IVT venue allows “the eye of an observer to robustly move the focus of attention” across the scene and understand the spatial detail and structure of a scene (Danahy, 2001, p. 133). The immersive theater emphasizes these qualities, thus giving such a venue a potential research advantage as compared to other forms of visualization. Despite its popularity, controversies regarding visualization as an experimental framework have also grown, particularly with regard to its usefulness in integrating the public into planning. Sheppard (2001) provides an inventory of ethical challenges presented by the use of visualization in planning. These include possible misuse of visualization arising from the newness of the methodology and general lack of rules and ethical guidelines framing its use. Another debate, relevant to the use of the IVT, questions the utility of studying landscape perceptions via representations of landscapes removed from the actual site
349
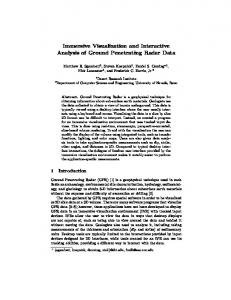
Fig. 1. Blueprint for VIZ-Lab.
(Sheppard, 2005). Wergles and Muhar (2009) compared computer visualization to on-site research, arguing that visualization introduces deficiencies to research because images are pre-selected, thereby directing the attention of the respondent to a specified scene, dictating what the observer focuses on. Visualization is also unable to convey attributes of objects such as their material content, surface texturing and age, and any perceptual impressions related to interaction with the environment and movement, either of the observer or of the objects. Further, neither sound nor scent is conveyed via visualization (Wergles & Muhar, 2009, Lindquist & Lange, 2014). These arguments refer to all types of visualization, though we claim here that immersive visualization, especially when coupled with prior, real-life experience, may overcome some of these weaknesses. In this exploratory research, we assess the utility of IVT for the study of cultural ES in forested landscapes in Israel. In doing so, we both provide evidence in support of some of the advantages of IVT for research noted above, and suggest testable hypotheses regarding the utility of IVT as compared to other visualization techniques.
3. Methodology The Technion Faculty of Architecture and Town Planning IVT (VIZLab; http://viz-lab.net.technion.ac.il/) is located in a 9.2 × 6.8 m room, with a 2.4 m high, curved screen providing a 7 m radius and 75° field of view (Figs. 1 and 2). Images are projected across the entire expanse of the screen using three high-definition projectors (5740 × 1200 pixel resolution). A high-resolution camera equipped with a wide-angle lens was purchased to collect images that match projection resolution. The
Fig. 2. VIZ-Lab projection screen (photo courtesy of Haim Singer).
350
D.E. Orenstein et al. / Computers, Environment and Urban Systems 54 (2015) 347–355
theater was designed by Antycip Simulation and the total cost of the primary equipment in 2013 was approximately 200,000 Euro (not including the expenses of retrofitting the space).1 While the VIZ-Lab has 3D and interactive capacities, the current research used high-definition still photographs, thus taking advantage only of the immersion and information intensity aspects of the virtual environment (MacEachren et al., 1999). Our field site is the Carmel Mountain, a Mediterranean forested area and one of Israel's largest and most-visited national parks, which has been subjected to intensive human recreational and agricultural use and which experiences periodic forest fires (Naveh & Carmel, 2003). This mountain forest also contains and abuts large human settlements (including Israel's third-largest city, Haifa). The funding agency for our research, the Israel Ministry of Environmental Protection, was interested in post-fire restoration and the aesthetic implications of tree type, mixed-use development, fire breaks and other post-fire land use decisions.2 Our experimental protocol was based on focus group discussions (Bloor, Frankland, Thomas, & Robson, 2001) around a series of projected, high-definition photographs of various landscapes from the Carmel Forest (Appendix 1). We collected 350 photographs of various landscapes of the Carmel at diverse scales of resolution (from close-up photos of shrubs and trees to panoramic views) and chose 15 from among them for use in focus group discussions (10 photographs were used as the basis for each discussion). Photographs were selected to cover a range of landscape characteristics that were of interest to management agencies and had relevance to post-fire restoration efforts. These included 1) open views of mountain vistas (including sea view) versus landscapes with limited visual range; 2) dense versus sparse vegetation cover; 3) undisturbed landscapes versus constructed landscapes (e.g. parking lots, camping areas, picnic tables and other recreational facilities); 4) monoculture and diverse forests, and; 5) diverse proximities from urban environments. Overall, we attempted to adhere to general and relevant principles of data selection for visualization research, including accuracy, representativeness, visual clarity and interest (Steinitz, 1990, Sheppard, 2001). All but two of the landscape photographs were devoid of human presence (these two were not used in most of the discussions). The projected photographs matched the projection resolution, thereby utilizing the entire screen. The 15 photographs utilized in this research, along with their geographic coordinates, are provided in Appendix 1. We then invited stakeholders to structured focus group discussions within the VIZ-Lab. We used focus group methodology to organize and conduct the meetings. In this methodology, small groups of stakeholders are assembled in a forum in which participants offer their perspectives and interact with one another, with an emphasis on dialogue between all of the participants and with an underlying assumption that there are no “correct” answers to questions of interest (Bloor et al., 2001; Shipley & Utz, 2012). Participants included 74 individuals of diverse, pre-selected backgrounds grouped into ten focus groups of six to ten people each. Characteristics of the participants included university students, researchers and practitioners from the fields of landscape architecture, architecture, urban planning, ecology, and archeology, land use managers, high school students (including a group from a scouting organization), and residents of the communities in and around the Carmel Forest, including Jewish and Druze participants. Forty men and 34 women participated, and ages ranged from teenagers to retirees. The groups varied in their degree of heterogeneity, although most were comprised of a relatively homogenous demographic group 1 An additional 100,000 Euros were spent on a software package that adapts and projects two-dimensional images in three dimensions, but this software was purchased for other applications and is not used in the current research. It is important to note, however, that the multiple, synergistic uses of the facility made the initial investment more palatable. 2 The funding was provided to the Ministry to support post-fire research following the destructive 2010 Carmel Fire; see Tal (2013) regarding the fire and its legacy.
(e.g. university students, high school students, ecologists, local residents). For each discussion, participants were led into the VIZ-Lab and asked to sit in a semi-circle opposite the screen. They were given a questionnaire and asked to look at the ten visuals projected in randomized sequence on the screen (Appendix 2). They were then asked to give a name to each of the ten photographs and to select four of the photographs as places where they “would like to spend time”. Each picture was projected for enough time to allow participants to complete the task (usually less than one minute per picture). This stage enabled each participant to formulate her or his opinion individually without being affected by group pressure. Next, the participants were asked to write about their preferred activities for each of the places they chose for the previous question. The facilitator then initiated an open discussion asking each participant to discuss one of the scenes they chose as a place they would like to spend time and to explain why they selected that scene. The picture that was being discussed was re-projected on the screen while it was being discussed. Other participants were free to respond with their own reactions and opinions. The moderator ensured ample opportunity for all participants to speak. As will be noted, discussions transcended simple assessments of like or dislike, and the selected scene provided the backdrop for a discussion of several minutes. In addition to the facilitator, two additional researchers (visible to the participants) observed the discussions, one observing the non-verbal reactions and interactions of the participants, and one observing significant (emotional, confrontational, etc.) verbal interactions during discussion. An additional staff member operated the visualization equipment. Each session lasted approximately 90 min. Discussion sessions, which were both audio and video recorded, were transcribed and thematically and quantitatively analyzed together with the questionnaire results (Strauss, 1987, Strauss & Corbin, 1990). Transcribed data were coded and underwent thematic content analysis, noting dominant recurring terms. Similar terms were grouped under more general themes. Major themes that were identified from the data included “ecology and biodiversity”, “orderly nature and the ‘perfect balance’ between humans and nature”, “a meeting place versus a place of solitude”, and “calm and relaxation”. In addition to the thematic analysis, researchers observed participant conduct, individual behaviors, and interactions among the participants during each session. Through analysis of these data, we identified three qualities of the VIZ-Lab that appeared to have enhanced the experience of the users and heightened their emotional responses to the visual images. The IVT qualities relevant to the research were projection size, isolation (within the theater, thus undistracted by activities unconnected to the research), and social venue (for group discussion). We suggest that these qualities contributed to drawing out and highlighting the themes that emerged in the research. These qualities are presented and discussed in detail below.
4. Characteristics of immersion visualization theaters and their suggested impact on research of landscape perceptions 4.1. Size and detail The first, and perhaps most intuitive, suggested benefit of the IVT is the size of the projected images. The entry into the theater was consistently accompanied by a display of excitement and anticipation (the “wow-factor”). The first projected photographs further stimulated this response, as participants' eyes scanned across the expanse of the screen, taking in the holistic image, following which participants began to look at fine details. Landscape perception starts with the reception of stimuli which are then processed by the brain, a phenomenon influenced by the intensity and wavelengths of light energy (Bell, 2001). Greater stimulation has been shown to lead to a more visceral response (Reeves et al., 1999, Codispoti & De Cesarei, 2007).
D.E. Orenstein et al. / Computers, Environment and Urban Systems 54 (2015) 347–355
After the researchers requested participant opinions regarding the images, conversations often focused on particular (and seemingly irrelevant) objects in the picture, including, for example, a trash can, an assemblage of boulders, a table, and even a small piece of trash. In an expansive forest image, one participant pointed to the very top, left corner of the scene and expressed annoyance that there was a house behind the trees (barely noticeable except by those sensitive to exurban development within natural areas; Appendix 1, photograph #10). Immersion within the scene also seemed to trigger sensitivity to colors, hues, and shading. An image of the understory of an oak forest, with individual rays of light prodding through the canopy, elicited, on several occasions, references to a magical, fairy-tale-like scene (Appendix 1, photograph #12). Under our analytical theme of ecology and biodiversity, it was apparent that size and high-definition of the image allowed participants with knowledge of the local vegetation to identify the various plants in the picture. This emphasizes the suggested advantages of high accuracy and high-clarity data (Sheppard, 2001) and of large scale projections (Danahy, 2001, Fraser et al., 2012). Forestry in the Carmel region (like elsewhere in Israel) has a contentious history, in particular regarding the species used in planting (introduced pines rather than native oaks; Tal, 2013). Ecologists and nature enthusiasts responded with disdain when a pine plantation was projected (Fig. 3), while they gave positive responses to an oak forest. Non-experts generally expressed appreciation of forests, regardless of their species composition, and related to other characteristics of the images including, for instance, the presence of paths, the proximity to roads, and the quality of light coming through the trees. In the foreground of a picture of an expansive view of the sea, the size and detail of the image seemed to allow participants to notice and appreciate the recovery of vegetation following a destructive 2010 forest fire (Appendix 1, photograph #5). Ironically, some observers who responded negatively to pine plantations (e.g. Appendix 1, photograph #13), responded positively to these same species sprouting from the charred earth following the fire. “Despite the fire”, expressed one respondent, “there is regeneration, along with a beautiful view”. In this same image, ecologists noted the presence of charred vegetation amidst the undergrowth, and one noted, “A sad place after the fire. I chose this place anyway [as one of my preferred images] despite the fact that it causes sadness associated to loss of life… because it stirs curiosity about how the fire influence the area, and what will grow in its wake.” Many comments that fell under the theme of orderly nature and the ‘perfect balance’ between humans and nature reflected the ability of participants to discern small details. These observations were related to the degree to which each scene was orderly and to the dilemma of whether or not the presence of human-made objects constituted “balance” or “disturbance”. While garbage was universally viewed as negative, objects such as stone paths, paved roads, and picnic benches became foci of discussion. For instance, during a discussion around an image of a picnic site within an olive orchard (Appendix 1, photograph #1), one respondent (who did not choose the image among his preferred sites) said, “the tables and the green garbage cans are so prominent that they bother me.” The panoramic views catalyzed emotional and sensory responses of participants based on past experiences in the projected landscapes or in
351
similar ones. The images sparked memories that connected the visual scene with other senses — olfactory, auditory, and kinesthetic (i.e. bodily feelings) and hearkened feelings of calm and relaxation. Images of sunny hilltops prompted comments about the heat and the desire to look for shade, while shady forests were discussed positively as a place to cool off. The most popular image of the series, a small pool collecting spring water (Appendix 1, photograph #2), provoked references to rest and drinking tea and coffee. Many participants expressed that one or more of the scenes gave them a sensation of calm. Multiple terms conveying this sensation were used, including pastoral, harmonious, clean, aesthetic, shady and cool, restful, quiet, serenity, tranquility, intimacy, breeze, pleasant wind, calming light, and warmth. Again, the immersive experience seemed to have had a physical impact on the participants, akin to the actual experience. Exposure to images within the IVT seemed to trigger powerful memories for a place. Memories of social gatherings were frequently noted, as were experiences of solitude in nature (collected under the theme of a meeting place versus a place of solitude). One particularly symbolic image was a close-up of heavy vegetative undergrowth blocking a footpath (Appendix 1, photograph #8). The undergrowth depicted in this image became a symbol of division between individuals who looked for potential social settings among the images and those who were looking for solitude in the forest (“I'm going beyond those shrubs where I can be alone and explore what's there” or “I can pass through the shrubs and no one else will follow”). Interestingly, one participant saw a residential neighborhood in the skyline of an otherwise open view to the sea and relayed the security he felt knowing that, while he is alone in nature, he's glad to see a populated area in the background. The size of the projected image seemed to enable participants to refer and get attached to parts of the scene even when they disliked most of it. For example, referring to an image of a picnic site (Appendix 1, photograph #1), one participant noted: “See that mountain in the back of the picture? That's where I'm taking my kids.” The participant wanted to get away from the foreground (a picnic site that would potentially become crowded) and flee to the background (a mountain that rose from behind the picnic site). Others saw the foreground of this same image as the ideal venue for a social interaction, “Soon this place will be full of people, with laughing and music and the smell of meat cooking.” In this way, a more complex understanding of the quality of the landscape became apparent to us.
4.2. The collective, social experience Upon inaugurating the VIZ-Lab, architect and dean of our faculty, Prof. Yehuda Kalay asked the question, “Why do people continue to go to movie theaters when movies are expensive and wide-screen TV and movies are available at home?” His answer was that the collective experience within the theater further heightens the emotional response of the viewers, regardless of whether there is personal contact among them. Kalay's comments are supported by Hanich (2010), who notes “When we sit in a movie theater, we sit there with others; when we watch a film with others, we experience it in a way that differs from watching it alone. In other words, the cinematic audience is always more than the sum of its individual viewers.”
Fig. 3. Cursed monoculture or beautiful patch of green?
352
D.E. Orenstein et al. / Computers, Environment and Urban Systems 54 (2015) 347–355
Fig. 4. The “perfect balance of humans and nature” or “a dump”?
While the size of the images seems to have heightened participants' emotional response, the group discussion also seemed to have had this effect. The technology of IVT facilitates a different group experience than other forms of visualization technologies. It is an experience of “besideness” or proximity; the whole group is surrounded by the same visual stimulus together (rather than each looking at his/her photograph or computer screen). When one participant draws attention to a certain point in the image, everyone else it is drawn to it, thereby providing an immediate experience of the scene together. For example, one of the most controversial scenes that catalyzed heated discussion was an image of old couches and tables distributed on a patch of dirt next to an olive orchard (Fig. 4). This scene was the most beloved by some participants and catalyzed comments such as “the perfect balance between nature and humans”; “I want to stop and eat pitta and labane (yoghurt) here”; “the couches lend a homey feeling to the place, and even though it looks a bit strange, it's a spot where I would be happy to sit and relax. The place is shady, and except for the road at the right side, it looks quiet there.” For other participants, the same image evoked the opposite sensation and they didn't agree with their fellow participants, claiming that: “The place looks like a dump.3 I don't like it”, or: “Is there even a trash can lining in that trash can?” A second example of this group experience was a passionate argument among landscape architects regarding the aforementioned pool collecting spring water. The architects argued among themselves about a seemingly minor detail of the picture, and then proceeded to point and scan across the photograph, referring point by point to perceived design flaws in an otherwise widely popular site among participants. The methodology of a focus group is used mainly for the purpose of understanding how knowledge, norms, and cultural meanings of a phenomenon (in our case, forest landscape) are constructed together, in a group. The use of focus group methodology with the collective experience provided by the IVT seems to have a synergistic effect on one another. 4.3. Isolation The fact that visualization directs the subject to a particular object or scene is noted as a disadvantage (Wergles & Muhar, 2009), but we suggest that it is also an advantage. The subjects are directed to a particular scene and due to the expanse of that scene, a focused, in-depth discussion can be generated. In combination with the impact of size, isolation within the theater, with only the panoramic image and the participants, prevents the subjects from distractions that would occur in the field and focuses their attention on the selected scene; the dark room with the huge photograph is the only stimulus. Although some of the younger participants became jumpy in their seats (and some older participants began to check their smart phones — to no avail, as there is no reception in the theater), we suggest that these same participants would have been even more distracted in an outside setting. The isolation within the theater allowed subjects to focus on the images and on the conversation. 3 The respondent used the Arabic/Hebrew slang “zoola”, referring to a small shack and assemblage of old chairs and couches for relaxing outdoors, in this case as a pejorative.
An additional, related, benefit of the IVT is that it is exciting (see the “wow-factor” above). Participants generally respond with anticipation as they enter the theater (even though the dimensions of the theater are, as noted, relatively modest). People generally seem to enjoy evaluating scenes and sharing their opinions (Pinto-Correia, Barroso, Surová, & Menezes, 2011), and virtual environments can augment positive emotions (Edsall & Larson, 2009). Relative to the potentially tedious process of filling in opinion surveys, based on our observations, visual assessment of immersive landscape scenes seemed to generate excitement among the participants. This excitement may translate into deeper engagement of participants in the visual and verbal content of the research. Along with the purported impact of size, the intense focus on the visual scene triggered other senses. Participants would speak of sounds and smells associated with the scene before them. When looking at an image of the collection pool, one respondent exclaimed, “I can almost smell the [Turkish] coffee brewing.” Another respondent noted regarding the picnic area in the olive grove, “this looks like a nice place to spend time with the family among the short trees — it feels very Mediterranean. It seems like there is shade, and the place is orderly.” Despite the fact that the participants were sitting in a darkened room, the intense and uninterrupted focus on a given image could stimulate the sensory responses – via memories of experiences – of being outdoors. 5. Discussion The primary question we address in this paper is whether the IVT, with its suggested advantages, provides added value to research on landscape preferences and perceptions and on cultural ES. Following use of the VIZ-Lab for hosting focus group discussions on the topic of natural landscape perceptions, we have identified qualities of this technology that may engage different stakeholders and help bring out their feelings and perceptions regarding diverse characteristics of the natural environment. In particular, we identify the size of the images, the social interaction and the isolation effect as potential catalysts to both deep engagement of participants with the landscape and deep and revealing discussions among participates. It seems that the combination of these three qualities, unique to the IVT, are interdependent and synergistic in providing rich insights into stakeholders' perception of landscape and the kind of cultural services that landscapes provide. While we have drawn corroborating evidence from the research literature to support these conclusions, follow up experimental research will be required to empirically confirm them. Current public policy and planning theory proscribes engaging communities and integrating them into the planning and management processes (Clark, 2011, Shipley & Utz, 2012) and visualization has been repeatedly cited as a communication tool for catalyzing this engagement (Bailey et al., 2001, Bell, 2001, Sheppard, 2001, Meitner, Gandy, & Sheppard, 2005, Lewis & Sheppard, 2006, Edsall & Larson, 2009, Larson & Edsall, 2010, Schroth, Hayek, Lange, Sheppard, & Schmid, 2011). We suggest that the combined strengths of the theater create a productive setting for both research and engaging stakeholder communities regarding questions of planning relevance (Edsall & Larson, 2009, Larson & Edsall, 2010). The collective experience in the lab facilitated a
D.E. Orenstein et al. / Computers, Environment and Urban Systems 54 (2015) 347–355
dialogue and exchange of opinions relating to positive and negative characteristics of the natural environments. This exchange allows us to explore the preferences and perspectives of the participants in a dynamic, revealing way. The theater environment can engage its audience and catalyzes emotional response and passionate (though civil) group discussion. The researcher (or planner or policy maker) can utilize such a setting for garnering insights on how the public (or publics) perceives and uses landscapes. Given the recent proliferation of interest in the study of cultural ES, much of which points to the importance of group deliberation and other social methods of research (Wilson & Howarth, 2002, Chan et al., 2012, Brown, 2013), the immersive theater offers exciting opportunities. The information yielded through focus group discussions in VIZ-Lab helps us understand what aspects of the natural environment and natural and cultural landscapes are valued (Tengberg et al., 2012), where trade-offs in service provision may exist, and how values differ between population groups and individuals (Zube & Pitt, 1981, Natori & Chenoweth, 2008). These will be explored in greater depth in subsequent articles. Here, we confirm the existence and significance of cultural ES as reflected in the main themes that arose in our focus group discussions: a place of both solitude and social interaction, a place of calm and relaxation, a place of cultural heritage and a place of exploration and scientific curiosity (Church et al., 2011, Sagie et al., 2013, Gould et al., 2015). There are legitimate criticisms of this technology with regard to the study of landscape perceptions. One critique of the IVT is that photographs or pictures projected on a computer screen could be equally or more efficient, considering that photographs are mobile. As such, more respondents could be surveyed more efficiently and for lower cost. Likewise, Paar (2006) suggests that very high level photo-realism is unnecessary for employing visualization methods for landscape planning (although he distinguishes this from the need for realistic representation of plants and habitats). While these critiques are legitimate, they may have less relevance for theoretical research than for applied professional purposes. In this study, we suggest that the quality of the discussion and the participants' attention to fine detail was increased by using high-definition images projected on a large screen. Due to the inductive structure of this research, such conclusions remain to be proven in a comprehensive comparative study, although they do have support from the literature, including studies that conclude that large screen viewing and IVT environments can augment emotional reactions (Reeves et al., 1999, Codispoti & De Cesarei, 2007, Fraser et al., 2012, Kim, Rosenthal, Zielinski, & Brady, 2012). Gruchalla (2004) found that users could perform complicated tasks more quickly and with higher success rates in an immersive virtual environment as compared to working on a desktop computer. Bowman and McMahan (2007) corroborated these results, concluding that “display size and resolution had a significant effect on task completion time, with a large, highresolution display producing the best results” (p. 42). Another critique is that the immersive theater cannot replace the multi-sensory experience of being in the field (Wergles & Muhar, 2009, Lindquist & Lange, 2014). This may be true, but not without an important caveat. Participants in our study often recognized places where they had had a positive social experience, often at a picnic site or spring. These would generally be positive, pleasant memories of a family gathering or a rest stop with friends during a hike. Our results suggest that the experience of immersion, with a large, high-definition image combined with prior experience in the area (or an area like it) triggered other sensory memories (hence references to smells and heat/cold). There is also support in the literature that landscape evaluations using wide-angle and panoramic photographs yielded results that were highly correlated with evaluations made in situ (Zube & Pitt, 1981, Meitner, 2004). We do not dispute the utility of other approaches to visualization, nor the need to conduct comparative landscape perception research in the field. Indeed, other methodologies can be utilized both within the theater and outside it, to supplement and/or verify insights from the
353
VIZ-Lab. For instance, using many small photographs can allow respondents to compare and order preferences efficiently, providing quick insight into a larger number of scenes and scenarios (Arriaza et al., 2004, Natori & Chenoweth, 2008). In-depth personal interviews using landscape visuals can be conducted in the IVT (utilizing the advantage of size) to more fully understand individuals' narratives, but using this method would lose the insights yielded via group discussions and revelations that arise from dialogue and argument. On-site evaluations (group or individual) provide a different set of perceptions that are not directed by visualization and that allow for much more freedom of response. Such activities can be conducted in conjunction with focus group discussion within the immersive theater; it is our intention, for example, to continue the current research with follow-up in-depth interviews on site. Employing this methodology will allow us to verify or dispute hypotheses proposed here regarding the utility of IVT. A final open question is whether the relative advantages outlined here justify the high initial construction and maintenance costs when compared to other visualization approaches (Danahy, 2001). Fraser et al. (2012) concluded with a similar open question as to whether the reported advantages of large-screen educational films justify the capital investment in the technologies that deliver them, and they call for further research to provide a more definitive answer. VR researchers suggest that there are advantages and disadvantages to the range of immersion technologies (at a range of prices), and that technologies should be selected according to particular research needs (Gruchalla, 2004, Bowman & McMahan, 2007). In the meantime, the use of the IVT is already providing initial insights into applied and theoretical knowledge regarding which aspects of the forest ecosystem provide cultural ecosystem services to local communities. Analysis of discussion protocol reveals recurring themes that are common among various community groups, as well as some crucial differences. We suggest that technology of visualization using high-definition photographs in an immersive environment assisted in accentuating focus group discussions, thereby highlighting the most significant social and cultural values that individuals and groups derive from the forest. Supplementary data to this article can be found online at http://dx. doi.org/10.1016/j.compenvurbsys.2015.10.004.
Acknowledgments We thank the anonymous reviewers, whose challenging and productive comments greatly strengthened the manuscript. We thank Tali Monderer and Jennifer Holzer for their research assistance, Haim Zinger for the wonderful photography, Doron Zur and the staff of the Technion VIZ-Lab for their technical support and Dafna FisherGewirtzman for keeping us moving forward. This research was sponsored by a grant from the Israel Ministry of Environmental Protection for research on post-fire restoration in the Carmel Forest (Grant #1257-2). The VIZ-Lab was constructed with Technion Start-Up Grants to new faculty.
References Arriaza, M., Cañas-Ortega, J.F., Cañas-Madueño, J.A., & Ruiz-Aviles, P. (2004). Assessing the visual quality of rural landscapes. Landscape and Urban Planning, 69(1), 115–125, http://dx.doi.org/10.1016/j.landurbplan.2003.10.029 Bailey, K., Brumm, J., & Grossardt, T. (2001). Towards structured public involvement in highway design: A comparative study of visualization methods and preference modeling using CAVE (casewise visual evaluation). Journal of Geographic Information and Decision Analysis, 5(1), 1–15. Bell, S. (2001). Landscape pattern, perception and visualisation in the visual management of forests. Landscape and Urban Planning, 54(1–4), 201–211, http://dx.doi.org/10. 1016/S0169-2046(01)00136-0 Bloor, M., Frankland, J., Thomas, M., & Robson, K. (2001). Focus groups in social research. London: SAGE Publications. Bowman, D.A., & McMahan, R.P. (2007). Virtual reality: How much immersion is enough? Computer, 40(7), 36–43, http://dx.doi.org/10.1109/MC.2007.257.
354
D.E. Orenstein et al. / Computers, Environment and Urban Systems 54 (2015) 347–355
Braat, L.C., & de Groot, R. (2012). The ecosystem services agenda: Bridging the worlds of natural science and economics, conservation and development, and public and private policy. Ecosystem Services, 1(1), 4–15, http://dx.doi.org/10.1016/j.ecoser.2012.07.011 Brooks, F.P. (1999). What's real about virtual reality? IEEE Computer Graphics and Applications, 19(6), 16–27, http://dx.doi.org/10.1109/38.799723. Brown, G. (2013). The relationship between social values for ecosystem services and global land cover: An empirical analysis. Ecosystem Services, 5(0), 58–68, http://dx. doi.org/10.1016/j.ecoser.2013.06.004 Brown, G., Montag, J.M., & Lyon, K. (2011). Public participation GIS: A method for identifying ecosystem services. Society & Natural Resources, 25(7), 633–651. http://dx.doi. org/10.1080/08941920.2011.621511. Chan, K.M.A., Guerry, A.D., Balvanera, P., Klain, S., Satterfield, T., Basurto, X., et al. (2012). Where are cultural and social in ecosystem services? A framework for constructive engagement. Bioscience, 62(8), 744–756, http://dx.doi.org/10.1525/bio.2012.62.8.7. Church, A., J. Burgess and N. Ravenscroft. 2011. Cultural services. Pp 633–692 in (eds.), UK National Ecosystem Assessment Technical Report. UNEP-WCMC. Cambridge. Clark, S.G. (2011). The policy process: A practical guide for natural resource professionals. New Haven: Yale University Press. Codispoti, M., & De Cesarei, A. (2007). Arousal and attention: Picture size and emotional reactions. Psychophysiology, 44(5), 680–686, http://dx.doi.org/10.1111/j.1469-8986. 2007.00545.x. Danahy, J.W. (2001). Technology for dynamic viewing and peripheral vision in landscape visualization. Landscape and Urban Planning, 54(1–4), 127–138, http://dx.doi.org/10. 1016/S0169-2046(01)00131-1 Daniel, T.C. (2001). Whither scenic beauty? Visual landscape quality assessment in the 21st century. Landscape and Urban Planning, 54(1–4), 267–281, http://dx.doi.org/10. 1016/S0169-2046(01)00141-4 Daniel, T.C., & Meitner, M.M. (2001). Representational validity of landscape visualizations: The effects of graphical realism on perceived scenic beauty of forest vistas. Journal of Environmental Psychology, 21(1), 61–72, http://dx.doi.org/10.1006/jevp.2000.0182 Daniel, T.C., Muhar, A., Arnberger, A., Aznar, O., Boyd, J.W., Chan, K.M.A., et al. (2012). Contributions of cultural services to the ecosystem services agenda. Proceedings of the National Academy of Sciences, 109(23), 8812–8819, http://dx.doi.org/10.1073/pnas. 1114773109. Duraiappah, A.K., & Rogers, D. (2011). The intergovernmental platform on biodiversity and ecosystem services: Opportunities for the social sciences. Innovation: The European Journal of Social Science Research, 24(3), 217–224, http://dx.doi.org/10. 1080/13511610.2011.592052. Edsall, R.M., & Larson, K.L. (2009). Effectiveness of a semi-immersive virtual environment in understanding human–environment interactions. Cartography and Geographic Information Science, 36(4), 367–384, http://dx.doi.org/10.1559/152304009789786317. Fagerholm, N., Käyhkö, N., Ndumbaro, F., & Khamis, M. (2012). Community stakeholders' knowledge in landscape assessments — Mapping indicators for landscape services. Ecological Indicators, 18(0), 421–433, http://dx.doi.org/10.1016/ j.ecolind.2011.12.004 Fraser, J., Heimlich, J.E., Jacobsen, J., Yocco, V., Sickler, J., Kisiel, J., et al. (2012). Giant screen film and science learning in museums. Museum Management and Curatorship, 27(2), 179–195, http://dx.doi.org/10.1080/09647775.2012.674322. Gee, K., & Burkhard, B. (2010). Cultural ecosystem services in the context of offshore wind farming: A case study from the west coast of Schleswig-Holstein. Ecological Complexity, 7(3), 349–358. Gould, R.K., Klain, S.C., Ardoin, N.M., Satterfield, T., Woodside, U., Hannahs, N., et al. (2015). A protocol for eliciting nonmaterial values through a cultural ecosystem services frame. Conservation Biology, 29(2), 575–586, http://dx.doi.org/10.1111/cobi.12407. Gruchalla, K. (2004). Immersive well-path editing: Investigating the added value of immersion. Proceedings of the 2004 Virtual Reality. Chicago, IL: IEEE, http://dx.doi.org/10.1109/ VR.2004.1310069. Guhathakurta, S., Kobayashi, Y., Patel, M., Holston, J., Lant, T., Crittenden, J., et al. (2009). Digital Phoenix Project: A multidimensional journey through time. In H. Hagen, S. Guhathakurta, & G. Steinebach (Eds.), Visualizing sustainable planning (pp. 159–184). Berlin Heidelberg: Springer. Hanich, J. (2010). Passions in Context. The Journal for the History and Theory of Emotions, 1(1), http://www.passionsincontext.de/index.php?id=544 Kim, K., Rosenthal, M.Z., Zielinski, D., & Brady, R. (2012). Comparison of desktop, head mounted display, and six wall fully immersive systems using a stressful task. Proceedings of the 2012 Virtual RReality SShort PPapers and PPosters (VRW). Costa Mesa, CA: IEEE, http://dx.doi.org/10.1109/VR.2012.6180922. Lange, E. (2001). The limits of realism: Perceptions of virtual landscapes. Landscape and Urban Planning, 54(1–4), 163–182, http://dx.doi.org/10.1016/S01692046(01)00134-7 Lange, E. (2002). Visualization in landscape architecture and planning: Where we have been, where we are now and where we might go from here. In E. Buhmann, U. Nothhelfer, & M. Pietsch (Eds.), Trends in GIS and virtualization in environmental planning and design (pp. 8–18). Heidelberg: Wichmann. Lange, E. (2011). 99 volumes later: We can visualise. Now what? Landscape and Urban Planning, 100(4), 403–406, http://dx.doi.org/10.1016/j.landurbplan.2011.02.016 Lange, E., & Bishop, I.D. (2005). Communication, perception and visualization. In I.D. Bishop, & E. Lange (Eds.), Visualization in landscape and environmental planning (pp. 3–22). Oxon, UK: Taylor and Francis. Larson, K.L., & Edsall, R.M. (2010). The impact of visual information on perceptions of water resource problems and management alternatives. Journal of Environmental Planning and Management, 53(3), 335–352, http://dx.doi.org/10.1080/09640561003613021. Lewis, J.L., & Sheppard, S.R.J. (2006). Culture and communication: Can landscape visualization improve forest management consultation with indigenous communities? Landscape and Urban Planning, 77(3), 291–313, http://dx.doi.org/10.1016/j. landurbplan.2005.04.004
Lindquist, M., & Lange, E. (2014). Sensory aspects of simulation and representation in landscape and environmental planning: A soundscape perspective. In A. Contin, P. Paolini, & R. Salerno (Eds.), Innovative technologies in urban mapping (pp. 93–106). Springer International Publishing. Luck, G.W., Chan, K.M.A., Eser, U., Gómez-Baggethun, E., Matzdorf, B., Norton, B., et al. (2012). Ethical considerations in on-ground applications of the ecosystem services concept. Bioscience, 62(12), 1020–1029, http://dx.doi.org/10.1525/bio.2012.62.12.4. MacEachren, A. M., Edsall, R., Haug, D., Baxter, R., Otto, G., & Masters, R. (1999). Virtual environments for geographic visualization: Potential and challenges. Proceedings of the ACM Workshop on New Paradigms in Information Visualization and Manipulation, Kansas City, KS (pp. 35–40). Maes, J., Egoh, B., Willemen, L., Liquete, C., Vihervaara, P., Schägner, J.P., et al. (2012). Mapping ecosystem services for policy support and decision making in the European Union. Ecosystem Services, 1(1), 31–39, http://dx.doi.org/10.1016/j.ecoser. 2012.06.004 Meitner, M.J. (2004). Scenic beauty of river views in the Grand Canyon: Relating perceptual judgments to locations. Landscape and Urban Planning, 68(1), 3–13, http://dx. doi.org/10.1016/S0169-2046(03)00115-4 Meitner, M.J., Gandy, R., & Sheppard, S.R.J. (2005). Reviewing the role of visualization in communicating and understanding forest complexity. Information Visualisation, 2005. Proceedings. Ninth International Conference on, http://dx.doi.org/10.1109/IV. 2005.110. Natori, Y., & Chenoweth, R. (2008). Differences in rural landscape perceptions and preferences between farmers and naturalists. Journal of Environmental Psychology, 28(3), 250–267, http://dx.doi.org/10.1016/j.jenvp.2008.02.002 Naveh, Z., & Carmel, Y. (2003). The evolution of the cultural Mediterranean landscape in Israel as affected by fire, grazing, and human activities. In S.P. Wasser (Ed.), Evolutionary theory and processes: Modern horizons (pp. 337–409). Netherlands: Kluwer Academic Publishers. Oh, K. (1994). A perceptual evaluation of computer-based landscape simulations. Landscape and Urban Planning, 28(2–3), 201–216, http://dx.doi.org/10.1016/01692046(94)90008-6 Orenstein, D.E., & Groner, E. (2014). In the eye of the stakeholder: Changes in perceptions of ecosystem services across an international border. Ecosystem Services, 8(0), 185–196, http://dx.doi.org/10.1016/j.ecoser.2014.04.004 Orenstein, D., & Groner, E. (2015). Using the ecosystem services framework in a longterm socio-ecological research (LTSER) platform: Lessons from the Wadi Araba Desert, Israel and Jordan. In R. Rozzi, F.S. ChapinIII, J.B. Callicott, S.T.A. Pickett, M.E. Power, J.J. Armesto, & R.H. MayJr. (Eds.), Earth stewardship (pp. 281–296). Springer International Publishing. Paar, P. (2006). Landscape visualizations: Applications and requirements of 3D visualization software for environmental planning. Computers, Environment and Urban Systems, 30(6), 815–839, http://dx.doi.org/10.1016/j.compenvurbsys.2005.07.002 Pinto-Correia, T., Barroso, F., Surová, D., & Menezes, H. (2011). The fuzziness of Montado landscapes: Progress in assessing user preferences through photo-based surveys. Agroforestry Systems, 82(2), 209–224, http://dx.doi.org/10.1007/s10457-010-9347-2. Reeves, B., Lang, A., Kim, E.Y., & Tatar, D. (1999). The effects of screen size and message content on attention and arousal. Media Psychology, 1(1), 49–67, http://dx.doi.org/ 10.1207/s1532785xmep0101_4. Reid, W.V., Mooney, H.A., Cropper, A., Capistrano, D., Carpenter, S.R., Chopra, K., et al. (2005). Ecosystems and human well-being: Synthesis. In J. Sarukhan, & A. Whyte (Eds.), Millennium Ecosystem Assessment (pp. 155). Washington D.C: World Resources Institute. Ribe, R.G. (1989). The aesthetics of forestry: What has empirical preference research taught us? Environmental Management, 13(1), 55–74, http://dx.doi.org/10.1007/ BF01867587. Sagie, H., Morris, A., Rofè, Y., Orenstein, D.E., & Groner, E. (2013). Cross-cultural perceptions of ecosystem services: A social inquiry on both sides of the Israeli–Jordanian border of the Southern Arava Valley Desert. Journal of Arid Environments, 97(0), 38–48, http://dx.doi.org/10.1016/j.jaridenv.2013.05.007 Schroth, O., Hayek, U.W., Lange, E., Sheppard, S.R.J., & Schmid, W.A. (2011). Multiple-case study of landscape visualizations as a tool in transdisciplinary planning workshops. Landscape Journal, 30(1), 53–71, http://dx.doi.org/10.3368/lj.30.1.53. Shafer, E.L., Jr., & Brush, R.O. (1977). How to measure preferences for photographs of natural landscapes. Landscape Planning, 4(0), 237–256, http://dx.doi.org/10.1016/03043924(77)90027-2 Sheppard, S.R.J. (2001). Guidance for crystal ball gazers: Developing a code of ethics for landscape visualization. Landscape and Urban Planning, 54(1–4), 183–199, http://dx. doi.org/10.1016/S0169-2046(01)00135-9 Sheppard, S.R.J. (2005). Validity, reliability and ethics in visualization. In I.D. Bishop, & E. Lange (Eds.), Visualization in landscape and environmental planning (pp. 79–97). London: Taylor & Francis. Shipley, R., & Feick, R. (2009). A practical approach for evaluating cultural heritage landscapes: Lessons from rural Ontario. Planning Practice and Research, 24(4), 455–469. http://dx.doi.org/10.1080/02697450903327113. Shipley, R., & Utz, S. (2012). Making it count: A review of the value and techniques for public consultation. Journal of Planning Literature, 27, 22–42, http://dx.doi.org/10. 1177/0885412211413133. Spangenberg, J.H., & Settele, J. (2010). Precisely incorrect? Monetising the value of ecosystem services. Ecological Complexity, 7(3), 327–337, http://dx.doi.org/10.1016/j. ecocom.2010.04.007 Steinitz, C. (1990). Toward a sustainable landscape with high visual preference and high ecological integrity: The loop road in Acadia National Park, U.S.A. Landscape and Urban Planning, 19(3), 213–250, http://dx.doi.org/10.1016/0169-2046(90)90023-U Strauss, A.L. (1987). Qualitative analysis for social scientists. Cambridge, UK: Cambridge University Press.
D.E. Orenstein et al. / Computers, Environment and Urban Systems 54 (2015) 347–355 Strauss, A.L., & Corbin, J. (1990). Basics of qualitative research: Grounded theory procedures and techniques. Newbury Park, CA: Sage. Tal, A. (2013). All the trees of the forest. New Haven, CT: Yale University Press. Tengberg, A., Fredholm, S., Eliasson, I., Knez, I., Saltzman, K., & Wetterberg, O. (2012). Cultural ecosystem services provided by landscapes: Assessment of heritage values and identity. Ecosystem Services, 2(0), 14–26, http://dx.doi.org/10.1016/j.ecoser.2012.07.006 Termorshuizen, J., & Opdam, P. (2009). Landscape services as a bridge between landscape ecology and sustainable development. Landscape Ecology, 24(8), 1037–1052, http:// dx.doi.org/10.1007/s10980-008-9314-8. Tilley, C. (1994). A phenomenology of landscape: Places, paths and monuments. Oxford, UK: Berg. Wergles, N., & Muhar, A. (2009). The role of computer visualization in the communication of urban design — A comparison of viewer responses to visualizations versus on-site visits. Landscape and Urban Planning, 91, 171–182. White, D.D., Wutich, A., Larson, K.L., Gober, P., Lant, T., & Senneville, C. (2010). Credibility, salience, and legitimacy of boundary objects: water managers' assessment of a
355
simulation model in an immersive decision theater. Science and Public Policy, 37(3), 219–232, http://dx.doi.org/10.3152/030234210×497726. Wilson, M.A., & Howarth, R.B. (2002). Discourse-based valuation of ecosystem services: Establishing fair outcomes through group deliberation. Ecological Economics, 41(3), 431–443. Zube, E.H. (1984). Themes in landscape assessment theory. Landscape Journal, 3(2), 104–110, http://dx.doi.org/10.3368/lj.3.2.104. Zube, E.H., & Pitt, D.G. (1981). Cross-cultural perceptions of scenic and heritage landscapes. Landscape Planning, 8(1), 69–87, http://dx.doi.org/10.1016/0304-3924(81)90041-1 Zube, E.H., Sell, J.L., & Taylor, J.G. (1982). Landscape perception: Research, application and theory. Landscape Planning, 9(1), 1–33, http://dx.doi.org/10.1016/03043924(82)90009-0