Input DM EMI Filter Design of Interleaved CRM Boost PFC Converter with Coupled Inductor Fei Yang Student member, Xinbo Ruan Senior member, Qing Ji
Zhihong Ye Member
Department of Automation college Nanjing University of Aeronautics and Astronautics, Nanjing, 210016, Jiangsu, China
[email protected]
Lite-On Technology Corp., Nanjing, 210019, Jiangsu, China
[email protected]
Abstract –The interleaved Boost power factor correction (PFC) converter operating in critical current mode (CRM) features high input power factor, high efficiency and small magnetic components. If the inductors are coupled, the turns number can be reduced, but the input current ripple is increased. This paper discusses the two-phase interleaved CRM Boost converter with an inversely coupled inductor. The coupling effect on the input differential mode (DM) electromagnetic interface (EMI) filter is analyzed and the relations between input current ripple and DM noise are presented. The worst case of DM noise can be obtained by analyzing the input current ripple and experimental results verify the conclusions.
I.
INTRODUCTION
The interleaved boost converter operating in critical current mode (CRM) is widely used in power factor correction (PFC) at medium and high power applications for its high power factor (PF), high efficiency, low input current ripple, and low cost [1]–[3]. The coupled inductor has been implemented in interleaved buck converter [4]–[6], and it exhibits improved performance, such as increased efficiency, smaller inductor size, low core and copper losses and reduced input and output filters. For the similarity between buck and boost converter, the coupled inductor can also be used in interleaved boost PFC converter [7]–[9]. Reference [9] shows that the inversely coupled inductor used in interleaved CRM boost PFC converter can reduce the inductor turns number, but the input current ripple is enlarged. That means the coupled inductor design should consider the coupling effects on the input differential mode (DM) electromagnetic interface (EMI) filter to achieve a total magnetic components optimization. The objective of this paper is to investigate the input DM EMI filter design of two-phase interleaved CRM boost PFC converter with an inversely coupled inductor. Firstly, both the switching frequency and ripple of input current are analyzed. Then, the calculation approach of the input current ripple spectrum is introduced and the spectrums of the input current ripple of coupled and non-coupled cases are obtained. From the analysis of the input current ripple and its spectrum, the DM EMI filter can be designed based on the input current ripple. Finally, some experimental
978-1-4577-0541-0/11/$26.00 ©2011 IEEE
2614
results verify the theoretical analysis. II.
INTERLEAVED CRM BOOST PFC CONVERTER WITH COUPLED INDUCTORS
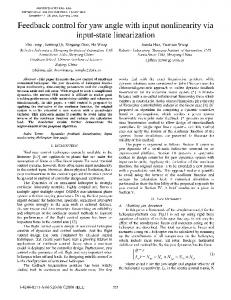
A. Coupling Effects Fig. 1 shows the interleaved CRM boost PFC converter with an inversely coupled inductor [9], where vin is the input voltage, vg is the rectified input voltage, and Vo is the output voltage. The general circuit equation is diL1 diL 2 ⎧ ⎪⎪v1 = L1 dt − M dt (1) ⎨ ⎪v = L diL 2 − M diL1 2 ⎪⎩ 2 dt dt where v1 and v2 are the voltages applied on the corresponding windings, iL1 and iL2 are the inductor currents, L1 and L2 are the self inductance of each winding, M is the mutual inductance. If iL1=iL2, (1) can be written as v1=(L1−M)diL1/dt and the equivalent inductance is L1−M. If iL1=−iL2, the inverse coupling shows a large inductance L1+M. For the two phase inductor currents at switching frequency and its odd harmonics, iL1=−iL2.
Fig. 1. Schematic diagram of two-phase interleaved Boost PFC converter.
It is assumed that the structure of the two windings is symmetric (L1=L2=Lcp) and the coupling coefficient α=M /Lcp. Based on the voltages applied on the windings, the steady-state inductor currents and the input current waveforms are depicted in Fig. 2. As seen, Leq1 and Leq3 determine the peak inductor current respectively when d0.5. Leq2 determine the input current ripple. The equivalent inductance expressions are
voltage, ω=2πfline and the fline is the line voltage frequency. The duty cycle in each switching cycle is vg 2Vin sin ωt , (4) d = 1− = 1− Vo Vo which varies in a half line. For d0.5, the switch OFF time can be calculated as Leq3iL _ pk toff = . Vo − vg
B. Switching Frequency of Input Current Ripple The peak current of the coupled inductor is twice its average value in Fig. 2 [9]. Define Pin as the total input power of the converter, so the input power of each phase is Pin / 2. Thus, the peak current of the coupled inductor can be expressed as P P iL _ pk = 2iL _ avg = 2 2 in sin ωt = 2 in sin ω t (3) Vin 2Vin where iL_pk and iL_avg are the peak and average value of inductor current respectively, Vin is the rms value of input
(7)
(8)
Substitution of (3) and vg= 2Vin sin ω t into (16) yields ⎛ 1 − d ⎞ Pin Leq3 toff = ⎜ . ⎟ 2 ⎝ d ⎠ Vin The switching frequency is dVin2 1 1− d fs = = = . ts toff Pin Leq3
(9)
(10)
Substituting (2) into (7) and (10) respectively, the input current ripple frequency, twice of the inductor current
(a) d0.5 Fig. 3. Equivalent inductances.
frequency, can be expressed as ⎧ 2V 2 ⎡ − (α + 1) d 2 + d ⎤ ⎪ in ⎢ ⎥ ( d ≤ 0.5 ) ⎪⎪ Pin Lcp ⎢⎣ (1 − α 2 ) (1 − d ) ⎥⎦ fs_in = 2 f s = ⎨ . ⎪ 2Vin2 ⎡ (1 + α ) d − α ⎤ ( d > 0.5) ⎪ ⎢ ⎥ 2 ⎪⎩ Pin Lcp ⎣ 1 − α ⎦
⎧ (Vo − vg ) (0.5 − d ) (d ≤ 0.5) ⎪2 Leq2 fs ⎪ Δiin = ⎨ . ⎪2 vg (d − 0.5) (d > 0.5) ⎪ L fs ⎩ eq2
(11)
From (12) and (13), the ratio of input current ripple and inductor current ripple is ⎧ (1 − 2d )(1 + α ) (d ≤ 0.5) ⎪ Δiin ⎪ (1 − d ) − α d =⎨ , (14) ΔiL ⎪ ( 2d − 1)(1 + α ) > ( d 0.5) ⎪ d − α (1 − d ) ⎩ and it is depicted in Fig. 5. The input current ripple is reduced near d=0.5 by interleaving. For a given duty cycle, strong coupling leads to high input current ripple. Since the inductor current ripple is fixed as (3) for coupled and non-coupled cases, the input current ripple in a half line cycle is increased by coupling from (14) as shown in Fig. 6. From the Fourier analysis for triangle current wave, the harmonic magnitude is proportional to the current ripple, so the DM noise may increase by coupling.
If the coupled inductor is well designed, Lcp and α are fixed, for a given Pin and Vin, fs_in varies with d in a half line period. Normally, in a non-coupled case, the switching frequency, proportional to d, is low at the peak instantaneous input voltage and high at the zero crossing. In a coupled case, the switching frequency is reduced near d=0.5, and increased near d=0 and d=1. So, the final profile of switching frequency of input current ripple with coupled inductor in a half line cycle is shown as Fig. 4, where Vo=400 V, Pin=300 W, Lcp=370 μH. C. Input Current Ripple From Fig. 2, the inductor current ripple is ⎧ vg d (d ≤ 0.5) ⎪ ⎪ Leq1 f s ΔiL = ⎨ . ⎪Vo − vg (1 − d ) (d > 0.5) ⎪ L fs ⎩ eq3
(13)
D. Input Current Ripple Variation at fs_in=150 kHz Generally, the DM noise resulting from input current ripple dominates the low frequency side (150 kHz~1MHz), and based on the experimental results [10], the most critical point is fs_in=150 kHz. If minimum switching frequency is 45 kHz for each phase, the minimum input current ripple
(12)
The input current ripple, which is the sum of the two inductor current ripple, can be described as
frequency fs_in_min, occurring at d = 1 − ( 2Vin Vo ) when fs_in 1800 (kHz) α=0
1600
α=0.3 α=0.5 800 α=0.7 α=0.8 400 0 0
(b) Vin= Vo
(a) Vin=85 V
(2 2 )
2
4
t (ms)
6
V(c) Vin=265 V
Input current ripple evonlope (A)
Fig. 4. Calculated input current switching frequency in a half line period.
Fig. 5. Ratio of input and inductor ripple current.
8
Non-coupled case
Input current average value (inductor current ripple)
6
Coupled case
4 2 0
0
2.5
5
t (ms)
7.5
10
(a) Vin=110 V (b) Vin=220 V Fig. 6. Calculated waveforms of the input current.
2616
8
10
coupling coefficient is not very high, is shown in Fig. 7.
the load is reduced, the input current ripple decreases and the 150 kHz points are approaching the instantaneous peak input current ripple simultaneously. Thus, the maximum value of input current ripple at 150 kHz may not be sawn at full load, which sees such maximum value in high line. For a given input voltage, varying with input power, the duty cycle expression when fs_in=150 kHz can be obtained by MathCAD derivation, and the corresponding input current ripple can be calculated as Fig. 9. If the duty cycle is beyond the duty cycle range for a given Vin, or there is no 150 kHz point in a half line, the value is set zero. For the low line, with the load reduced, the current ripple is increased initially and then decreased, and the maximum input current ripple for different input voltages around 85 V are nearly the same. For the high line, the current ripple decreases following the load reduction, so the full load is the worst case. Those abovementioned rules are valid for both non-coupled and coupled cases.
Fig. 7. Minimum input current ripple switching frequency.
From Fig. 7, fs_in=150 kHz may occur near 85 V or 265 V with varied input powers. Considering the input current ripple varies with time and input power simultaneously, the maximum value of input current ripple of 150 kHz cannot be found easily. From (3) and (14), the input current ripples, varying with input voltage, input power, and coupling coefficients, are shown in Fig. 8. As seen, at the low line, as
(a) Vin=85 V, α=0
(b) Vin=265 V, α=0
(c) Vin=85 V, α=0.33 (d) Vin=265 V, α=0.33 Fig. 8. Calculated input current ripple in a half line varied with input power and coupling coefficient.
(a) non-coupled case α=0 (b) coupled case α=0.33 Fig. 9. Input current ripple of fs_in=150 kHz varied with input power.
2617
⎧ a (τ , n) = ( 2 t (τ ) ) ts_in (τ ) Δi sin(2π nf (τ )t ) dt s_in in s_in ∫0 ⎪ n ts_in (τ ) ⎪ Δiin cos(2π nfs_in (τ )t ) dt ⎨bn (τ , n) = ( 2 ts_in (τ ) ) ∫0 . (17) ⎪ ⎪cn (τ , n) = an2 (τ , n) + bn2 (τ , n) ⎩ iin (τ , n) = cn (τ , n) The DM noise which is the voltage applied to a 50 Ω resistor will be transmitted to the receiver, and processed by an intermediate frequency (fIF) filter which attenuates a lot of signals except near fIF. The output of the filter is [10]
The input DM EMI filter is designed based on the EMI receiver test results. To predict the design point of the filter based on the input current ripple, the relations between the input current ripple and results from the EMI receiver should be revealed. III.
INPUT DM EMI FILTER DESIGN
A. Calculation Methods of Input Current Spectrums There are two ways of analyzing the input current spectrum: (1) write the analytic expressions of the input current ripple firstly, then, based on the Fourier transform (FT) and fast Fourier transform (FFT), the magnitude of each frequency from line frequency to high switching frequency and their harmonics can be calculated; (2) based on the EMI receiver model, the Peak value (PK), Average value (AV) and Quasi-peak value (QP) of each frequency can be calculated. Both methods have different calculation procedures, so their results are different. Since the analytic input current expression in a half line cycle with a varied frequency control is difficult to write, the second method is chosen to calculate the input current ripple spectrum. Reference [10] gives a guide line to calculate the inductor current spectrum of CRM boost PFC converter based on a receiver model. The same concept is used to calculate the input current ripple spectrum of two-phase interleaved CRM boost PFC converter with an inversely coupled inductor. From Fig. 2 and aforementioned equations, the input current ripple for d ≤ 0.5 in a switching cycle can be expressed as ⎧ (1 − 2d )Vo P V (1 − α )(1 − d ) t + in 2o (0 ≤ t < 2dts_in ) ⎪ 2Vin 1 − (α + 1) d ⎪ (1 − α ) Lcp Δiin = ⎨ ⎪ −2dVo t + PinVo ( 3 + α )(1 − d ) (2dt ≤ t ≤ t ) s_in s_in ⎪ (1 − α ) L 2Vin2 1 − (α + 1) d cp ⎩
⎛ ⎞ f − f IF −⎜ ⎜ 4.5⋅103 ln 2 ⎟⎟ ⎝ ⎠
2
. (18) vDM (τ , n, f IF ) = ( 50 ⋅ iin (τ , n) ) e Then the signals are sent to the envelop detector to get the envelop of fIF in a half line cycle as shown in N
venvolop (t , f IF ) = ∑ vDM (t , n, f IF )
(19)
n =1
where n is the harmonic order. Then, the envelop is processed by different detectors for PK, QP and AV. Since the envelop of fIF in a half line cycle is plus and discontinuous for CRM, the PK is close to QP [11]. We choose the PK to be the magnitude of fIF for simplicity as vPK ( f IF ) = max ⎡⎣ venvolop (t , f IF ) ⎤⎦ . (20) As fIF sweeps from 150 kHz to 1 MHz, the spectrum of the input current ripple can be obtained. B. Calculated Input Current Spectrums The DM noise at fs_in=150 kHz, varying with input power, is shown in Fig. 10. As seen, the maximum value matches the input current ripple in Fig. 9 substantially.
(15) and for d > 0.5 it is ⎧ 2(1 − d )Vo P V (1 − d ) (1 − α ) t + in 2o ⎪ 2Vin (1 + α ) d − α ⎪ (1 − α ) Lcp ⎪ ⎡⎣0 ≤ t < ( 2d − 1) ts_in ⎦⎤ ⎪ Δiin = ⎨ . (16) ⎪ (1 − 2d )Vo t + PinVo d + α ( 3d − 2 ) ⎪ (1 − α ) L 2Vin2 (1 + α ) d − α cp ⎪ ⎪ ⎡⎣( 2d − 1) ts_in ≤ t < ts_in ⎤⎦ ⎩ For a given input power Pin and input voltage Vin, the duty cycle d and switching period ts_in, at any time point τ in a half line, can be calculated, and the corresponding fundamental and high order harmonics magnitudes of the input current ripple can be calculated by Fourier analysis as
(a) non-coupled case α=0 DM noise 180 PK value (dBμV) Vin=85 V 145 Vin=90 V Vin=95 V 110 Vin=255 V Vin=260 V Vin=265 V
75 40 150
200
Pin (W)
250
300
(b) coupled case α=0.33 Fig. 10. Input current high noise at fs_in=150 kHz varied with input power.
2618
DM noise PK value (dBμV)
DM noise PK value 180 (dBμV) Vin=85 V, Pin=195 W 145 Vin=90 V, Pin=220 W 110 Vin=95 V, Pin=244 W 75 Vin=100 V, Pin=270 W
40 100k
(a) Vin=85 V, α=0
(b) Vin=265 V, α=0
(c) Vin=85 V, α=0.33 (d) Vin=265 V, α=0.33 Fig. 11. Calculated spectrums of the input current with coupled and non-coupled cases.
150k
f (Hz)
1M
(a) non-coupled case α=0
(b) coupled case α=0.33 Fig. 12. Input current ripple spectrum when the PK value at fs_in=150 kHz is the highest
500 kHz; The power devices and components of the boost converter are listed below: ·Boost power switch: 2SK3569 (600 V, 10 A); ·Boost diode: MUR460 (600 V, 4 A); ·Boost inductor: non-coupled inductor, Lcp=360 μH and Nnc=74; coupled case, Lcp=352 μH, α=0.33, and Ncp=63. The total core weights are the same for both cases. ·control IC: CM6561 (Champion). Fig. 14 and Fig. 15 show the PK value of the input current spectrums at different input voltages with varied input powers when the inductors are non-coupled (α=0) and coupled (α=0.33), respectively. Although the test results did not match the calculated value very well, the qualitative variation is basically valid. In Fig. 14, at 85 V, with the increased load, 150 kHz occurs near 150 W, and then the PK values drop. For 90 V, 100 V and 110 V, with load increasing, the PK values at 150 kHz rise initially, and get the maximum point at 170 W, 210 W and 240 W, respectively, and then they drop. For 120 V and 220 V, the PK values at 150 kHz rise with load increasing, and the maximum values occur at full load. The variation is both valid for non-coupled and coupled cases. Selected conditions with the highest PK values at 150 kHz are depicted in one figure as shown in Fig. 16. It is shown that the profiles and the maximum values share the same character. Thus, we can design the DM EMI filter based on any of these conditions. Since the input DM EMI filter is designed based on QP limit, two typical spectrums of QP value under aforementioned conditions in non-coupled and coupled
Fig. 11 shows the DM noise spectrums of 85 V and 265 V in different input powers in coupled and non-coupled cases, and the worst cases are 195 W and 300 W, respectively, which match the maximum input current ripple conditions shown in Fig. 9. The DM noise spectrums at conditions under which the input current ripple at 150 kHz is the highest are shown in Fig. 12. Apparently, the spectrums are basically the same, and so is the value at 150 kHz. And coupling enlarges the PK value by 3 dBμV. IV. EXPERIMENTAL RESULTS A 300 W two-phase interleaved CRM boost PFC converter is constructed to verify the analysis above. The output voltage is set at 390 Vdc, the minimum frequency is 45 kHz, as shown in Fig. 13.
(a) inductor photos (b) prototype photos Fig. 13. Coupled inductor and the prototype photos.
The specifications of the prototype are as follows: · input voltage: vin = 85 ~ 265 Vac / 50 Hz; · output voltage: Vo = 390 Vdc; · rated output power: Po = 300 W; · switching frequency of Boost PFC converter: 45 kHz ~ 2619
DM noise PK value (dBμV)
(b) Vin=90 V, α=0
DM noise PK value (dBμV)
(a) Vin=85 V, α=0 120
300 W
100
120 100
80
80
60
60
40
40
100k
(d) Vin=110 V, α=0
(c) Vin=100 V, α=0.33
270W 240W 210W 170W 150W
f (Hz)
1M
100k
(e) Vin=120 V, α=0 Fig. 14. Test results of the input current spectrums with non-coupled inductor.
(a) Vin=85 V, α=0.33
(b) Vin=90 V, α=0.33
(a) Vin=110 V, α=0.33
(b) Vin=120 V, α=0.33 Fig. 15. Test results of the input current spectrums with coupled inductor.
270W 240W 210W 170W
QP_limit AV_limit
f (Hz)
1M
(f) Vin=220 V, α=0.33
(c) Vin=100 V, α=0.33
(c) Vin=220 V, α=0.33
critical point is the value at fs_in=150 kHz, the conditions which have the maximum input current ripple at 150 kHz are also the worst case of the input current spectrums, and the spectrums of such conditions can be used to predict the DM EMI filter corner frequency. The maximum input current ripples of 150 kHz at different input voltages, depending on a specific input power, are the same, and so is the value at 150 kHz in corresponding spectrums. When we design the DM EMI filter, the spectrum at the worst condition of one input
cases are selected separately for comparison as shown in Fig. 17. As seen, the value at 150 kHz increased by 3 dBμV with coupled inductors (α=0.33). That means the corner frequency and the DM inductance increase respectively. V.
300 W
CONCLUSION
In this paper, the coupled inductor effects on the ripple and switching frequency of the input current of interleaved CRM Boost PFC converter with a coupled inductor are analyzed for the design of the input DM EMI filter. If the 2620
(a) non-coupled case α=0 (b) coupled case α=0.33 Fig. 16. Test results of the input current ripple spectrums.
[4] P.L. Wong, P. Xu, P. Yang, and F.C. Lee, “Performance [5]
[6] [7] Fig. 17. Comparison of input current spectrums between coupled and non-coupled cases.
[8]
voltage, normally at the low line, can be chosen, and substantial repeated tests can be skipped.
[9]
REFERENCES [1] Meichael S. Elmore, “Input Current Rippled Cancellation in Synchronized, Parallel Connected Critically Continuous Boost Converters,” in Proc. IEEE Applied Power Electronics Conf., San Diego, CA, March 1996, pp. 152–158. [2] T Ishii and Y Mizutani, “Power Factor Correction using Interleaving Technique for Critical Mode Switching Converters,” in Proc. IEEE Power Electronics Specialists Conf., Fukuoka, Japan, May 1998, pp. 905–910. [3] J.P. Noon, “Designing High-Power Factor Off-Line Power Supplies,” Texas Instruments Power Supply Design Seminar, 2003, SEM-1500.
[10] [11]
2621
Improvements of Interleaving VRMs with Coupling Inductors,” IEEE Trans. on Power Electronics, vol. 16, no. 4, pp. 499–507, 2001. J. Li, C.R. Sullivan, and A. Schultz, “Coupled Inductor Design Optimization for Fast-Response Low-Voltage DC-DC Converters,” in Proc. IEEE Applied Power Electronics Conf., Dallas, TX, March 2002, pp. 817–823. P Zumel, O Garcia, J.A. Cobos, and J Uceda, “Magnetic Integration for Interleaved Converters,” in Proc. IEEE Applied Power Electronics Conf., Miami Beach, FL, February 2003, pp. 1143–1149. H.B. Shin,, J.G. Park, S.K. Chung, H.W. Lee, and T.A. Lipo, “Generalized Steady-State Analysis of Multiphase Interleaved Boost Converter with Coupled Inductors,” in Proc. IEE Electronics Power Application, vol. 152, no. 3, pp. 584-594, 2005. Wei Wen, Yim-Shu Lee, “A Two-Channel Interleave Boost Converter with Reduced Core Loss and Copper Loss,” in Proc. IEEE Power Electronics Specialists Conf., Aachen, Germany, June 2004, pp. 1003–1009. Fei Yang, Xinbo Ruan, Yang Yang and Zhihong Ye, “Design Issues of Interleaved Critical Conduction Mode Boost PFC Converter with Coupled Inductor,” in Proc. IEEE Energy Conversion Congress and Exposition, 2010, pp. 2245–2252. Zijian Wang, Shuo Wang, Chuanyun Wang, F.C. Lee, Pengju Kong, “DM EMI noise prediction in constant on-time PFC,” in Proc. IEEE Energy Conversion Congress and Exposition, 2009, pp. 3437–3442. EN55022: Limits and Methods of Measurement of Radio Disturbance Characteristics of Information Technology Equipment, European, European Norm Standard, 1994.