AbstractâFor a three-phase buck-type pulsewidth modulation rectifier input stage of a high-power telecommunications power supply module, a ...
IEEE TRANSACTIONS ON INDUSTRIAL ELECTRONICS, VOL. 53, NO. 5, OCTOBER 2006
1649
Differential Mode Input Filter Design for a Three-Phase Buck-Type PWM Rectifier Based on Modeling of the EMC Test Receiver Thomas Nussbaumer, Member, IEEE, Marcelo Lobo Heldwein, Student Member, IEEE, and Johann W. Kolar, Senior Member, IEEE
Abstract—For a three-phase buck-type pulsewidth modulation rectifier input stage of a high-power telecommunications power supply module, a differential-mode (DM) electromagnetic compatibility (EMC) filter is designed for compliance to CISPR 22 Class B in the frequency range of 150 kHz–30 MHz. The design is based on a harmonic analysis of the rectifier input current and a mathematical model of the measurement procedure including the line impedance stabilization network (LISN) and the test receiver. Guidelines for a successful filter design are given, and components for a 5-kW rectifier prototype are selected. Furthermore, formulas for the estimation of the quasi-peak detector output based on the LISN output voltage spectrum are provided. The damping of filter resonances is optimized for a given attenuation in order to facilitate a higher stability margin for system control. Furthermore, the dependence of the filter input and output impedances and the attenuation characteristic on the inner mains impedance are discussed. As experimentally verified by using a three-phase common-/Differential-Mode separator, this procedure allows accurate prediction of the converter DM conducted emission levels and therefore could be employed in the design process of the rectifier system to ensure compliance to relevant EMC standards. Index Terms—Electromagnetic compatibility (EMC), input filter design, pulsewidth modulation (PWM) rectifier, test receiver.
I. I NTRODUCTION
T
HERE are three main reasons for employing input filters for pulsewidth modulation (PWM) rectifier systems with impressed output current: 1) to ensure sinusoidally shaped input currents by filtering the switching-frequency harmonics of the pulse-shaped rectifier input currents; 2) to prevent electromagnetic interference of the considered power electronic converter with electronic systems present in the neighboring environment; and 3) to avoid disturbance of the power converter operation by sources of electromagnetic noise in the surrounds [1], [2]. With this aim, international organizations have defined standards, which have to be considered when designing the electromagnetic compatibility (EMC) filter of a power electronic system [3]. However, inserting an input filter to a converter takes influence on the function, stability, and size
Manuscript received February 22, 2005; revised August 26, 2005. Abstract published on the Internet July 14, 2006. The authors are with the Power Electronic Systems Laboratory, Swiss Federal Institute of Technology, 8092 Zurich, Switzerland (e-mail: kolar@ lem.ee.ethz.ch). Digital Object Identifier 10.1109/TIE.2006.881988
of the whole system. Therefore, for the input filter design, the following design targets can be formulated: 1) fulfillment of international EMC standards on conducted emissions that consist of a differential-mode (DM) and a common mode (CM) part; 2) limitation of the physical size/energy stored in the filter components; 3) sufficient passive damping in order to avoid oscillations for no-load operation; 4) minimum losses in passive damping elements; 5) minimization of input current fundamental displacement factor (cos φ1 ); 6) avoidance of filter resonances at multiples of the switching frequency; 7) minimization of the filter output impedance in order to ensure system stability and minimize control design restrictions; and 8) minimization of the filter costs. Obviously, the requirements are partially conflicting and therefore cannot all be met at the same time. Additionally, the following aspects have to be considered: 1) uncertainty in the mains impedance could shift resonant frequencies or introduce new resonant circuits with low damping; 2) different filter topologies can be realized for fulfilling an attenuation requirement; 3) a modeling of the EMC test receiver in the frequency and the time domain is necessary for predicting the quasipeak (QP) measurement results; 4) availability of merely certain discrete capacitor values complicates a filter optimization procedure; 5) the filter has influence on the overall system control stability; 6) prediction of the high-frequency filter behavior is influenced/determined by parasitics of the filter elements. In the past, the performance and stability of input filters for dc–dc converters were investigated in numerous publications [4]–[12]. However, as stated in [13], the issues in designing an EMC filter for ac–dc three-phase power are different and more complex than those for dc–dc converters. Certain aspects in the filter design of three-phase circuits were investigated. In [14], sufficient stability criteria for three-phase circuits were formulated. In [15], an optimization procedure (concerning
0278-0046/$20.00 © 2006 IEEE
1650
IEEE TRANSACTIONS ON INDUSTRIAL ELECTRONICS, VOL. 53, NO. 5, OCTOBER 2006
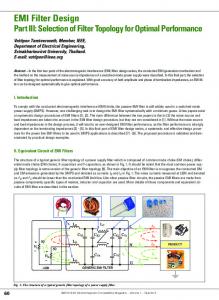
the total harmonic distortion of the input current) for a onestage filter for ac–dc converters has been proposed. In [13] and [16], multistage filters were designed and compared regarding input displacement factor and system stability. In [17], coupled inductors were employed for improving input filter characteristics. In [18], guidelines for selecting an appropriate filter structure and the advantages of multiple filter stages were given. However, none of these publications has presented a general filter design and/or optimization procedure that takes the aforementioned design tasks into account. Furthermore, the EMC test process has not been included in the filter design, which, however, takes significant influence on the measurement results and therefore on the required attenuation and the characteristics of the input filter. In [19], it was found that neglecting the measurement process leads to a discrepancy between the predicted and measured conducted emission (CE) levels. In this paper, a filter design procedure that includes the modeling of the EMC test receiver for QP measurements is presented. This enables a prediction of the measurement result, which gives the basis for the calculation of the required attenuation and the design of the input filter. This is an important step for virtual prototyping and has not been treated in literature so far. Furthermore, guidelines for the dimensioning of filter components are given in order to fulfill the design targets previously mentioned. In order to focus on the essentials, the proposed input filter design procedure is restricted to the following points: 1) Only DM noise emissions are taken into account since they are mainly determining the volume, the power factor, and the stability of the overall system. The CM filter design is then done in a separate step, which shall not be discussed here. By using a three-phase CM/DM noise separator [20], the two designs can be evaluated separately. 2) The parasitics of the components are not considered in the design step in order to simplify the procedure. Since the design method is based on the analysis of the noise emission of the first switching-frequency harmonic present within the measurement range, i.e., at 150 kHz, where parasitics do not have influence yet, this does not represent any deficit. Furthermore, the layout of the filter elements is not considered here since this will only take influence for frequencies above 3 MHz and will not have any influence on the power density, power factor, and stability of the system. 3) Due to the complexity of the design task, the filter will not be designed in a single step; in fact, a recursive design procedure is considered (cf. Fig. 1), where for the appropriate filter topology component value ranges are calculated based on derived formulas. This will lead to different results, depending on the specific application, but the main design procedure and formulas will remain the same. Here, selection of the filter components is shown exemplarily for a 5-kW three-phase buck-type PWM rectifier system.
Fig. 1.
EMC input filter design procedure shown in graphical form.
4) A sufficient passive damping without major increase of the filter volume and without major decrease of the highfrequency attenuation is very important for practical operation. However, since this is not the primary task in the filter design, this topic is treated in a separate section. This paper is organized as follows: in Section II, the input filter design procedure is explained stepwise, where the main topics are the analysis of the QP measurement process of the EMC test receiver (Section II-A, II-C, II-D), calculation of the required filter attenuation (Section II-E), selection of the filter topology (Section II-F), and calculation of the ranges for the filter component values (Section II-G). Exemplarily, component values are selected for a two-stage filter topology for a three-phase buck-type PWM rectifier in Section II-H. The
NUSSBAUMER et al.: DM INPUT FILTER DESIGN FOR THREE-PHASE BUCK-TYPE PWM RECTIFIER
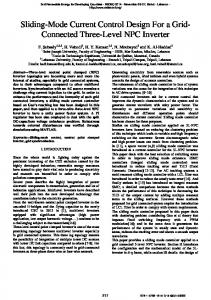
Fig. 2.
Three-phase buck-type PWM rectifier topology.
filter design is discussed in Section II-I, and approximations of the measurement result in order to facilitate the design are given. In Section III, measures for damping the filter resonances are discussed in order to guarantee high system stability for open-loop and closed-loop control operations. In particular, a coupled inductor with low implementation effort is added to the input filter in order to provide more damping within the control bandwidth, and an additional RC damping path is inserted in order to avoid resonances due to unknown mains impedance. Furthermore, the input and output impedance of the filter and the control stability of the system are discussed. Finally, in Section IV, the theoretical considerations are verified by measurements of the DM CEs on a 5-kW hardware prototype of the PWM rectifier and the realized input filter, and the resulting sinusoidal shape of the rectifier mains current is demonstrated. II. F ILTER D ESIGN A. Converter Topology Exemplarily, the EMC input filter shall be designed for a 5-kW three-phase three-switch current source (bucktype) PWM rectifier system (cf., Fig. 2), which features a sinusoidal input current, direct start-up, and overcurrent protection in case of an output short circuit and therefore is of potential interest for the realization of the input stage of high-power telecommunications rectifier modules [21], [22]. Here, compliance to the standard CISPR 22 Class B [3] has to be ensured, where frequencies within the range of 150 kHz– 30 MHz are considered for CE measurements and the measurement technique is defined in CISPR 16 [23]. B. Input Current Spectrum Considering a rectifier system with a rated output power of ˆN = √2 · 230 V Po = 5 kW and a rated mains voltage of U (the amplitude of the phase voltage), the input current spectrum of one phase depicted in Fig. 3 is obtained.1 Here, a modulation scheme that results in minimum high-frequency inputcurrent distortion [24] is employed. The switching frequency 1 Due to the phase symmetry of the converter and filter topology, the design of the DM input filter can be restricted to a single-phase equivalent circuit, i.e., the converter can be replaced for the following steps by a single-phase current source with a current spectrum. Thus, calculated filter parameters can be directly applied if the capacitors of the actual filter are arranged in star connection; for a delta-connection of the filter capacitors, the calculated capacitances have to be reduced by a factor of three [25], [26].
1651
is selected as fS = 28 kHz for reasons that will be explained in Section II-D so that the first multiple of the switching frequency within the EMC measurement band is located at 168 kHz. A zoom around fS = 28 kHz [cf., Fig. 3(b)] shows that harmonics are only present at frequencies fharm = m · fS ± n · fmains , where m = 1, 2, 3, . . ., n = 1, 2, 4, 5, 7, 8, . . ., and fmains = 50 Hz. For other modulation methods, the harmonics would vary in amplitude and phase, and/or a different distribution of the harmonic power would occur. As Fig. 3(c) illustrates, for increasing m, the amplitudes of the harmonics are decreasing, and the width of the sidebands is increasing, i.e., the harmonic power is spread over a wider frequency range. C. CE Measurement Using a LISN A line impedance stabilizing network (LISN) is specified for most of the CE tests in order to guarantee the reproducibility of the measurements. Furthermore, a LISN provides an interface between the equipment under test and the test receiver. A simplified mid-to-high-frequency (150 kHz–30 MHz) equivalent circuit of the LISN according to CISPR 16 is shown in Fig. 4. The voltage umeas at the LISN output is applied to an EMC test receiver or appropriate spectrum analyzer (RLISN = 50 Ω is the input resistance of the test receiver). For determining the measured voltage spectrum of umeas , the converter current spectrum Idm (jω) is multiplied by the LISN transfer function � � Umeas (jω) Umeas (jω) = Idm (jω) · . (1) Idm (jω) This is done in the first step without any input filter in order to determine the filter attenuation required for fulfilling the EMC regulations. D. QP Measurement at Test Receiver The input signal umeas of the receiver is processed according to CISPR 16 [23] using a heterodyne technique, i.e., for measuring at a given frequency f , the spectrum is shifted to a fixed intermediate frequency (IF), where bandpass filtering according to Fig. 6(a) is performed. This allows analyzing a wide frequency range without changing the center frequency (M B) of the bandpass filter by properly adapting the oscillator frequency that defines the frequency shift. A block diagram that shows the basic functions of the frequency measurement system is depicted in Fig. 5. The bandwidth of the bandpass filter [resolution bandwidth (RBW) filter] differs, depending on the frequency band of interest and is defined as 9 kHz at −6 dB for the range of 150 kHz–30 MHz, as shown in Fig. 6(a), where the simplified filter characteristic employed for the simulation of the receiver output is also depicted. In the test receiver simulation model, the M B can be directly located at the frequency under consideration and shifted for a frequency sweep. Therefore, the modeling of the oscillator and the mixer can be omitted. As can be easily proven and will be verified by measurements in Section IV, the worst case condition that concerns the detected spectral power appears if the midband M B frequency of the
1652
IEEE TRANSACTIONS ON INDUSTRIAL ELECTRONICS, VOL. 53, NO. 5, OCTOBER 2006
Fig. 3. (a) Frequency spectrum of converter input current Idm . (b) Zoom around switching frequency (at 28 kHz). (c) Zoom around first multiple of switching frequency located in range of 150 kHz–30 MHz (at 168 kHz).
Fig. 4. (a) Simplified high-frequency model considered for determining CEs. Converter is replaced by phase current source idm ; no input filter is present. (b) For a given spectrum of DM converter input current Idm (jω), voltage spectrum Umeas (jω) is calculated with (1) according to LISN transfer function.
RBW filter is set to the first integer multiple of the switchingfrequency harmonic within the range of 150 kHz–30 MHz, i.e., M B = 168 kHz. Accordingly, it is sufficient to restrict the filter design to the consideration of M B = 168 kHz. For shifting M B to the next integer switching-frequency multiple M B = 196 kHz, lower attenuation is required. The effect of the RBW filter when applied to the spectrum of the measured LISN output voltage umeas is shown in Fig. 6(b) for the specified operating conditions of the buck converter and M B = 168 kHz. It can be seen that the spectral components around M B (i.e., within the bandpass range) maintain their amplitude, while the remaining spectral components are suppressed and therefore do not contribute to the measurement result. Finally, the signal level is adapted in a way (block “Gain” in Fig. 5) that in case the input signal is formed by only a single harmonic component, i.e., a sine wave, inside the RBW, the root mean square (rms) value of the sine wave becomes the output signal. This means that the√total dc gain of the whole measurement system should be 1/ 2. The QP detector is also specified in CISPR 16 and shows different time constants for the charging and discharging of
the output capacitor CQP . Furthermore, different sets of time constants have to be considered for the different frequency ranges under consideration. The QP detector can be modeled as shown in Fig. 7(a). For the range of 150 kHz–30 MHz, the charging time constant is specified as 1 ms, while the discharging time constant is 160 ms [27], [28]. The final value for the measurement is obtained by averaging the output voltage of the QP detector, which is performed in the “Video filter,” which in turn is characterized by a time constant of 160 ms for 150 kHz–30 MHz. Finally, the influence of switching-frequency selection on the measurement result shall briefly be explained. In Fig. 8, the two switching-frequency harmonics n · fS and (n + 1) · fS around the lower limit of the measurement range (150 kHz) are shown. To achieve the low-attenuation requirements, it is advantageous to select a switching frequency such that the nth harmonic is placed well below 150 kHz, where the width of the nth harmonic of the measured voltage spectrum Umeas (jω) (which is equivalent to the width of the measured current spectrum Idm (jω), cf., Fig. 3) and the width of the RBW filter [cf., Fig. 6(a)] have to be considered. With this, the nth harmonic does not contribute to the measured result, and the input filter design can be based on the QP measurement result of the (n + 1)th harmonic, which shows a lower amplitude due to the decrease of the harmonic amplitudes for higher frequencies (cf., Fig. 3).2 This was considered when selecting the switching frequency of fS = 28 kHz, where the fifth and sixth harmonics are located at 140 and 168 kHz, respectively. For example, for a selection of fS = 30 kHz, the fifth harmonic would be located at 150 kHz. Therefore, the attenuation requirements would be increased, which translates to higher filter volume. E. Calculation of Required Filter Attenuation In the case at hand, the calculation result at the output of the video filter is UF,0 = 39.3 V and/or 151.9 dB · µV. By comparing UF,0 to the CISPR 22 Class B limit at f = 168 kHz given by LimitCISPR,168 kHz [in dB · µV] ∼ = 65.1
(2)
2 It has to be noted that the emission levels according to the standard CISPR 22 Class B are slightly decreasing in the frequency range of 150–500 kHz (cf., Fig. 12); therefore, the attenuation requirements are slightly increasing for higher frequencies. However, it can be shown that the decrease of the harmonic amplitude spectrum is much higher than the decrease of the emission levels standards. Hence, it is always preferable to select the switching frequency as previously described.
NUSSBAUMER et al.: DM INPUT FILTER DESIGN FOR THREE-PHASE BUCK-TYPE PWM RECTIFIER
1653
Fig. 5. Simplified heterodyne measurement scheme and QP detection model of test receiver. Depending on oscillator frequency, mixer shifts frequency of interest to an IF, where measurement is performed using fixed-frequency bandpass filter [RBW filter, cf., Fig. 6(a)] according to CISPR 16.
Fig. 6. (a) Upper and lower envelopes of the characteristic of the RBW filter, as specified in CISPR 16, and filter characteristic used when modeling the RBW filter. (b) Voltage at input and output of RBW filter for M B = 150 kHz. Index 0 denotes that no EMC input filter is present.
the required attenuation of the input filter including a margin of Margin = 6 dB is Attreq [dB] = UF,0,168 kHz [dB · µV] − LimitCISPR,168 kHz [dB · µV] + Margin[dB] ∼ = 92.8 dB.
(3)
F. Selection of Filter Topology For selection of the filter topology, three basic LC filter structures with damping of the resonance (cf., Fig. 9) were considered, whose properties concerning design, stability, and damping are discussed in detail in [7]. The parallel capacitor damping [cf., Fig. 9(a)] causes additional reactive power consumption, which results in a poor power factor for low-power operation; therefore, this damping method is disadvantageous for input filter stages that are placed directly at the input of the rectifier. By parameterizing the filter structures with inductor damping [cf., Fig. 9(b) and (c)], it can be seen that the filter shown in Fig. 9(b) is clearly preferable to the one in Fig. 9(c) concerning volume and losses in the damping resistor. Additionally, for the variant in Fig. 9(c), the cutoff
Fig. 7. (a) Network of QP detection circuit. (b) Simulation of QP detection in case no input EMC filter would be present: waveform of the voltage uD,0 at input and voltage uQP,0 at output of QP detector.
frequency is determined not only by the values of L1 and C1 (which is the case for the first two topologies) but also by the damping ratio n = L1d /L1 [7], which makes the dimensioning procedure more complicated (see Section II-G). Therefore, the filter structure of Fig. 9(b) will be considered in the following as the filter stage to be placed directly at the converter input. If the attenuation requirement (3) should be achieved by a single-stage filter, the cutoff frequency would have to be chosen to be very low due to the frequency characteristic of the filter attenuation, which is −40 dB per frequency decade. This would result in large component values (in the case at hand, L1 = 1 mH and C1 = 38 µF) and high filter volume. Furthermore, a large input filter with low-resonance frequency would also limit the control bandwidth and/or the dynamic performance of the system considerably. Therefore, the design of a two-stage filter structure (cf., Fig. 10) is considered in the following, where the filter stage at the converter input is named “Filter Stage 1” (formed by C1 −L1 −L1d ) and the filter stage at the mains side is called “Filter Stage 2” (formed by C2 −L2 ). Since there is always an inner mains impedance present, the inductor L2 can be omitted, i.e., L2 = 0. For the EMC measurement, the inner impedance of the LISN/test receiver ZLISN is showing an inductive component. Therewith, for the EMC test, the filter
1654
IEEE TRANSACTIONS ON INDUSTRIAL ELECTRONICS, VOL. 53, NO. 5, OCTOBER 2006
Fig. 8. Location of switching-frequency harmonics around lower limit of measurement range at 150 kHz as basis for selection of switching frequency.
criteria [see [7], eqs. (24) and (25)]. Thus, the components of each filter stage can be dimensioned according to the desired cutoff frequency of the corresponding filter stage. G. Dimensioning of Filter Components
Fig. 9. Three basic input filter topologies with passive damping.
For the filter dimensioning, several degrees of freedom (basically, the positioning of the cutoff frequencies and the type and extent of damping) are given. Furthermore, some nonlinear restrictions such as discrete available capacitance values, the maximum admissible output impedance, and the maximum admissible no-load reactive power have to be considered. In the following, some guidelines that can be considered for the dimensioning of the filter components are given. 1) Capacitor C1 The capacitor C1 that is placed directly at the rectifier input is selected such that the voltage ripple peak-to-peak value is limited to about ±5%–8% in order to ensure correct detection of the signs of the input line-to-line voltages that are required for system modulation [24] and to limit the maximum voltage stress on the power semiconductors. On the other hand, a large capacitor value leads to high reactive power at no load, which defines the maximum limit for the capacitance value. In the case at hand, this translates into C1 = 4, . . . , 8 µF. 2) Inductor L1 Both filter stages will contribute to the required filter attenuation. For control stability reasons, the attenuation of Stage 1 has to be higher than of Stage 2 [7], which leads to a lower cutoff frequency of Stage 1 compared with Stage 2. Usually, fcutoff,sec1 ≈ 0.1 · fcutoff,sec2 is an advantageous selection, which gives Stage 1 an attenuation range of Attsec1 [dB] = (0.7, . . . , 0.8) · Attreq [dB].
Fig. 10. Selected two-stage filter topology.
formed by C1 −L1 −L1d and C2 −ZLISN has to provide the required attenuation, while for the normal operation the filter formed by C1 −L1 −L1d , C2 −Lmains has to ensure sufficient attenuation and a stable operation of the system control. Usually, the mains impedance is unknown and can vary widely in different grids, affecting the position of the resonance of Filter Stage 2, which is also varying in a wide range. Therefore, a wide-area damping of the second filter stage has to be provided in order to ensure stability for any mains impedance, which will be discussed in detail in Section III. In [7], it was shown that the design of the two filter stages can be carried out in two separate steps; if the interaction between the filter stages is minimized by considering an impedance
With 168 kHz 1 √ fcutoff,sec1 = √ = 2π · L1 C1 10Attsec1 [dB]/20 we therefore obtain a range for the inductor value L1 =
10Attsec1 [dB]/20 10(0.7,...,0.8)Attsec1 [dB]/20 = 4π 2 ·C1 ·(168 kHz)2 4π 2 ·(4, . . . , 8)µF·(168 kHz)2
= (123, . . . , 668) µH. 3) Inductor L1d Inductor L1d is normally determined by the damping ratio n = L1d /L1 , which should not be selected too low
NUSSBAUMER et al.: DM INPUT FILTER DESIGN FOR THREE-PHASE BUCK-TYPE PWM RECTIFIER
1655
fsec1 ≈ 0.1 · fsec2 ≈ 0.01 · fsec3 , the attenuation provided by the third stage is already very low. Therefore, the need and the effort of inserting another stage have to be considered carefully. Additionally, one has to take care that the filter resonance frequencies do not coincide in frequency with switchingfrequency converter input current harmonics. I. Discussion/Approximation of QP Measurement
Fig. 11. Final two-stage filter topology showing selected component values.
in order to provide sufficient damping or too high in order not to cause high filter output impedance as the filter output impedance is taking influence on the converter control stability (for high filter output impedance, the requirements for stability are more difficult to meet when designing the converter control [4], [7]). Here, n = 0.1, . . . , 0.5 is selected; accordingly, we obtain L1d = (12.3, . . . , 334)µH. 4) Damping Resistor R1d For optimum damping � R1d =
L1 1 + n · · C1 n
�
(2 + n) · (4 + 3n) 2 · (1 + n) · (4 + n)
has to be selected.3 5) Capacitor C2 For the EMC measurement and in the case no inductor L2 is present, the second filter stage (Stage 2) is formed by capacitor C2 in combination with the LISN [RLISN = 50 Ω, LLISN = 50 µH, CLISN = 250 nF (Fig. 4)] and has to provide an attenuation of Attsec2 [dB] = Attreq [dB] − Attsec1 [dB] at 168 kHz, which directly determines the value of C2 . H. Test and Evaluation After determining the ranges for all filter components as previously described, an iterative optimization process can be followed, considering the points listed in Fig. 1. A quality function can be defined depending on the specifications and the design criteria (such as filter size, amount of damping, input displacement factor, and costs). This optimization step shall not be explicated here for the sake of brevity. The filter components selected in the case at hand, considering the aforementioned design goals, are detailed in Fig. 11. For the sake of clarity, a refinement of the filter concerning the damping of the filter resonances and/or stability improvements is discussed separately in Section III. For achieving higher attenuation at higher frequencies, it could be useful to insert additional filtering elements, e.g., a third filter stage. However, one has to consider that with 3 The
given formulas are only valid for the filter topology at hand; for other topologies, details can be found in [6] and [7].
As previously stated, it is essential to consider the QP measurement process of the EMC test receiver in order to be able to accurately predict the measurement result. In Fig. 12, the simulated QP detected values UF (jω) are compared with the voltage spectrum Umeas (jω) at the LISN output in case the designed filter (cf., Fig. 11) is employed. In the case at hand, the amplitudes of the voltage harmonics forming the LISN output voltage spectrum Umeas (jω) show lower values than the EMC receiver output voltage UF (jω) (e.g., 16 dB difference at 168 kHz). Hence, with a filter design based only on the analysis of the voltage spectrum Umeas (jω), the system would not comply with EMC standards. However, it is possible to define the upper and lower boundaries for the measurement result in order to simplify the design and/or to omit precise modeling of the QP test receiver. The lower limit can be obtained as the square root of the sum of the squares of the rms values of all harmonic components Umeas (jω) located within the RBW, i.e., M inresult (jω) � (M B+ RBW 2 ) � 1 = 20 · log (Umeas (jω))2 1µV ·
[dBµV]. (4) RBW f =(M B− 2 ) The resulting signal M inresult (jω) is the equivalent rms value and can be seen as a signal that shows equal spectral power at the frequency ω, as given for the original signal within the RBW. A limiting value M axresult
1 · = 20 · log 1µV
RBW (M B+ �2 )
Umeas (jω) [dB · µV] (5)
f =(M B− RBW ) 2
can be calculated by linearly adding the rms values Umeas (jω) of the spectral components within the RBW. M axresult (jω) can be calculated with lower effort and can be taken for a simplified filter design, where the modeling of the QP measurement can be omitted. However, it has to be noted that this will result in slightly increased input filter volume. III. I NFLUENCE ON C ONVERTER C ONTROL Employing the input filter designed in the previous section, the DM emissions of the converter would already be attenuated sufficiently so that in combination with an appropriate CM
1656
IEEE TRANSACTIONS ON INDUSTRIAL ELECTRONICS, VOL. 53, NO. 5, OCTOBER 2006
Fig. 12. Simulation of QP measurement (based on video-filtered values of voltage UF (jω), cf., Fig. 5) after inserting designed input filter (cf., Fig. 11) compared to spectrum of voltage Umeas (jω) at LISN output. Also shown are minimum (M inresult (jω)) and maximum (M axresult (jω)) signal levels resulting from QP detection, and CE limits according to CISPR 22 Classes A and B.
Fig. 13. Input filter attenuation characteristic according to Fig. 11 for three different mains impedances (inductances) Lmains .
filter, the converter would comply with the EMC standards. However, to ensure a satisfactory operation of the converter in combination with the input filter, control-oriented aspects also have to be considered, as discussed in the next subsection. A. Additional Damping of Filter Resonances The influence of the inner mains impedance on the input filter attenuation characteristic is shown in Fig. 13. Here, to limit to the essentials, the mains impedance is considered as purely inductive with an inductance in the range of Lmains = 5, . . . , 150 µH. The filter characteristic exhibits two main resonances, where the upper resonant frequency, i.e., the resonance of Filter Stage 2, shows a pronounced dependence on Lmains . Both resonances could be excited by the harmonics contained in the feeding mains voltage, which would result in voltage and current oscillations of large amplitudes. In addition, the filter could be excited by the rectifier itself, e.g., if the upper filter resonance coincides with the switching frequency (which is true for Lmains = 150 µH, cf., Fig. 13) or with multiples of the switching frequency. Therefore, sufficient damping of the filter resonances without substantially influencing the highfrequency attenuation has to be provided. Damping of Filter Stage 1 without increasing the filter volume or impairing the high-frequency attenuation can be achieved by connecting an inductor L1c , which is coupled to
Fig. 14. Optimized filter topology including damping of Filter Stage 1 (by coupled inductors, k = 0.981) and Filter Stage 2 (by parallel RC path).
L1 , in series to L1d (cf., Fig. 14) [17]. The coupled inductor L1c is realized by adding turns on the magnetic core of the inductor L1 . Since L1c is inserted in the damping path, one terminal of L1c has to be connected to inductor L1d , and the second terminal of L1c is attached to the connection point of resistor R1d and the mains-side terminal of inductor L1 (cf., Fig. 14). With this, R1d is also effective for L1 , depending on the winding ratio and the magnetic coupling k of L1 and L1c . Here, the filter damping could be increased by increasing the inductance ratio nL = L1c /L1 ; however, at the same time, the high-frequency attenuation would be reduced. Fig. 15 shows the location of the two dominant poles of the third-order system formed by Filter Stage 1 for different inductance ratios nL (the third pole is located at high frequencies and therefore does not
NUSSBAUMER et al.: DM INPUT FILTER DESIGN FOR THREE-PHASE BUCK-TYPE PWM RECTIFIER
1657
Fig. 17. Attenuation characteristic of optimized input filter according to Fig. 14 for three different inner mains impedances (inductances) Lmains .
Fig. 15. Location of the dominant low-frequency input filter poles (mainly determined by Filter Stage 1, i.e., L1 , L1d , L1c , R1d , and C1 ), depending on inductance ratio of coupled inductors L1c and L1 .
Fig. 18. Simulated time behavior of rectifier input current idm (t) and resulting mains current imains (t), with assumed inner main impedance of Lmains = 50 µH.
Fig. 16. Attenuation characteristic of Filter Stage 1, depending on ratio of inductances of coupled inductors L1c and L1 .
take significant influence on the filter behavior). For higher values of L1c , the distance of the poles to the imaginary axis and/or the filter damping does increase, while the attenuation at high frequencies is decreasing (cf., Fig. 16), resulting finally in a mainly first-order (P T1 ) system behavior for a wide frequency range (cf., Figs. 7 and 8 for nL = 0 µH : 245 µH). Here, nL = 5 µH : 240 µH represents a good compromise, where the resonance peak is lowered by 12 dB and the reduction of the filter attenuation at 168 kHz is only 1.2 dB compared to the original filter depicted in Fig. 11. It can be shown that R1d = 0.7 Ω still provides optimum damping at low losses of PR1d,max = 0.11 W, which facilitates a realization of R1d by surface mount device (SMD) resistors. In addition, the effort for realizing the coupled inductor L1c = 5 µH is very low; in the case at hand, only seven turns have to be added on the magnetic core of Lmains . In case an equal reduction of the resonance peak and the same attenuation at 168 kHz would have to be achieved with the filter topology shown in Fig. 11, the values L1 = 210 µH, L1d = 130 µH, and R1d = 2.15 Ω would have to be selected. This clearly shows the advantage of coupling inductors (cf., Fig. 14) concerning the resulting filter volume. The resonance of Filter Stage 2 can be damped by adding an RC series connection in parallel to C2 (cf., Fig. 14). Here, the damping elements C2d = 470 nF and R2d = 20 Ω are selected
such that sufficient damping is achieved for all inner main inductances without significantly affecting the high-frequency filter attenuation (in the case at hand, the attenuation at 168 kHz is even increased by 0.2 dB). Due to the low capacitance of C2d , the filter volume is only slightly increased, and the maximum losses of the damping resistor R2d amount to only PR2d,max = 0.1 W, which again allows a realization with SMD resistors. The resulting filter attenuation characteristic, which can be calculated by ac analysis of the filter network (cf., Fig. 14), is depicted in Fig. 17. The minimum attenuation of switchingfrequency input current harmonics occurs for Lmains = 50 µH, where the upper filter resonance coincides with the switching frequency fS = 28 kHz. Here, the filter attenuation amounts to |AttFilt | = 26.3 dB, which means that the harmonics around fS (cf., Fig. 3) are attenuated by a factor of 20, which still results in very good mains current quality. This can be seen in Fig. 18, where a rectifier input current and the corresponding mains phase current are depicted. In summary, the additional damping measures are reducing the attenuation of high-frequency harmonics by 1 dB and/or resulting in a remaining margin of 5 dB at 168 kHz. The components employed in the input filter are compiled in Table I. In Fig. 19, the main filter components of one phase are shown.
B. Filter Input Impedance The filter input impedance given for different inner mains inductances is depicted in Fig. 20. Compared to the impedance
1658
IEEE TRANSACTIONS ON INDUSTRIAL ELECTRONICS, VOL. 53, NO. 5, OCTOBER 2006
TABLE I INPUT FILTER COMPONENTS
Fig. 19. Photo of main filter components (inductors and capacitors) employed for realization of designed input filter (cf., Fig. 14).
ˆ = 100 V Fig. 21. Filter output voltage time behavior for steplike change ∆U of input voltage amplitude (filter output left in open circuit, which is given for no-load operation of rectifier system).
C. Filter Output Impedance The filter output impedance is an important quantity in connection with the stability of the converter control combined with the input filter. To ensure stability within the whole control bandwidth, among other requirements, the (sufficient) condition |Zo,Filt | < |Zi,Rect |
Fig. 20. Filter input impedance for open circuit filter output and three different main impedances (inductances) Lmains .
characteristic resulting for the first filter design (cf. Fig. 11 and Fig. 20 for Lmains = 50 µH), the damping measures described in Section III-A increase the input impedance to |Zi,Filt,min | = 1 Ω at the first (series) resonant frequency. ˆ of the mains phase Accordingly, for a sudden step ∆U voltage amplitudes, a well-damped response of the filter output voltages and/or of the rectifier input phase voltages does occur (cf., Fig. 21). One has to note that the overshoot of the rectifier input voltage (70 V in Fig. 21) cannot be prevented by passive damping at reasonable losses. In addition, active damping measures would not allow voltage limitation due to the limited control bandwidth (cf., Section III-C) and/or would not be applicable for no-load operation of the rectifier system.
(6)
has to be fulfilled, i.e., the magnitude of the filter output impedance has to be significantly lower than the rectifier input impedance [4], [7], which is approximated for perfect control by � � � Uo2 1 �� � (7) |Zi,Rect | = �− · Po M 2 � where M = IˆN /I is the PWM rectifier modulation index (with a modulation range of M = 0, . . . , 1), Po is the output power, and Uo is the rectifier output voltage. The magnitude plot of the output impedance for different mains impedances is shown in Fig. 22. With the minimum rectifier input impedance magnitude |Zi,Rect,min | = 32 Ω occurring at the maximum modulation index Mmax = 1 and rated output power, the bandwidth of the system control (i.e., of the inner current control loop of the cascaded output voltage control) has to be limited to Bw,max ≈ 2 kHz
(8)
NUSSBAUMER et al.: DM INPUT FILTER DESIGN FOR THREE-PHASE BUCK-TYPE PWM RECTIFIER
1659
Fig. 22. Magnitude of filter output impedance for three different inner main impedances (inductances) Lmains .
Fig. 24. CE measurements at one DM output of CM/DM noise separator for operating point given in measurement setup (Section IV-A, UN,l−l,rms = 400 V, U0 = 400 V, P0 = 5 kW).
Fig. 23. 5-kW prototype of three-phase buck-type PWM rectifier system including designed input filter (DM filter inductors and capacitors located below power printed circuit board).
[cf., (6) and Fig. 22]. Introducing the additional filter damping described in Section III-A slightly reduces Zo,Filt around the first resonant frequency (cf., Fig. 22). A substantial reduction of Zo,Filt and/or increase of the control bandwidth could only be achieved by increasing C1 in capacitance (and lowering the series inductances), which, however, would result in a higher reactive power consumption and/or lower mains power factor at light load.
IV. E XPERIMENTAL V ERIFICATION
Conventional EMC measurements only provide information on the total electromagnetic emissions and/or do not allow separation into a CM and a DM component. Therefore, to validate the DM input filter design, a three-phase CM/DM noise separator [20] has been employed. The separator requires simultaneous access to all phase outputs of the LISN, which, however, is typically not provided by commercial four-line networks. Therefore, in the case at hand, two two-line LISNs (Rohde & Schwarz ESH3-Z5) and a four-line LISN (Rohde & Schwarz ESH2-Z5) were employed (three identical two-line LISNs were not available at the time of the measurements); however, no remarkable difference of the noise levels of the three phases could be noticed. B. CE Compliance Measurements Fig. 24 shows the result of the DM noise measurement using a Rohde & Schwarz ESPI test receiver for one phase in the frequency range relevant to the DM CEs, i.e., for the range of 150 kHz–3 MHz. The predictions by simulations (cf., Section II) are indicated by “x,” and are in good accordance with the measured noise level. Especially, the prediction of the first peak occurring in the measurement range at f = 168 kHz given by
A. Measurement Setup For the EMC measurements, a prototype of the system (cf., Fig. 23) operating under the following conditions was considered: Input (3-φ ac) Input rms line-to-line voltages: UN,l−l,rms = 400 V Input rms phase current: IN,rms,max = 7.6 A Mains frequency: fmains = 50 Hz Output (dc) Output voltage: U0 = 400 V Rated output power: P0 = 5 kW Switching frequency: fS = 28 kHz.
uF,sim = 60.7 dB · µV
(9)
which served as the basis for the whole input filter design (cf., Section II), is very close to the measured result given by uF,meas = 61.8 dB · µV
(10)
that clearly verifies the dimensioning procedure. The small difference to the simulation results (which is also changing by ±0.5 dB for the three phases) is due to the tolerances of the filter parameters and small asymmetries of the CM/DM separator and the LISN arrangement. The increase of the noise level around
1660
IEEE TRANSACTIONS ON INDUSTRIAL ELECTRONICS, VOL. 53, NO. 5, OCTOBER 2006
the amplification of harmonics at multiples of the switching frequency, reduces the amplitudes of the oscillating currents and voltages that result from mains voltage distortions, and decreases the filter output impedance at parallel resonant frequencies, which facilitates the design of the system control. As verified by DM measurements, the proposed dimensioning procedure ensures compliance to CISPR 22 and therefore constitutes an important step toward virtual prototyping of the rectifier system. R EFERENCES Fig. 25. Measured rectifier mains current (5 A/div) and mains phase voltage (100 V/div) resulting from proposed input filter when connecting system to artificial mains, which is formed by high-power analog amplifier at operating parameters, as specified in Section IV-A.
Fig. 26. Measured low-frequency harmonics of mains current compared to IEC 61000-3-2 limits.
500 kHz, 1 MHz, and 1.2 MHz is caused by parasitics of the rectifier power circuit, resulting, e.g., in a ringing of the rectifier output inductor current at each switching instant. C. Mains Current Quality Aside from the DM noise level, the measured mains current waveform is also in good correspondence with the simulations (cf., Fig. 25). The slight deviations from a purely sinusoidal shape originate from delays in A/D conversion of the rectifier input voltages (which provide the basis for determination of the signs of the input line-to-line voltages, which are required for PWM generation [24]) but remain limited to small values due to proper filter damping. The measured low-frequency mains current harmonics are presented in Fig. 26 and are well below the limits defined in the IEC 61000-3-2 for Class A equipment, which are relevant in the case at hand [29]. V. C ONCLUSION In this paper, the DM input filter of a three-phase bucktype PWM rectifier has been designed based on a simulation model of the system, the LISN, and the EMC test receiver. For the considered two-stage filter topology, coupling of the inductors of the first stage and parallel damping of the second stage have been employed in order to provide sufficient damping of the filter resonances without decreasing the attenuation in the frequency range that is considered for the EMC measurements. The filter damping avoids
[1] M. J. Nave, Power Line Filter Design for Switched-Mode Power Supplies. New York: Van Nostrand Reinhold, 1991. [2] T. Williams, EMC for Product Engineers, 2nd ed. Oxford, UK: Newnes, 1996. [3] C.I.S.P.R., Limits and methods of measurement of radio disturbance characteristics of information technology equipment—Publication 22, 1993, Geneva, Switzerland: IEC International Special Committee on Radio Interference. [4] R. D. Middlebrook, “Input filter considerations in design and application of switching regulators,” in Proc. IEEE Ind. Appl. Soc. Annu. Meeting, 1976, pp. 366–382. [5] ——, “Design techniques for preventing input-filter oscillations in switched-mode regulators,” in Proc. 5th Nat. Solid State Power Convers. Conf. (PowerCon 5), 1978, pp. 153–168. [6] T. K. Phelps and W. S. Tate, “Optimizing passive input filter design,” in Proc. 6th Nat. Solid-State Power Convers. Conf. (PowerCon 6), 1979, pp. G1-1–G1-10. [7] R. W. Erickson, “Optimal single resistor damping of input filters,” in Proc. 14th IEEE Appl. Power Electron. Conf., 1999, pp. 1073–1079. [8] R. M. Tedder, “An alternate analysis of the current programmed model leads to simplified input filter design criteria,” in Proc. 7th IEEE Appl. Power Electron. Conf. Expo., 1992, pp. 756–763. [9] S. Y. Erich and W. M. Polivka, “Input filter design criteria for currentprogrammed regulators,” IEEE Trans. Power Electron., vol. 7, no. 1, pp. 143–151, Jan. 1992. [10] C. R. Kohut, “Input filter design criteria for switching regulators using current-mode control,” IEEE Trans. Power Electron., vol. 7, no. 3, pp. 469–479, Jul. 1992. [11] Y. Jang and R. W. Erickson, “Physical origins of input filter oscillations in current programmed converters,” IEEE Trans. Power Electron., vol. 7, no. 4, pp. 725–733, Oct. 1992. [12] B. Choi and B. H. Cho, “Intermediate line filter design to meet both impedance compatibility and EMI specifications,” IEEE Trans. Power Electron., vol. 10, no. 5, pp. 583–588, Sep. 1995. [13] V. Vlatkovic, D. Borojevic, and F. C. Lee, “Input filter design for power factor correction circuits,” IEEE Trans. Power Electron., vol. 11, no. 1, pp. 199–205, Jan. 1996. [14] S. Chandrasekaran, D. Borojevic, and D. K. Lindner, “Input filter interaction in three phase ac–dc converters,” in Proc. 30th Annu. IEEE Power Electron. Spec. Conf., 1999, vol. 2, pp. 987–992. [15] N. R. Zargari, G. Joos, and P. D. Ziogas, “Input filter design for PWM current–source rectifiers,” in Proc. 8th IEEE Appl. Power Electron. Conf. Expo., 1993, pp. 824–830. [16] S. Hiti, V. Vlatkovic, D. Borojevic, and F. C. Lee, “A new control algorithm for three-phase PWM buck rectifier with input displacement factor compensation,” IEEE Trans. Power Electron., vol. 9, no. 2, pp. 173–180, Mar. 1994. [17] S. Senini and P. J. Wolfs, “The coupled inductor filter: Analysis and design for ac systems,” IEEE Trans. Ind. Electron., vol. 45, no. 4, pp. 574–578, Aug. 1998. [18] A. Nagel and R. W. De Doncker, “Systematic design of EMI-filters for power converters,” in Proc. IEEE Ind. Appl. Conf., 2000, vol. 4, pp. 2523– 2525. [19] G. A. Kyriazis, “Analysis of discrepancies between measured and predicted conducted emissions in switched-mode power supplies,” in Proc. IEEE Int. Symp. Electromagn. Compat., 1997, pp. 504–506. [20] M. L. Heldwein, T. Nussbaumer, F. Beck, and J. W. Kolar, “Novel threephase CM/DM conducted emissions separator,” in Proc. 8th IEEE Appl. Power Electron. Conf., 2005, vol. 2, pp. 797–802. [21] L. Malesani and P. Tenti, “Three-phase ac/dc PWM converter with sinusoidal ac currents and minimum filter requirements,” IEEE Trans. Ind. Appl., vol. IA-23, no. 1, pp. 71–77, Jan./Feb. 1987.
NUSSBAUMER et al.: DM INPUT FILTER DESIGN FOR THREE-PHASE BUCK-TYPE PWM RECTIFIER
[22] M. Baumann, U. Drofenik, and J. W. Kolar, “New wide input range threephase unity power factor rectifier formed by integration of a three-switch buck-derived front-end and a dc/dc boost converter output stage,” in Proc. 22th IEEE Int. Telecommun. Energy Conf., 2000, pp. 461–470. [23] C.I.S.P.R., Specification for Radio Interference Measuring Apparatus and Measurement Methods—Publication 16, 1977, Geneva, Switzerland: IEC Int. Special Committee Radio Interference. [24] T. Nussbaumer and J. W. Kolar, “Advanced modulation scheme for threephase three-switch buck-type PWM rectifier preventing mains current distortion originating from sliding input filter capacitor voltage intersections,” in Proc. 34th IEEE Power Electron. Spec. Conf., 2003, vol. 3, pp. 1086–1091. [25] M. L. Heldwein, T. Nussbaumer, and J. W. Kolar, “Differential mode EMC input filter design for three-phase ac–dc–ac sparse matrix PWM converters,” in Proc. 35th IEEE Power Electron. Spec. Conf., Aachen, Germany, Jun. 20–25, 2004. [26] T. Nussbaumer, M. L. Heldwein, and J. W. Kolar, “Differential mode EMC input filter design for a three-phase buck-type unity power factor PWM rectifier,” in Proc. 4th Int. Power Electron. Motion Control Conf., Xian, China, Aug. 14–16, 2004, vol. 3, pp. 1521–1526. [27] M. Albach, “Conducted interference voltage of ac–dc converters,” in Proc. 17th Annu. IEEE Power Electron. Spec. Conf., 1986, pp. 203–212. [28] P. Silventoinen, “Electromagnetic compatibility and EMC-measurements in dc-voltage link converters,” Ph.D. dissertation, Lappeenranta Univ. Technol., Lappeenranta, Finland, 2001. [29] IEC International Electrotechnical Commission, Electromagnetic Compatibility (EMC)—Part 3-2: Limits—Limits for harmonic current emissions (equipment input current ≤ 16 A per phase) Consol. Ed. 2.1, 2001, Geneva, Switzerland.
Thomas Nussbaumer (S’03–M’05) was born in Vienna, Austria, in 1975. He received the M.Sc. degree (with honors) in electrical engineering from the University of Technology Vienna, Vienna, Austria, in 2001, and the Ph.D. degree from the Swiss Federal Institute of Technology (ETH), Zurich, Switzerland, in 2004. During his Ph.D. studies, he performed research on the design, control, and modulation of three-phase rectifiers with low effects on the mains at the Power Electronics Systems Laboratory (PES), ETH. Since 2004, he has been with PES/ETH as a Post-Doctoral researcher, continuing his research on power factor correction techniques, modeling and dynamic control of three-phase rectifiers, and electromagnetic compatibility. Dr. Nussbaumer is a member of the Austrian Society of Electrical Engineering.
1661
Marcelo Lobo Heldwein (S’99) received the B.S. and M.S. degrees in electrical engineering from the Federal University of Santa Catarina, Florianópolis, Brazil, in 1997 and 1999, respectively. He is currently working toward the Ph.D. degree at the Power Electronic Systems Laboratory (PES), Swiss Federal Institute of Technology (ETH), Zurich, Switzerland. From 1999 to 2001, he was a Research Assistant with the Power Electronics Institute, Federal University of Santa Catarina. From 2001 to 2003, he was an Electrical Design Engineer with Emerson Energy Systems, in São José dos Campos, Brazil and in Stockholm, Sweden. His research interests include power factor correction techniques, static power converters, and electromagnetic compatibility. Mr. Heldwein is currently a member of the Brazilian Power Electronic Society.
Johann W. Kolar (M’89–SM’04) received the Ph.D. degree (summa cum laude) in industrial electronics from the University of Technology Vienna, Vienna, Austria. Since 1984, he has been with the University of Technology Vienna, teaching and working in research in close collaboration with the industry in the fields of high-performance drives, high-frequency inverter systems for process technology, and uninterruptible power supplies. He has proposed numerous novel converter topologies, e.g., the VIENNA Rectifier and the ac–ac Sparse Matrix Converter concept. He has published more than 150 scientific papers in international journals and conference proceedings and has filed more than 50 patents. On Feb. 1, 2001, he was appointed Professor and Head of the Power Electronics Systems Laboratory, Swiss Federal Institute of Technology (ETH), Zurich, Switzerland. His current research interests include novel ac–ac and ac–dc converter topologies with low effects on the mains, e.g., for power supplies of telecommunication systems, more-electricaircraft applications, distributed power systems in connection with fuel cells, the realization of ultracompact intelligent converter modules that employ the latest power semiconductor technology, and novel concepts for cooling and electromagnetic compatibility filtering. Dr. Kolar is a member of the Institute of Electrical Engineers of Japan and of the Technical Program Committees of numerous international conferences including Director of the Power Quality branch of the International Conference on Power Conversion and Intelligent Motion. From 1997 to 2000, he served as an Associate Editor of the IEEE TRANSACTIONS ON INDUSTRIAL ELECTRONICS, and, since 2001, he has been an Associate Editor of the IEEE TRANSACTIONS ON POWER ELECTRONICS.