previously characterized attentional network, namely, the frontal eye fields, .... Macintosh PowerPC 8100/80 (Apple, Cupertino, CA) computer. ... Vision scanner.
NeuroImage 9, 269–277 (1999) Article ID nimg.1999.0408, available online at http://www.idealibrary.com on
The Large-Scale Neural Network for Spatial Attention Displays Multifunctional Overlap But Differential Asymmetry Yun-Hee Kim,* Darren R. Gitelman,*,†Anna C. Nobre,‡ Todd B. Parrish,† Kevin S. LaBar,* and M.-Marsel Mesulam*,§,1 *Northwestern Cognitive Brain Mapping Group and Department of Neurology, §Department of Psychiatry, and †Department of Radiology, Cognitive Neurology and Alzheimer’s Disease Center, Northwestern University Medical School, Chicago, Illinois; and ‡Department of Experimental Psychology, Oxford University, Oxford, United Kingdom Received July 6, 1998
INTRODUCTION Functional magnetic resonance imaging (fMRI) was used to determine the brain regions activated by two types of covert visuospatial attentional shifts: one based on exogenous spatial priming and the other on foveally presented cues which endogenously regulated the direction of spatial expectancy. Activations were seen in the cortical and subcortical components of a previously characterized attentional network, namely, the frontal eye fields, posterior parietal cortex, the cingulate gyrus, the putamen, and the thalamus. Additional activations occurred in the anterior insula, dorsolateral prefrontal cortex, temporo-occipital cortex in the middle and inferior temporal gyri, the supplementary motor area, and the cerebellum. Direct comparisons showed a nearly complete overlap in the location of activations resulting from the two tasks. However, the spatial priming task displayed a more pronounced rightward asymmetry of parietal activation, and a conjunction analysis showed that the area of posterior parietal cortex jointly activated by both tasks was more extensive in the right hemisphere. Furthermore, the posterior parietal and temporooccipital activations were more pronounced in the task of endogenous attentional shifts. The results show that both exogenous (based on spatial priming) and endogenous (based on expectancy cueing) shifts of attention are subserved by a common network of cortical and subcortical regions. However, the differences between the two tasks, especially in the degree of rightward asymmetry, suggests that the pattern of activation within this network may show variations that reflect the specific attributes of the attentional task. r 1999 Academic Press
1 Reprint requests should be addressed to M. Mesulam, Northwestern University, 320 East Superior St. 11-450, Chicago, IL 60611.
The ability to direct attention toward sensory events in the extrapersonal space is of crucial importance for adaptive behavior. Clinical observations on patients with focal brain damage and functional imaging experiments indicate that the distribution of spatial attention is coordinated by a large-scale distributed network of interconnected cortical areas in the posterior parietal cortex, the region of the frontal eye fields, and the cingulate cortex (Mesulam, 1981, 1983, 1990; Corbetta et al., 1993; Gitelman et al., 1996b; Nobre et al., 1997). Patterns of anatomical connectivity and single unit recordings suggest that the parietal component is specialized for the perceptual representation of behaviorally relevant extrapersonal events as targets for attentional behaviors; the frontal component for selecting and executing motor strategies involved in foveation, exploration, and reaching; and the cingulate component for modulating effort and motivation (Mesulam, in press). The effective shifting of attention toward motivationally relevant extrapersonal targets requires the integrity of all three components of this network. Damage to any one of these three cortical areas causes contralesional neglect (Heilman, 1980; Mesulam, 1981). There is also an overall right hemisphere specialization pattern such that hemispatial neglect is more common and severe after right hemisphere lesions. Spatial attention can be assessed by tasks based on covert shifts of attention during which no exploratory eye movement are allowed. Attentional shifts can be initiated exogenously by the reflexive reorienting of the attentional focus in response to peripheral priming stimuli or endogenously by biasing expectation in response to symbolic indicators, such as a central arrow pointing to the right or left hemispace. These two tasks elicit different cognitive processes: the peripheral cues trigger a rapid-acting but transitory reflexive orientation, whereas central cues initiate a deliberate orientation based on the probabilistic information provided by
269
1053-8119/99 $30.00 Copyright r 1999 by Academic Press All rights of reproduction in any form reserved.
270
KIM ET AL.
the cue (Posner, 1980; Jonides, 1981; Posner et al., 1982, 1984; Mu¨ller and Rabbitt, 1989). On occasion, cerebrovascular accidents can cause a differential impairment in these two tasks (Gitelman et al., 1995). Furthermore, Alzheimer’s disease leads to abnormalities with different temporal patterns in endogenous versus exogenous attentional shifting tasks (Parasuraman et al., 1992). However, the neuroanatomical and neurophysiological differences in the regulation of these two modes of attentional shifting are poorly understood. The purpose of the present study was to delineate the activations obtained in the course of attentional shifts triggered either by exogenous spatial cues or by endogenous expectancy-generating cues. We addressed two questions: (1) Are both of these tasks subserved by the same attentional network identified in the course of previous investigations? (2) Are there task-related differences in the internal organization of this network? METHODS Subjects Ten subjects (eight males and two females) participated in the functional MRI experiment. None had any history of significant medical, neurologic, or psychiatric illness. Their mean age was 30.1 ⫾ 4.6 years. All subjects, as assessed by the modified Edinburgh inventory (Oldfield, 1971), were right handed with an aver-
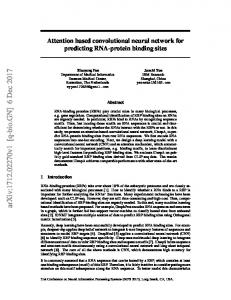
age handedness score of ⫹ 90.0 ⫾ 13.1 (range ⫹ 60 to ⫹ 100). Subjects were initially selected on the basis of performance in a behavioral experiment (see below) at the cognitive laboratory prior to imaging. All subjects gave their informed consent. The study protocols were approved by the Institutional Review Board at Northwestern University. Behavioral Tasks We used two attentional tasks, each based on a modification of the Posner paradigm (Posner, 1980). The spatial priming task was designed to elicit a shift of attention exogenously by a peripheral cue and the central expectancy task was designed to elicit a shift of attention endogenously by a central arrow cue. Both tasks required covert shifts of attention in the absence of eye movements (Fig. 1). The background display consisted of a central diamond (1° wide) and two peripheral squares (1.5° wide), located at approximately 7.5° of eccentricity in each visual field. In the spatial priming tasks, a brief change of luminance of one peripheral square for 100 ms provided a priming cue which was followed by a target. This cue did not predict the location of subsequent target appearance. Fifty percent of the targets were validly cued (cue and target on the same side) and 50% were invalidly cued (cue and target on opposite sides). In this way, the peripheral cue did not give any
FIG. 1. Schematic demonstration of activation paradigm with spatial priming (left) and central expectancy (right) cues. In the spatial priming task, 50% of the cues are valid and in the central expectancy task, 80% of the cues are valid. The control task is a static display of visual stimuli.
LARGE SCALE NEURAL NETWORK FOR SPATIAL ATTENTION
information that could be used to direct expectancy. The stimulus-onset asynchronies (SOA) were 100, 150, or 200 ms distributed in a pseudorandomized and balanced order. In the central expectancy task, the centrally presented arrow cues were used to generate lateralized expectancy for subsequent target location. During each trial, brief presentation of a bold arrow within the central diamond for 100 ms indicated the side of target appearance 80% of the time (valid trials). Twenty percent of the time the target appeared opposite the cued side (invalid trials). The SOAs were 200, 400, or 800 ms. In both tasks, the target stimuli were either a diagonal cross (X) or an upright cross (⫹) which appeared briefly for 100 ms. The trial duration was 2 s. Subjects were requested to discriminate the target covertly using their peripheral vision and to respond as quickly and accurately as possible by pressing a response button only when the target was an X. In the central expectancy task subjects were informed about the contingency between the cues and targets, while in the spatial priming task they were told that the cue was not predictive. There were equal numbers of left- and right-sided cues and targets. Reaction times were recorded in the cognitive laboratory and during functional imaging. Behavioral Procedures In the cognitive laboratory, behavioral responses were measured, and eye movements were monitored. Subjects sat 40 cm away from a 219 monitor. Stimuli were presented by Superlab software running on a Macintosh PowerPC 8100/80 (Apple, Cupertino, CA) computer. Eye movements were recorded using an ISCAN infra-red monitoring system (ISCAN Co., Burlington, MA). Subjects performed at least 360 trials for the central expectancy task and 192 trials for the spatial priming task. We assessed whether subjects could maintain central fixation throughout all phases of the tasks, and whether they showed evidence of attentional shifts based on reaction times to valid versus invalid conditions. A longer reaction time to the invalid condition indicated that a shift of attention had taken place. Eye movements were examined dynamically with the Ilab software (D. R. Gitelman) by displaying a map of eye position overlaid on the stimuli the subjects were viewing. The reaction time data were analyzed by a repeatedmeasures analysis of variance (ANOVA) on reaction times with a factor of validity. The presence of shorter reaction times during valid trials (P ⬍ 0.05) indicated that the subject’s attentional focus was effectively shifted to the cued side (validity effect). Only subjects who were able to maintain eye fixation at the center and who had significantly shorter reaction times to
271
valid trials on the tasks were included in the functional MRI study (see Results). For the functional MRI experiment, the tasks were designed as a series of alternating active and baseline conditions. In the first experiment, the active condition consisted of the spatial priming task described above, and the baseline condition consisted of the static display of all visual stimuli during which subjects maintained central fixation, but did not respond. In the second experiment, the active condition consisted of the central expectancy task described above, and the baseline condition consisted of a similar static display. Fifteen trials occurred during each active condition block. The task order was counterbalanced across subjects. MR Imaging Procedures All subjects were imaged using a Siemens 1.5 Tesla Vision scanner. Their heads were fixed using a vacuum bag (VacFix, Toledo, Ohio) in concert with the positioning calipers built into the head coil. They were given a nonmagnetic button, which allowed them to respond to the target stimuli. Thirty-two slices were acquired using a susceptibility weighted single shot EPI method (TR/TE 4350/40 ms, flip angle 90°, FOV 220 mm, 64 ⫻ 64 matrix, slice thickness 4 mm). In all functional runs, the MR signal was allowed to achieve equilibrium over four scans that were excluded from analysis. Each functional run consisted of 112 images, representing 8 alternating rest-active pairs. Anatomic images were acquired using a 3D FLASH sequence with the following imaging parameters (TR/TE 15/6 ms, flip angle 15°, FOV 220 mm, matrix 256 ⫻ 256, slice thickness 1.0 mm). All anatomic and functional slices were obtained in transaxial planes parallel to the AC–PC line. Stimuli were presented by Superlab software (Cedrus Co., Phoenix, AZ) running on a Macintosh Quadra 700 computer (Apple, Cupertino, CA). The images were projected onto a custom-designed, nonmagnetic rear projection screen. Subjects viewed the screen located approximately 170 cm from their eyes via a mirror. Reaction times were recorded in the magnet and only subjects who showed the validity effect in the magnet were included in the data analysis. MR Imaging Data Analysis FMRI data were analyzed using the SPM-96 software (Wellcome Department of Cognitive Neurology, London, UK) running under the MATLAB environment (Mathworks Inc., Sherborn, MA) (Friston et al., 1994a, 1994b, 1995a, 1995b, 1995c, 1996; Worsley et al., 1996). Application Visualization System (AVS) software (Advanced Visual Systems, Waltham, MA) was used for
272
KIM ET AL.
TABLE 1
TABLE 2
Response Time in Milliseconds (Mean ⫾ SD) as a Function of Cue Validity
Regions of Significant Activation in the Central Expectancy and Spatial Priming Tasks
Task condition
Valid trials
Invalid trials
P value
Spatial priming (n ⫽ 7) Central expectancy (n ⫽ 7)
384 ⫾ 42 389 ⫾ 36
407 ⫾ 43 450 ⫾ 67
0.003 0.01
Spatial priming task Coordinates Brain regions (BA)
image overlay, scalp editing, volume rendering and image display. All functional images were realigned and then coregistered to the anatomic images. Subsequently, they were spatially normalized into a standardized neuroanatomical space (Talairach and Tournoux, 1988) using a reference template image (Friston et al., 1995c). The images were smoothed using a 7 mm isotropic Gaussian kernel. The final FWHM was approximately 9.8 ⫻ 10.1 ⫻ 9.7 mm3, and the mean maximum motion correction estimates were 0.45, 0.82, and 0.85 mm in the x, y, and z directions, respectively. The functional data from each individual subject were analyzed with analysis of covariance (ANCOVA). Statistical parametric maps (SPMs) were obtained and voxels were considered significant if their Z scores were significant at P ⬍ 0.01 after correction for multiple comparisons. In addition, voxels within the brain regions hypothesized to be involved in the spatial attention were considered significant at P ⬍ 0.001 uncorrected. Cortical areas hypothesized to be engaged during the attention tasks were the posterior parietal cortex, the frontal eye fields (Paus et al., 1996), the medial frontal areas, the cingulate gyrus (Morecraft et al., 1993; Paus et al., 1993), the temporo-occipital cortex (DeYoe et al., 1996), and the insula (Coull et al., 1997). Subcortical areas hypothesized to be involved included the thalamus and the striatum (LaBerge and Buchsbaum, 1990).
Central expectancy task
SMA (6) Frontal eye field (6) Posterior parietal (7, 40) Temporo-occipital (22, 37) Insula
Coordinates
Side
x
y
z
Z
x
y
z
Z
Medial Right Left Right Left Right Left Right Left Anterior Posterior
0 45 ⫺39 27 ⫺30 60 ⫺45 54 ⫺36 12 0
6 ⫺3 ⫺6 ⫺48 ⫺45 ⫺39 ⫺60 12 18 21 ⫺24
48 51 51 42 39 12 ⫺9 ⫺3 9 30 24
7.07 7.69 7.07 5.56 5.19 7.12 4.48 4.73 3.73 3.27 5.05
0 42 ⫺42 33 ⫺39 63 ⫺54 48 ⫺39 12 0
6 ⫺3 0 ⫺51 ⫺45 ⫺42 ⫺51 21 15 21 ⫺18
51 54 54 60 57 12 6 ⫺6 3 30 24
7.98 7.84 7.07 6.78 7.14 7.83 7.82 5.83 6.44 4.45 4.26
39
42
24 4.08
36
42
Cingulate (24, 23) Dorsolateral prefrontal (9) Right Sensorimotor (3, 4) Left Thalamus Right Left Putamen Right Left Cerebellum Right Left
⫺42 15 ⫺12 27 ⫺27 27 ⫺21
24 5.53
⫺18 51 5.07 ⫺42 ⫺15 54 6.99 ⫺6 12 4.17 9 ⫺18 9 4.54 ⫺18 12 4.69 ⫺6 ⫺18 9 6.61 6 ⫺6 3.76 27 6 ⫺6 5.41 3 ⫺3 4.67 ⫺27 6 0 6.70 ⫺57 ⫺24 5.60 27 ⫺51 ⫺27 6.78 ⫺66 ⫺21 4.98 ⫺36 ⫺63 ⫺27 6.77
showed significant validity effects for the central expectancy task (F(1, 6) ⫽ 13.73, P ⬍ 0.05) during the imaging session. Only those subjects who showed validity effects were included in this study. Subjects responded faster in the valid trials than the invalid trials for both tasks (Table 1). There was significant interaction between task condition and validity of the cue (F(1, 12) ⫽ 5.03, P ⬍ 0.05). Subjects responded more slowly to invalidly cued targets in the central expectancy task than in the spatial priming task. The accuracy of both tasks were not significantly different.
RESULTS Behavioral Results
fMRI Activation of the Spatial Priming and the Central Expectancy Tasks
Ten subjects participated in the fMRI experiments. Of these 10, 7 showed significant validity effects for the spatial priming task (F(1, 6) ⫽ 58.47, P ⬍ 0.01) and 7
An identical set of areas were significantly activated by each of the two tasks. The cortical areas were located in the lateral premotor areas (frontal eye fields, FEF),
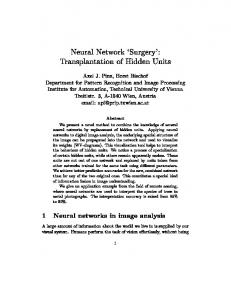
FIG. 2. (A) Activations seen in the spatial priming (A-1) and central expectancy (A-2) tasks. Each task activates a common set of areas in the frontal eye fields (FEF), banks of the intraparietal sulcus (IPS), the supplementary motor area-anterior cingulate cortex (SMA). The one difference is that the rightward asymmetry of IPS activation is much more pronounced in the spatial priming task. Activation of the left sensorimotor (SM) area is due to the button push response during the attention task. (B) Areas of cortical and subcortical activation obtained by conjunction analysis of the spatial priming and central expectancy tasks. The areas activated by both tasks include all components of the attentional network as well as the anterior insula (In) and the temporo-occipital region (TO). There was a rightward asymmetry in the IPS region activated by both tasks. CG, Cingulate gyrus; Pt, Putamen; Th, Thalamus. (C) Areas of activation obtained by subtraction of the spatial priming task from the central expectancy task. Significant differences are very few, emphasizing the close overlap in the distribution of activation obtained in the two tasks. (D) Red line shows the time-course of fMRI signals in the right posterior parietal region of one subject for the spatial priming (D-1) and central expectancy (D-2) tasks. Blue line shows the experimental design.
LARGE SCALE NEURAL NETWORK FOR SPATIAL ATTENTION
273
274
KIM ET AL.
the medial frontal lobe (supplementary motor area, SMA), the posterior parietal lobes (predominantly along the banks of the intraparietal sulcus), the cingulate gyrus, the temporo-occipital cortex in the middle and inferior temporal gyri, the insula, the dorsolateral prefrontal cortex, and the left sensorimotor cortex. Subcortical activation was observed in the thalamus (the junction of the mediodorsal and medial pulvinar nuclei), putamen, and cerebellum bilaterally. Table 2 summarizes the area of significant activation obtained by each task. The magnitude of activation was greater in the central expectancy task, especially in the posterior parietal and posterior middle temporal regions. Furthermore, the IPS activation was more asymmetric (right ⬎ left) in the spatial priming task (Fig. 2; A-1, A-2). In individual subjects, we defined a laterality index as the number of voxels in the right posterior parietal lobe minus that of the left posterior parietal lobe, divided by the number of voxels in both posterior parietal lobes (Right ⫺ Left/Right ⫹ Left). The mean laterality score was 0.52 in the spatial priming task and ⫺ 0.04 in the central expectancy task (P ⫽ 0.05).
TABLE 3 Regions of Significant Activation (Obtained by Conjunction Analysis) Common to the Spatial Priming and Central Expectancy Tasks Coordinates Brain regions (BA) SMA (6) Frontal eye fields (6) Posterior parietal (7, 40) Temporo-occipital (22, 37) Insula Cingulate (24, 23) Dorsolateral prefrontal (9) Sensorimotor (3, 4) Thalamus Putamen Cerebellum
fMRI Activation Obtained by Conjunction Analysis of the Spatial Priming and Central Expectancy Tasks The group conjunction analysis of fMRI activation during two tasks is considered to reflect the regions subserving common cognitive operations underlying both tasks (Price and Friston, 1997). The cortical areas described below were significantly activated by conjunction analysis of both tasks (Table 3 and Fig. 2B). Lateral premotor areas (frontal eye fields). The lateral premotor activations extended into the regions usually included within the frontal eye fields. The peaks of activation were mainly located in the precentral gyrus at the level of the middle frontal gyrus in BA 6 in both hemispheres. In the right hemisphere, the area of activation extended from BA 4 posteriorly, to the dorsolateral prefrontal cortex (BA 44 and BA 9) ventroanteriorly, and to the superior frontal gyrus (BA 6) superiorly. SMA. Large foci of activation were obtained in the SMA. The peaks fell in BA 6 of medial frontal cortex and extended ventrally to the cingulate sulcus. Posterior parietal lobe. The posterior parietal lobes were activated bilaterally but with greater activation on the right. In the left hemisphere, the activation peaks were located within the intraparietal sulcus (IPS), and the adjacent inferior parietal lobule (IPL), including the supramarginal gyrus (BA 40). In the right hemisphere, a major activation peak was also located within the IPS, however, subpeaks also extended to the superior parietal lobule (SPL) (BA 7) superiorly, and to the supramarginal (BA 40) and angular gyri (BA 39).
Side
x
y
z
Z
Medial Right Left Right Left Right Left Right Left Anterior Posterior Right Left Right Left Right Left Right Left
0 42 ⫺42 33 ⫺30 60 ⫺51 42 ⫺45 12 3 39 ⫺42 12 ⫺6 27 ⫺27 27 ⫺39
6 ⫺3 3 ⫺54 ⫺48 ⫺39 ⫺51 24 ⫺3 21 ⫺24 42 ⫺12 ⫺15 ⫺18 6 3 ⫺54 ⫺60
48 54 33 51 45 12 12 ⫺6 3 30 24 24 54 6 9 ⫺6 0 ⫺24 ⫺27
10.63 10.86 7.44 8.44 7.07 10.48 7.86 6.75 5.63 5.46 6.32 6.68 8.49 5.64 7.92 6.48 7.66 7.72 7.26
Cingulate gyrus. Separate activation peaks were observed in the anterior and posterior regions of the cingulate gyrus. The anterior peak was located dorsally in BA 24 at the cingulate sulcus and the posterior peak was located ventrally in BA 23. Temporo-occipital cortex. The posterior temporal gyri were activated bilaterally. The activation peaks were located in the posterior aspect of the superior and middle temporal gyri in BA 22 and 37, respectively. Subpeaks also extended posteriorly to the junction of BA 22 and 39 (junction of posterior superior temporal gyrus and angular gyrus), BA 37 and 39 (junction of posterior middle temporal gyrus and angular gyrus), and BA 19 and 37 (junction of posterior inferior temporal gyrus and inferior occipital gyrus) bilaterally. Insula. The insula was bilaterally activated. The activation peaks were observed mainly in the anterior region of the insula. The inferior frontal gyrus adjacent to the insula was also activated in BA 44 and 45 in the right hemisphere. Sensorimotor cortex. The central sulcus and adjacent pre- and postcentral gyri were activated in the left hemisphere. The activation peaks were located in BA 4, 3, 1, and 2. This activation can be attributed to the button push response which was done with the right hand in the experimental task but not in the control task. Subcortical activation. The thalamus and the putamen were activated bilaterally. In both regions, the activation was greater in the left. The cerebellum was
LARGE SCALE NEURAL NETWORK FOR SPATIAL ATTENTION
also activated bilaterally and the activation was more extensive in the right. Some of these activations may also reflect the button push with the right hand. fMRI Activation Obtained by Subtraction between Two Tasks Central expectancy minus spatial priming. Two main areas of difference were observed when the fMRI activation obtained by the spatial priming task was subtracted from that of the central expectancy task. These areas were located in the left posterior parietal region and the temporo-occipital region bilaterally (Fig. 2C). Table 4 summarizes the significant differences obtained by subtraction between two tasks. Spatial priming minus central expectancy. None of the differences were significant after correction for multiple comparisons. DISCUSSION The exogenous shifting of attention by a spatial priming task and the endogenous shifting of attention by an expectancy-generating task yielded activations in a common large-scale attentional network. The components of this network included the posterior parietal cortex, the lateral premotor area (including the frontal eye fields), the cingulate gyrus, the thalamus, and the striatum. In addition, both tasks led to activations in the supplementary motor area, temporo-occipital cortex in the middle and inferior temporal gyri, the anterior insula, and the dorsolateral prefrontal cortex. A conjunction analysis, done to isolate activations caused by cognitive components common to both tasks (Price and Friston, 1997), supported the conclusion that this network of cortical and subcortical components subserves both exogenously and endogenously triggered shifts of spatial attention. The conjunction analysis also showed that the posterior parietal activation associated with the attentional function common to both tasks was more extensive in the right hemisphere. The more extensive right hemisphere activation in tasks that required subjects to shift attention equally to the left and to the right is consistent with a right hemisphere specialization model for the distribuTABLE 4 Regions of Significant Differences Obtained by Subtraction of Spatial Priming from Central Expectancy Coordinates Brain regions (BA) Posterior parietal (7) Temporo-occipital (37)
Side
x
y
z
Z
Left Right Left
⫺39 54 ⫺54
⫺45 ⫺54 ⫺51
57 3 6
5.06 4.59 5.25
275
tion of attention within the extrapersonal space (Heilman, 1980; Mesulam, 1981). This model, based on the assumption that the left hemisphere directs attention predominantly to the contralateral right side, whereas the right hemisphere directs attention to both hemispheres, has been confirmed in the course of previous functional imaging experiments using various behavioral tasks (Corbetta et al., 1993, 1995; Gitelman et al., 1996a, 1996b; Nobre et al., 1997). Some task-related differences were also identified. First, activations in the posterior parietal and temporooccipital regions were more extensive in response to directional cues which triggered endogenously generated shifts of spatial expectancy. Furthermore, the rightward asymmetry in the parietal cortex was more prominent in the spatial priming task and was quite inconspicuous in the endogenous cueing task. The possibility that attentional tasks with a heavy loading of endogenous (perhaps verbally mediated) determinants may show either no asymmetry or even more prominent left hemisphere activation has been raised previously (Nobre et al., 1996). In that study, a task based on peripherally cued attentional shifts elicited more right hemisphere activation, whereas a task requiring the subject to cognitively shift attention in a direction opposite to that of the peripheral cue elicited greater left hemisphere activation. The exogenously triggered attentional shifts were more heavily dominated by purely spatial determinants, another reason why it may have elicited a more asymmetric activation of the right hemisphere. However, the task based on peripherally cued attentional shifts contained a greater percentage of invalid trials, a factor which may also have contributed to the taskrelated differences noted in this study. The temporo-occipital activation (TO in Fig. 2), overlaps, at least in part, the area that has been designated MT⫹ by DeYoe et al., (1996) and which includes a number of movement-sensitive areas such as MT, MST, and FST. At least in the monkey brain, MST, and FST are interconnected with the frontal eye fields, posterior parietal cortex, and the cingulate gyrus, the three cortical epicenters of the attentional network (Mesulam et al., 1977; Barbas and Mesulam, 1981; Pandya et al., 1981; Boussaoud et al., 1990). In a recent study with stringent controls for the nonattentional components of the task, prominent activations in this temporooccipital area were associated with covert shifts of attention (Gitelman et al., in press). The activation of this area may reflect the inferred movement of the attentional focus across the visual scene. The present study shows that this area may be more closely associated with endogenously triggered shifts of spatial attention. Previous investigations have shown that tasks of spatial attention based on manual exploration (Gitel-
276
KIM ET AL.
man et al., 1996a), oculomotor exploration (Gitelman et al., 1997), and auditory cues (Medvedev et al., 1997) also activate an identical network of cortical areas. Taken together with the results reported above, these experiments support the conclusion that the frontal eye fields, posterior parietal cortex, and the cingulate gyrus provide the cortical epicenters of a macroscopic distributed network which coordinates all aspects of spatial attention. At a more microscopic level, components of this network may well show behavioral specializations. In fact, the greater rightward asymmetry in the exogenous cueing task and the greater activation of the posterior parietal and temporo-occipital cortices in the endogenous cueing task provide some evidence for task-related differences in the internal organization of this network. ACKNOWLEDGMENTS This study was supported by grants from the Korean Scientific and Engineering Foundation (Dr. Y.-H. Kim), McDonnell-Pew Foundation (Dr. D. R. Gitelman), and NIH (NS30863-03, Dr. M.-M. Mesulam).
REFERENCES Barbas, H., and Mesulam, M.-M. 1981. Organization of afferent input to subdivisions of area 8 in the rhesus monkey. J. Comp. Neurol. 200:407–431. Boussaoud, D., Unserleider, L. G., and Desimone, R. 1990. Pathways for motion analysis: Cortical connections of the medial superior temporal and fundus of the superior temporal visual areas in the Macaque. J. Comp. Neurol. 296:462–495. Corbetta, M., Miezin, F. M., Schulman, G. L., and Petersen, S. E. 1993. A PET study of visuospatial attention. J. Neurosci. 13(3):1202– 1226. Corbetta, M., Schulman, G. L., Miezin, F. M., and Petersen, S. E. 1995. Superior parietal cortex activation during spatial attention shifts and visual feature conjunction. Science 270:802–805. Coull, J. T., Frith, C. D., and Nobre, A. C. 1997. FMRI reveals distinct neuronal networks for attention to time or space. Abstr. Soc. Neurosci. 23:1589. DeYoe, E. A., Carman, G. J., Bandettini, P., Glickman, S., Wieser, J., Cox, R., Miller, D., and Neiz, J. 1996. Mapping striate and extrastriate visual areas in human cerebral cortex. Proc. Natl. Acad. Sci. USA 93:2382–2386. Friston, K. J., Jezzard, P., and Turner, R. 1994a. Analysis of functional MRI time-series. Human Brain Mapping 1:153–171. Friston, K. J., Worsley, K. J., and Frackowiak, R. S. J. 1994b. Assessing the significance of focal activations using their spatial extent. Human Brain Mapping 1:210–220. Friston, K. J., Ashburner, J., and Frith, C. D. 1995a. A spatial registration and normalization of images. Human Brain Mapping 3:165–189. Friston, K. J., Holmes, A. P., and Poline, J. B. 1995b. Analysis of fMRI time-series revisited. Neuroimage 2:45–63. Friston, K. J., Holmes, A. P., and Worsley, K. J. 1995c. Statiatical parametric maps in functional imaging: A general linear approach. Human Brain Mapping 2:189–210.
Friston, K. J., Williams, S. R., and Howard, R. 1996. Movementrelated effects in fMRI time-series. MRM 35:346–355. Gitelman, D. R., Alpert, N. M., Kosslyn, S., Daffner, K., Scinto, L., Thompson, W., and Mesulam, M.-M. 1996a. Functional imaging of human right hemispheric activation for exploratory movements. Ann. Neurol. 39:174–179. Gitelman, D. R., Kim, Y.-H., Parrish, T. B., Norbre, A. C., Meyer, J. R., Hallam, D., Callahan, C., Russell, E. J., and Mesulam, M.-M. 1997. Superior colliculus activation by overt but not covert spatial attention tasks, visualized by functional magnetic resonance imaging. Neuroimage 5(4):S61. Gitelman, D. R., Nobre, A. C., Parrish, T. B., Kim, Y.-H., Callahan, C. M., Meyer, J. R., Russell, E. J., and Mesulam, M.-M. in press. A large-scale distributed network for spatial attention: An fMRI study with stringent behavioral controls. Brain. Gitelman, D. R., Weintraub, S., Grujic, S. M., Meyer, J. R., Farina, A. M., Russell, E. J., Mesulam, M.-M. 1995. Differential effects of spatial and expectancy cues on covert shifts of attention. Society for Neuroscience Abstracts 21:937. Heilman, K. M., and Van Den Abell, T. 1980. Right hemisphere dominance for attention: The mechanism underlying hemispheric asymmetries of inattention (neglect). Neurology 30:327–330. Jonides, J. 1981. Voluntary versus automatic control over the mind’s eye’s movement. In Attention and Performance (M. I. Posner and O. Marin, Eds.), Vol. XI, pp. 187–205. Hillsdale, Erlbaum, NJ. LaBerge, D., and Buchsbaum, M. S. 1990. Positron emission tomographic measurements of pulvinar activity during an attention task. J. Neurosci. 10(2):613–619. Medvedev, S. V., Vorobiev, V. A., Roudas, M. S., Pakhomov, S. V., Alho, K., Matanen, R., Reinikainen, K., and Tervaniemi, M. 1997. Human brain structures in sustaining lateralized auditory attention: Two PET studies comparison. Neuroimage 5(4):S76. Mesulam, M.-M., Van Hoesen, G. W., Pandya, D. N., and Geschwind, N. 1977. Limbic and sensory connections of the inferior parietal lobule (area PG) in the rhesus monkey: A study with a new method for horseradish peroxidase histochemistry. Brain Res. 136:393– 414. Mesulam, M.-M. 1981. A cortical network for directed attention and unilateral neglect. Ann. Neurol. 10:309–325. Mesulam, M.-M. 1983. The functional anatomy and hemispheric specialization for directed attention. The role of the parietal lobe and its connectivity. Trends Neurosci. 6(9):384–387. Mesulam, M.-M. 1990. Large-scale neurocognitive networks and distributed processing for attention, language, and memory. Ann. Neurol. 28:597–613. Mesulam, M.-M., in press. Spatial attention and neglect: parietal, frontal and cingulate contributions to the mental representation and attentional targeting of salient extrapersonal events. In Philosophical Transactions of the Royal Society, London: Biological. Morecraft, R. J., Geula, C., and Mesulam, M.-M. 1993. Architecture of connectivity within a cingulo-fronto-parietal neurocognitive network for directed attention. Arch. Neurol. 50:279–284. Mu¨ller, H. J., and Rabbitt, P. M. A. 1989. Reflexive and voluntary orienting of visual attention: Time course of activation and resistance to interruption. J. Exp. Psychol. 15(2):315–330. Nobre, A. C., Sebestyen, G. N., Gitelman, D. R., Mesulam, M.-M., and Frackowiak, S. J., Frith, C. D. 1997. Functional localization of the system for visuospatial attention using positron emission tomography. Brain 120:515–533. Oldfield, R. C. 1971. The assessment and analysis of handedness: The Edinburgh inventory. Neuropsychologia 87:256–259. Pandya, D. N., Van Hoesen, G. W., and Mesulam, M.-M. 1981. Efferent connections of the cingulate gyrus in the rhesus monkey. Exp.
LARGE SCALE NEURAL NETWORK FOR SPATIAL ATTENTION Parasuraman, R., Greenwood, P. M., Haxby, J. V., Grady, C. L. 1992. Visuospatial attention in dementia of the Alzheimer type. Brain 115:711–733. Paus, T., Petrides, M., Evans, A. C., and Meyer, E. 1993. Role of the human anterior cingulate cortex in the control of occulomotor, manual, and speech responses: A positron emission tomography study. J. Neurophysiol. 70(2):453–469. Paus, T. 1996. Location and function of the human frontal eye field: A selective review. Neuropsychologia 34(6):475–483. Posner, M. I. 1980. Orienting of attention. Quart. J. Exp. Psychol. 32:3–25. Posner, M. I., Cohen, Y., and Rafal, R. D. 1982. Neural systems control of spatial orienting. Phil. Trans. R. Soc. Lond. B298:187–198. Posner, M. I., Walker, J. A., Friedrich, F. J., and Rafal, R. D. 1984.
277
Effect of parietal injury on covert orienting of attention. J. Neurosci. 4(7):1863–1874. Price, C. J., and Friston, K. J. 1997. cognitive conjunction: A new approach to brain activation experiments. Neuroimage 5:261–170. Talairach, J., and Tournoux, P. 1998. Coplanar stereotaxic atlas of the human brain. Stuttgart, Thieme. Worsley, K. J., Marrett, S., Neelin, P., Vandal, A. C., Friston, K. J., and Evans, A. C. 1996. A unified statistical approach for determining significant signals in images of cerebral activation. Human Brain Mapping 4:58–73. Yamaguchi, S., Tsuchiya, H., and Kobayashi, S. 1994. Electroencephalographic activity associated with shifts of visuospatial attention. Brain 117:553–562.