Jan 17, 1995 - could form a major part of the ATLAS level-1 trigger system. Utilising novel techniques, but with today's ..... 6.1 Timing control and set-up .
RD27 note 34 ATLAS Note DAQ–NO–30 17 January 1995
THE LEVEL-1 CALORIMETER TRIGGER SYSTEM FOR ATLAS I.P. Brawn, R.E. Carney, J. Garvey, D. Rees, R. Staley, P. Watkins, A.T. Watson School of Physics and Space Research, University of Birmingham, Birmingham, UK N. Ellis CERN, Geneva, Switzerland C. Geweniger, P. Hanke, E.-E. Kluge, A. Putzer, B. Rensch, K. Tittel, M. Wunsch Institut für Hochenergiephysik der Universität Heidelberg, Heidelberg, Germany E. Eisenhandler, M. Landon, J.M. Pentney, G. Thompson Physics Department, Queen Mary & Westfield College, University of London, London, UK J. Edwards, C.N.P. Gee, A.R. Gillman, R. Hatley, J. Leake, V. Perera, T.P. Shah Rutherford Appleton Laboratory, Chilton, Didcot, Oxon., UK R. Sundblad Sicon, Linköping, Sweden G. Appelquist, C. Bohm, M. Engström, S. Hellman, S-O. Holmgren, E. Johansson, N. Yamdagni, X. Zhao Physics Department, University of Stockholm , Stockholm, Sweden
Abstract We describe the design of a digital calorimeter trigger processor system which could form a major part of the ATLAS level-1 trigger system. Utilising novel techniques, but with today’s technologies, the system can be contained within six electronics crates and will provide the central trigger logic with signals from events with high-pT electrons, photons, jets and missing ET. Communication with the trigger digitisation system will employ commercial highspeed optical links, terminating in multi-chip modules (MCMs) incorporating custom-designed integrated optics. Simulation studies combined with an extensive demonstrator programme have been used to develop flexible digital algorithms with programmable parameters for bunch-crossing identification and electromagnetic cluster-finding. These algorithms will be embedded in semicustom application-specific integrated circuits, of which five types will be designed. Inter-crate data fan-out will be achieved by means of optical splitters, while communication within crates will use transmission-line backplanes. The remaining technical issues will be studied in the final phase of the current R&D demonstrator programme. A parallel demonstrator programme is also under way to study alternative techniques with the potential for future system enhancement.
Contents 1. Introduction ......................................................................................................... 4 2. Trigger algorithms and simulation studies .......................................................... 6 2.1. Required trigger functions ...................................................................... 6 2.2 Physics simulations .................................................................................. 7 2.2.1 Electromagnetic cluster trigger .................................................... 8 2.2.2 Jet trigger...................................................................................... 9 2.2.3 Missing-ET trigger ....................................................................... 9 2.2.4 Detector simulation ...................................................................... 9 2.3 Electromagnetic-cluster trigger algorithm ............................................. 10 2.3.1 Input data.................................................................................... 10 2.3.2 Cluster algorithm........................................................................ 10 2.3.3 Isolation algorithm ..................................................................... 12 2.3.4 Cluster counting and region-of-interest generation ................... 15 2.4 Jet trigger algorithm ............................................................................... 17 2.5 Missing-ET trigger algorithm ................................................................ 19 2.6 Expected trigger rates at design luminosity ........................................... 20 2.7 Requirements for low-luminosity running ............................................. 21 3. Trigger system design ....................................................................................... 23 3.1 Introduction ............................................................................................ 23 3.2 The front-end digitisation system .......................................................... 24 3.2.1 Bunch-crossing identification for non-FERMI systems ............ 25 3.3 Electron/photon trigger logic ................................................................. 26 3.3.1 Integrated-optics multi-chip module .......................................... 27 3.3.2 Optical-to-electrical converter ................................................... 27 3.3.3 Serial-to-parallel converter ........................................................ 28 3.3.4 Serialising ASIC ........................................................................ 28 3.4 Cluster processing .................................................................................. 29 3.4.1 E.M. cluster trigger algorithm .................................................... 29 3.4.2 Cluster ASIC .............................................................................. 29 3.4.3 Cluster processor module ........................................................... 30 3.4.4 Fan-in and fan-out ...................................................................... 31 3.5 Missing-ET logic.................................................................................... 32 3.5.1 Results module ........................................................................... 32 3.5.2 Missing-ET module.................................................................... 32 3.6 Jet trigger logic....................................................................................... 33 3.7 Cluster counting ..................................................................................... 35 3.8 Readout controller .................................................................................. 36 3.8.1 Data transfer procedure .............................................................. 37 3.9 Testing and monitoring facilities ........................................................... 38 3.10 System crates........................................................................................ 39 3.10.1 Cluster processor crates ........................................................... 39 3.10.2 Jet processor crate .................................................................... 39 3.10.3 E.M. cluster-counting crate ...................................................... 39 3.10.4 Overall system.......................................................................... 39 3.11 Summary and conclusions ................................................................... 39 4. Technical details and layout .............................................................................. 40 4.1 Physical location underground ............................................................... 40 4.2 Power dissipation and cooling ............................................................... 40 4.3 Crate structure and physical layout ........................................................ 41 - 2-
4.4 Backplane ............................................................................................... 41 4.5 Control bus ............................................................................................. 41 4.6 Optical fibre handling ............................................................................ 41 4.6.1 Cables ......................................................................................... 41 4.6.2 Fan-outs ...................................................................................... 41 4.6.3 Connectors ................................................................................. 41 5. Connections to other parts of the trigger system............................................... 42 5.1 Central trigger logic ............................................................................... 42 5.2 Level-1 calorimeter sub-trigger data patterns ........................................ 43 5.3 Level-1/level-2 interface ........................................................................ 43 5.4 Region-of-interest information .............................................................. 44 6. Trigger operation............................................................................................... 44 6.1 Timing control and set-up ...................................................................... 44 6.2 Monitoring ............................................................................................. 45 6.3 Module testing and repair ...................................................................... 45 6.4 Control computers .................................................................................. 45 6.5 Latency estimate .................................................................................... 46 7. Demonstrator and prototyping strategy............................................................. 49 7.1 Overview ................................................................................................ 49 7.2 Final system prototyping ........................................................................ 49 8. Estimated timescale........................................................................................... 50 References ............................................................................................................. 50
- 3-
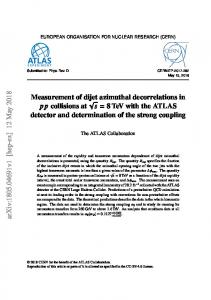
1. Introduction The design luminosity of the LHC is 10 34 cm –2 s –1. At this luminosity the interaction rate is about 10 9 s –1, and with a bunch crossing every 25 ns there will be on average 18 inelastic p–p interactions per crossing. The present plan for ATLAS is to have three levels of trigger corresponding to the input and output rates indicated in figure 1.1. The 25 ns period between bunch crossings is too short to allow a trigger selection to be made in real time. As a result, the level-1 triggers have to be designed to operate in 25 ns steps, the number of steps required depending on the complexity of the trigger. For this and other reasons, the front-end detector electronics has to incorporate pipeline memories to store the detector data until a level-1 trigger decision has been made. In ATLAS, these pipelines are ~2 µs long. This puts a severe constraint on the time available for the level-1 trigger. After allowing for unavoidable delays due mainly to signal transport, the level-1 trigger must have a total latency of ~1 µs. FRONT-END
40 MHz PIPELINE MEMORY
LEVEL-1 10 - 100 kHz
BUFFER
RoI LEVEL-2
100 - 1000 Hz EVENT BUILDER
LEVEL-3 10 - 100 Hz MASS STORAGE
Figure 1.1: Multi-level trigger architecture. The reduction in rate that must be achieved by the level-1 trigger is determined by the detector readout time, and the capabilities of level-2 trigger. The level-2 trigger is based on microprocessors and will have access to data with the full detector granularity. It is not at present envisaged that the level-2 trigger will process all detector data, but rather that it will be directed towards regions of interest (RoI) identified by level-1. The current aim, as indicated in figure 1.1, is to have an input rate of 10 4 – 105 Hz into level-2, which corresponds to a level-1 trigger acceptance of one interaction in 10 5 – 104 . A discussion of these issues may be found in reference [1]. Achieving such a large rejection at level-1 while retaining interesting physics interactions with a high efficiency will not be easy. Such a rejection factor significantly exceeds rejection levels achieved in previous trigger systems on hadronic colliders. Interactions are selected if they contain signatures such as high-pT leptons or photons, or very high-pT jets. The level-1 muon trigger is implemented using dedicated detectors placed outside the central trackers and calorimeters of the experiment. The other level-1 triggers use calorimeter information. - 4-
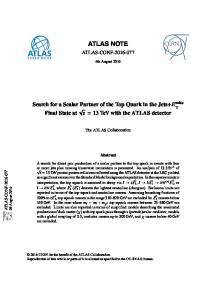
The level-1 calorimeter trigger described here and proposed for ATLAS will accept signals from the electromagnetic (e.m.) liquid argon calorimeter and also from the hadronic scintillator tile calorimeter. The components of the proposed calorimeter trigger are shown in figure 1.2 (note that the first stages may be integrated into the front-end electronics). The figure also shows the location of these components, some being on the experiment and some in a nearby control room. The sources of the RoIs needed for the level-2 trigger are indicated. The optical fibre links are at present envisaged as being approximately 65 m long. Calorimeter Analogue Sum FADC
On Detector
or FERMI
Look-up table BCID Transmit Module
Fibre Link
Electromagnetic Cluster Module
In Trigger Control Room
Jet Module
Missing-ET Module Decluster Module
Decluster Module RoI
Muon Trigger RoI
Level-1 Central Trigger Logic
Figure 1.2: Components of the level-1 calorimeter trigger. The most challenging part of the level-1 trigger is the electromagnetic cluster finding. The aim is to have a good trigger efficiency for single electromagnetic clusters down to 40 GeV transverse energy. Here the problem is to define an affordable trigger granularity which is sufficiently fine to reduce the rate of triggers coming from hadronic jets. We are confident that our design will be able to achieve this aim. For interactions that satisfy a trigger requirement of more than one e.m. cluster, the rate of false triggers from jets is much lower at a given threshold, and a cluster-trigger threshold of about 20 GeV should be possible. For jet triggers and missing transverse energy triggers, a much coarser granularity is acceptable at the trigger level. A full simulation of the performance of the trigger is described in section 2, and predicted trigger rates are presented, in particular for the electromagnetic cluster trigger as a function of transverse energy. A detailed description of the proposed implementation of the logic of the trigger is given in section 3. This is examined at the individual electronic-module level, indicating the function of each. In section 4 the physical layout of the various components of the trigger is presented, together with a description of a solution to the difficult connectivity problems which have to be solved. In section 5 the problem of information for the level-1 central trigger logic and for level-2 is discussed and present solutions outlined. Operational problems of trigger timing, control and monitoring are discussed in section 6. - 5-
An active programme of demonstrator projects is presently under way to test the most critical parts of the overall design. The results obtained from this will obviously have a significant influence on what is finally deemed to be a viable solution to the level-1 calorimeter trigger for ATLAS, and may result in changes to the design described here. This programme is presented in briefly in section 7, and in much more detail in references [2] and [3]. Finally, in section 8 we present the timescale. Cost and manpower estimates will be detailed elsewhere.
2. Trigger algorithms and simulation studies 2.1. Required trigger functions The primary purpose of the level-1 trigger is to reduce the event rate to a level acceptable to the level-2 trigger, without sacrificing physics acceptance. In light of the exploratory nature of the LHC programme and the uncertainty about the conditions in which the trigger will have to operate, flexibility will be a prime requirement for the design. The ATLAS philosophy for the level-1 calorimeter trigger is to base the trigger decision on combinations of physics signatures, primarily: • Electromagnetic showers (electrons, photons). • Jets (quarks, gluons). • Missing ET (neutrinos, other weakly-interacting particles). Other triggers for specific circumstances and events may also be required. These will be dealt with later. At design luminosity the physics requirement will be efficient triggering on the production of objects of masses greater than or of the order of those of the W and Z bosons, processes associated with lower mass scales having been studied at lower-energy machines. Table 2.1 lists a few possible processes, and suggests trigger selections and thresholds suitable for these. These requirements were derived from the results of the ATLAS physics subgroups. The maximum rapidity required for electron/photon identification in any channel is |η| ≈ 2.5, which is therefore the limit of coverage of the inner tracking detectors. From the above we see that at design luminosity the physics requires the ability to trigger efficiently at level-1 on: • Single isolated leptons and photons with E T > 40 GeV, |η| < 2.5 • Pairs of leptons and photons with E T > 20 GeV, |η| < 2.5 • Pairs of jets with ET > 300 GeV, |η| < 3.0 • Pairs of jets with ET > 200 GeV plus missing ET > 100 GeV A technical requirement is that the maximum rate of level-1 trigger accepts remains within the level-2 acceptance, i.e. < 100 kHz. The mean rate must therefore be somewhat lower. Since there are significant uncertainties in the proton structure functions, and hence in estimates of event rates in the kinematical region of interest for triggering, it would be prudent in designing algorithms to require the expected mean trigger rate not to exceed a few tens of kilohertz. Trigger requirements at lower luminosity are broadly similar, although one process, potentially accessible at 1033 cm–2 s–1 has been identified which would require lower singleelectron thresholds (see section 2.7). There are also other demands made on the first and second-level trigger systems by B-physics triggers. This subject is discussed in more detail later. - 6-
Another requirement on the level-1 trigger is that it should be able to identify the positions of electron/photon and jet candidates for the level-2 trigger. The second-level decision and event classification may use information about objects with ET lower than those used in the level-1 selection, e.g. E T > 10 GeV/c electrons for intermediate-mass Higgs candidates, and so additional trigger selections at lower thresholds, not contributing to the level-1 decision, are foreseen. Process H0 → γ γ
Signature ETγ 1 > 40 GeV E γ 2 > 25 GeV
≥1γ, ET > 40 GeV
two lepton pairs,
≥2e, ET > 20 GeV
one M ll = MZ ± 10 GeV/c2
≥2µ, pT > 20 GeV
T
H0 → Z Z * → l+ l–l+ l– (M H < 2MZ)
Level-1 selections ≥2γ, ET > 20 GeV
e+µ, ET > 20 GeV H0 → Z Z → l+ l–l+ l–
two lepton pairs,
≥2e, ET > 20 GeV
(M H > 2MZ)
both M ll = MZ ± 10 GeV/c2
≥2µ, pT > 20 GeV e+µ, ET > 20 GeV
+
–
Z→ l l
Z-mass requirement
≥2 l, ET > 20 GeV
W → lν
lepton pT and missing ET
≥1 l, ET > 40 GeV
top: 3 jets + leptons
two jets with M W + 1 jet of pT > 50 GeV opposite lepton
≥1 l, ET > 40 GeV
Multijets
three jets, pT > 300 GeV
SUSY: Classical
circularity of events
SUSY: Cascade
two Z → l+ l–candidates, 4-lepton mass > 250 GeV + missing ET > 100 GeV
≥3jets, E T > 250 GeV ≥3jets, E T > 250 GeV + missing ET > 200 GeV ≥2 l, ET > 30 GeV
Table 2.1: Benchmark physics processes and trigger criteria. In addition to the primary triggers described above, additional triggers have been suggested for specialised purposes, such as tau triggers, isolated high-pT hadrons, heavy-ion triggers, cosmic-ray and beam-halo triggers, as well as monitoring and calibration triggers. These have generally received less study, but will be mentioned below. The pulses produced by showers in the calorimeters are longer than the bunch-crossing interval. A requirement of all the trigger algorithms is that substantial calorimeter signals be uniquely and accurately associated with a particular bunch crossing. Algorithms to perform this bunch-crossing identification and the results of first prototype tests are described later in this report. In the following sections it will be assumed that accurate and reliable bunchcrossing identification has been achieved pulses above a few GeV. 2.2 Physics simulations The choice of trigger algorithms is based on simulations of possible LHC physics processes and the expected response of the ATLAS detector. Simulation studies are used to identify algorithms having the required performance (efficiency and background rejection) and also to - 7-
decide on the values of parameters which cannot easily be changed, such as the granularity of readout of the calorimeter signals. The challenges of the electromagnetic-cluster, jet and missing-E T triggers are different, and require different data samples as input to the design. 2.2.1 Electromagnetic cluster trigger The electromagnetic cluster trigger is in many respects the most challenging of the three main components of the calorimeter trigger. One reason for this is that it requires the lowest trigger thresholds, and also the finest granularity of data. Another is that there is a large physics background coming from jets (in contrast to the jet trigger, which is essentially backgroundfree since jet production is itself the dominant high-p T process). In practice, at design luminosity jets are likely to dominate the trigger rate. All e.m. cluster algorithms studied [4] contain two elements. The first is a threshold applied to a narrow cluster of energy in the e.m. calorimeter, the signature of an e.m. shower. The second is an ‘isolation’ requirement, i.e. a veto on clusters with significant energy deposits nearby in the e.m. calorimeter. This is to reduce the large background from jets containing high-pT π 0 s or early-showering hadrons. For efficiency studies, samples of events consisting of single electrons or photons were generated at different transverse momenta and over the full rapidity coverage of the inner tracker. These samples were used to study threshold sharpness for different cluster definitions and cell granularities, efficiency as a function of isolation algorithm and threshold, and the effect of electronic noise. Minimum-bias events, generated using PYTHIA 5.7, were superimposed to simulate the effect of pile-up. The main limitation of these samples as a predictor of physics performance of the trigger is that the single-particle events do not contain an underlying event or the extra jets which might be produced in some physics processes. Therefore, as a cross-check, the efficiency of the proposed selections was studied using a few representative possible physics processes, namely: • H0 → γ γ; MH = 120 GeV/c2 . • H0 → ZZ * → e+ e– e+ e– , e+ e– µ + µ –; MH = 130, 150 GeV/c2 . • Top events, where the top quarks decayed to electrons. In order to understand and minimise the background to the electromagnetic-cluster trigger, events containing high-pT jets were simulated using PYTHIA. Jet events were generated in two p T ranges, p T > 35 GeV/c and p T > 15 GeV/c, in order to study backgrounds to the single-cluster and cluster-pair triggers respectively (which should be efficient for electrons of 40 GeV/c and 20 GeV/c pT). Large data samples were needed: in order to meet the maximum trigger rate requirements the trigger algorithms must have a jet rejection of the order of 100, which requires samples of the order of 10 4 events for the rejection factor to be estimated with an accuracy that will not be dominated by Monte-Carlo statistics. However, since level-2 trigger studies require as input events which have been accepted by the level-1 trigger, and must achieve a similar background rejection, this leads to the requirement for data samples of the order of 10 6 events. Since detector simulation is very time consuming, an additional filter was used to eliminate events which could not possibly pass the trigger before detector simulation was performed. The particle momenta (electrons, photons and hadrons) within a window of 0.2 × 0.2 in η–φ space were summed, and only events with a cluster of pT > 35 (15) GeV/c were passed to the simulation. The window, which is larger than any e.m. cluster used by the trigger, was allowed to slide by half a window dimension in each direction, ensuring complete coverage of the trigger acceptance. Control samples were simulated without this filter, and it introduced no significant bias in the simulated data. - 8-
2.2.2 Jet trigger Since jet production will certainly be the dominant high-p T process, the jet trigger is essentially background-free. For a given physics threshold, the trigger rate is then determined by the sharpness of the trigger threshold. This in turn is determined primarily by two parameters: the size of the jet cone, and the calibration of the calorimeters. Optimisation of the trigger algorithm then requires only samples of jets at known pT, with minimum-bias events superimposed, to study the effect of pile-up on the choice of calibration and cone size. Once the threshold behaviour is known, the trigger rate can be estimated from a QCD Monte Carlo without the need for detector simulation or even jet fragmentation. 2.2.3 Missing-ET trigger Optimisation of the missing-E T trigger consists of two tasks: maximising the resolution for events containing weakly-interacting particles, and minimising the tails of the missing-ET distribution in events which do not contain weakly-interacting particles. Clearly there is a large overlap between the two processes. In order to study the resolution achievable for events containing weakly-interacting particles, the following processes were simulated: • SUSY events. • H0 → l+ l–ν ν • A → τ+ τ– The first two processes are primarily of interest in high-luminosity running, and contain large missing E T . In contrast, the third process is one which we could hope to study at low luminosity, and contains only moderate missing ET. There are two classes of background to the missing-ET trigger: • Tails in the missing-ET measurement in jet events, including energy undetected due to gaps in the detector. • Non-physics backgrounds, such as beam halo and cosmic rays. In the jet event background, there are contributions from the algorithm (the granularity at which ET measurements are converted to E x , E y ), and from the detector (calibration, rapidity coverage, reduced response across barrel-endcap and endcap–forward transitions). Thus, in addition to general jet event samples, samples were generated with jets entering the transition regions in order to gain a better understanding of this source of background. For the non-physics backgrounds, no Monte-Carlo studies have yet been performed, but some calculations of the order of magnitude of these backgrounds have been made. 2.2.4 Detector simulation Two levels of detector simulation were used. For many studies, simple models based upon parametrisations of detector response were used. Monte-Carlo 4-vectors were smeared with the expected resolutions of the calorimeters, namely ∆E/E = 10%/√E for electromagnetic particles and ∆E/E = 50%/√E for hadrons. Longitudinal sharing of hadronic showers between e.m. and hadronic calorimeters was also parametrised. Electronic effects and event pile-up were also simulated. Such simulations were used particularly for some of the preliminary studies of general aspects of the trigger, where the speed of the simulation offsets the lack of several realistic features. While many qualitative aspects of trigger performance can be adequately studied using Monte-Carlo 4-vectors alone, factors such as finite shower width and the effect of the material distribution in front of and within the calorimeter system have a significant impact - 9-
on the performance of the calorimeter trigger, and must thus be included in detailed studies. Accordingly, most of the studies performed for the ATLAS Technical Proposal used a GEANT-based simulation of the ATLAS detector. The detector geometry description was provided by the standard ATLAS package, DICE. This includes a full description of the ATLAS detector, both active and passive material, and also fills GEANT ‘HITS’ and ‘DIGI’ banks, which contain the energy deposited in the calorimeters and provide the input to the trigger simulations. Level-1 trigger simulation is part of the ATLAS reconstruction package, ATRECON. The calorimeter reconstruction modules of ATRECON fill cell energy matrices from the digitisations provided by DICE, adding electronic noise in the process. ‘Trigger cells’, sums over groups of calorimeter cells, are formed from these matrices, in the same way that the inputs to the trigger processor will be formed by summing over groups of calorimeter cells. The energies in the trigger cells are converted to E T, and electronic effects specific to the trigger system are added, such as channel-to-channel gain variations and trigger ADC pedestal fluctuations. The E T sums are digitised with variable resolution and these values form the input to the trigger algorithms, described below. The level-1 calorimeter trigger code in ATRECON simulates the operation of the e.m. cluster, jet and missing-E T algorithms, producing trigger hits which are input to a simulation of the global level-1 trigger. RoIs required by the level-2 trigger are also formed from clusters (e.m. and jet) passing the trigger thresholds, and these data are available for level-2 trigger simulations. 2.3 Electromagnetic-cluster trigger algorithm 2.3.1 Input data It is the task of the level-1 trigger to process data from every bunch crossing, and deliver a decision with a latency, including cable delays, of approximately 2 µs. The fact that a new event must be accepted every 25 ns imposes constraints upon the volume of data that can be used for each event; it would be impractical to attempt to read and process the full granularity and dynamic range of the calorimeter data for each bunch crossing. The data volume transmitted to the calorimeter trigger processor is therefore reduced in two ways: • The calorimeter cells are grouped into ‘trigger cells’ of reduced granularity. The summation is performed both in the transverse direction and in depth. Typical granularities for the trigger cells are ∆η × ∆φ = 0.1 × 0.1, with two depth samplings corresponding to the e.m. and hadronic sections of the calorimetry. The optimum choice of granularity is a compromise between trigger performance, algorithm complexity, and the number of input channels and consequent complexity of data fan-out within the trigger processors. This is discussed further below. • The trigger-cell energies are converted to E T before transmission to the trigger processors. This greatly reduces the bandwidth required in the forward sections of the calorimetry, as well as making the bandwidth requirements uniform in rapidity. Summing energy over the area of a trigger cell also sums the electronic and pile-up noise within that area. Since this can degrade the performance of some parts of the trigger algorithms, a threshold is applied to the trigger cell ET before input to the processors. The optimum value of this threshold and the conditions which determine it are described below. 2.3.2 Cluster algorithm The signature of an electron or photon in the calorimeters is a narrow deposit of energy which is wholly contained within the electromagnetic section of the calorimeter. The trigger is therefore based upon the E T in a small cluster of cells in the e.m. calorimeter. Ideally, this cluster should fully contain an e.m. shower while being small compared with a jet core. There - 10 -
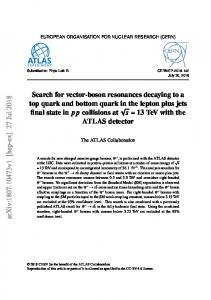
are two figures of merit to consider when choosing a cluster algorithm, namely the sharpness of the trigger threshold, and the trigger rate for a threshold which efficiently meets the physics requirements of the trigger. The sharpness is determined by the resolution of the calorimeter, the efficiency of containment of e.m. showers within the cluster, and by pile-up and electronic noise within the cluster area. Rate is primarily determined by the area of the cluster. The optimum cluster definition clearly depends on the granularity of the input data, but for the granularities appropriate for the level-1 trigger only simple cluster algorithms are required. Three possibilities are: • The ET in any single e.m. trigger cell. • The sum of ET in any pair of e.m. trigger cells, adjacent in either azimuth or rapidity (i.e. ‘sliding pairs’). • The sum of ET in any possible 2 × 2-cell cluster (i.e. ‘sliding windows’). Choosing the second algorithm, the dependence of trigger rate upon granularity for a 40 GeV threshold (matching the physics requirements for the trigger) is shown in figure 2.1. As can be seen, the rate varies linearly with granularity, i.e. as the square root of the area of the cluster. On the other hand, the number of trigger cells increases quadratically with decreasing cell dimension. A granularity of ∆η × ∆φ = 0.1 × 0.1 requires about 8000 trigger cells (e.m. plus hadronic) to cover |η| < 3, which seems a reasonable compromise between cost, system size, and performance. Number of em trigger channels for rapidity < 3 100 Rate (kHz)
0
4000
8000
12000
•
50
• 0
0.2
•
0.1
0.06 Granularity
Figure 2.1: Trigger rate at L = 10 34cm –2s –1 vs. cell size (∆η ≈ ∆φ) and vs. number of e.m. trigger cells. Rates are estimated for the trigger algorithm described in the text and without isolation. Figure 2.2 shows the efficiency as a function of threshold for the three cluster definitions listed above for this trigger cell granularity. The input data were simulated 40 GeV electrons at |η| ≈ 0. The single-cell algorithm produces a significantly softer trigger threshold than the two-cell or four-cell clusters, due to shower leakage when the electrons were incident near to the edges of the trigger cells. For this granularity the two-cell algorithm is almost as sharp as the four-cell algorithm, which should fully contain all e.m. showers. As figure 2.1 shows, however, the smaller area of the two-cell cluster results in approximately half the trigger rate of the larger four-cell cluster, and for this reason it is our preferred cluster algorithm. (Note that in the forward regions the single-cell algorithm works very badly, whereas the two-cell algorithm is still reasonable.) The choice of trigger ADC resolution is a compromise between precision of ET measurement and input bandwidth to the trigger processor. It may have an impact on the performance of the trigger in three areas: - 11 -
• Sharpness of trigger thresholds. • Jet rejection power of isolation vetoes. • Performance of digital bunch-crossing identification algorithms. In general all of these benefit from finer resolution. However, beyond a point the quantisation noise ceases to be the limiting factor in performance, and this sets a natural scale for the ADC resolution. In the case of the threshold sharpness, the ideal resolution of the electromagnetic calorimeter for 20 GeV electrons (the lowest threshold which has an impact on the trigger rate) would be about 0.5 GeV (assuming ∆E/E = 10%/√E). In addition, the electronic noise in an e.m. trigger cell at rapidity ≈ 0 will be in the range 300–400 MeV. Combining these two factors implies that there will be little gain in performance from a resolution much finer than 1 GeV/count, and no gain from finer than 0.5 GeV/count. In practice, when one includes the effect of the small fraction of showers sharing energy between more than two trigger cells there is actually very little to gain from digitising more finely than 1 GeV/count.
Figure 2.2: Trigger threshold sharpness for the three different cluster definitions. For isolation performance, the demands of efficiency require that the threshold on the minimum trigger-cell ET to be included in the processing be set at 2–3 times the rms noise level. With the expected levels of electronic noise in the electromagnetic calorimeters this means that signals of less than 1 GeV cannot be used for isolation purposes. Little improvement in isolation performance is found from using finer digitisation. Hence it is found that a digitisation resolution of 1 GeV/count is adequate for the performance of the trigger algorithms. Bunch-crossing identification algorithms based upon digital signal processing may benefit from a finer digitisation, since a reduction in noise would permit the timing extraction to be performed accurately to lower pulse heights. Even in this case, however, it seems unlikely that a resolution of better than 0.5 GeV/count would help much, as the electronic noise would then prove to be the limiting factor. This requires further study. 2.3.3 Isolation algorithm The two-cell sliding-pair cluster algorithm, with a cell granularity of 0.1 × 0.1, provides a good compromise between cost and performance. As figure 2.1 shows, however, the trigger - 12 -
rates obtained for thresholds matching the physics requirements (40 GeV E T for a single cluster) exceed the acceptance of the level-2 trigger by a large factor. Thus the required jet rejection cannot be obtained from a two-dimensional cluster algorithm alone. Since in most of the physics processes of interest the electrons or photons are not part of a jet, we propose to use an isolation requirement to provide the required extra rejection. For flexibility, isolation requirements in both the e.m. and hadronic calorimeters are foreseen. The isolation algorithm that has been chosen is illustrated in figure 2.3. It is based upon a 4 × 4 cell sliding window within the calorimeter. The isolation veto is based upon two ET sums, in the outer ring of 12 electromagnetic cells and in all 16 hadronic cells, both being below separate thresholds. The four e.m. cells in the centre of the isolation ring (2.2, 2.3, 3.2, 3.3) are used for cluster-finding. In the preferred algorithm, all four possible two-cell clusters are formed. The trigger condition is then any one of the four clusters passing the cluster threshold, plus the isolation requirement.
EM CALORIMETER 4.1
4.2
4.3
4.4
3.1
3.2
3.3
3.4
2.1
2.2 2.2
2.3
2.4
1.1
1.2
1.3
1.4
HADRON CALORIMETER
OUTER SUM 2.2
REFERENCE CELL VERTICAL SUMS HORIZONTAL SUMS
Figure 2.3: View of the 4 × 4 area of the calorimeter. In an earlier version of the algorithm, used in studies for the ATLAS Letter of Intent, only two (2.2 + 2.3; 2.2 + 3.2) of the four possible clusters were formed, one in the η direction and one in φ. The advantage of the current version is that it improves the performance of electromagnetic isolation. The reason is that while the two-cell cluster, with cells large compared with the size of an electromagnetic shower, is sufficient to fully contain most showers, there will be leakage outside the cluster when an electron or photon is incident near to the corner of a trigger cell such that the shower is shared between four cells. In the earlier version of the algorithm, this leakage could enter the isolation ring, depending on which corner of the cell the shower was near. This had the following adverse consequences: • In order to maintain high efficiency (95% – 98% per shower) the isolation threshold had to be raised, reducing the effectiveness as a jet veto. • While a high average efficiency could be achieved, the efficiency across the calorimeter was not uniform, with regions of reduced efficiency near the corners of trigger cells. • Since the fraction of shower energy leaking remains constant with increasing ET, the electromagnetic isolation threshold had to be raised gradually with electron/photon pT to maintain efficiency. Since leakage is only one contribution to the isolation sum for signal events, with noise and pile-up contributions being comparable, an isolation requirement based upon the ratio of isolation to cluster E T also failed to give a pT-independent optimisation of threshold. • The asymmetric nature of the earlier algorithm could give different efficiencies for electrons than positrons accompanied by a bremsstrahlung photon, due to the magnetic field. - 13 -
The current version of the algorithm avoids these problems as follows: since the trigger windows slide and overlap, any pair of cells form a cluster candidate in two neighbouring isolation windows. If a shower is not fully contained within a pair of cells, the leakage, which will be to one side of the cluster, will only enter the isolation ring in one of the two windows, and so there is always one window in which there is no leakage into the isolation ring. This greatly reduces the effect of leakage on electromagnetic isolation, and results both in greater jet rejection (up to 50% improvement in the stand-alone performance of electromagnetic isolation), and also in a more uniform efficiency across the calorimeter. In deciding on the optimum isolation requirement, four algorithms were considered: • A threshold applied to the ET sum in the electromagnetic isolation ring alone. • A threshold applied to the ET sum in the hadronic window alone. • The AND of the above two requirements. • A threshold applied to the sum of the electromagnetic and hadronic isolation ETs. Isolation test
e.m. alone
hadronic alone
e.m. AND hadronic
e.m. + hadronic
Rejection at 20 GeV
2.5
1.7
3.0
2.7
Rejection at 40 GeV
6.0
3.1
7.8
7.0
Table 2.2: Rejection factors from isolation for events passing cluster thresholds of 20 GeV and 40 GeV. Isolation thresholds were chosen to give 95% efficiency for electrons. Table 2.2 shows the jet event rejection for these four isolation tests, for cluster ET thresholds of 20 GeV and 40 GeV respectively. These rejection factors are in addition to those obtained from the cluster threshold alone. From these results we conclude: • The effectiveness of isolation increases with cluster ET threshold. This is not unexpected, as the isolation threshold is a smaller fraction of jet ET threshold. • The combination of electromagnetic and hadronic isolation, either through separate thresholds or a single threshold on the sum of the two, provides better jet rejection than either separately. • Applying separate thresholds to e.m. and hadronic isolation provides slightly better performance than a single threshold applied to the sum. More importantly, it provides an extra degree of flexibility in adjusting the relative weights of the two components with changes in threshold, luminosity or noise problems in one of the detectors. For this reason, our preferred isolation test is to apply separate thresholds to the e.m. and hadronic isolation sums, with the trigger requirement being the AND of the two conditions. Clearly, one or both conditions can be ‘disabled’ by setting an arbitrarily high threshold. Noise (electronic and pile-up) in the trigger is suppressed by applying a threshold to each individual trigger-cell E T before input to the trigger processor. The optimisation of this threshold has an important effect on the performance of the isolation veto. If this threshold is set too low, the isolation sums become noisy and the isolation thresholds must be raised to maintain efficiency, thus losing jet rejection power. If instead the threshold is set too high, the isolation sums lose sensitivity to low-pT jet fragments, again reducing the effectiveness of isolation. Table 2.3 shows the jet rejection factor achievable with isolation as a function of the cell-E T noise threshold. As can be seen, the best performance is achieved for a noise threshold of approximately 1 GeV. - 14 -
Cell threshold (GeV)
0.5
1.0
1.5
2.0
Jet Rejection
20
16
14
5.6
Table 2.3: Jet rejection from isolation for different cell-E T thresholds. A cluster threshold of 35 GeV was used, and the isolation criteria were required to be 95% efficient for 40 GeV electrons. Since the e.m. calorimeter is exposed to greater levels of pile-up noise and has more electronic noise than the hadronic calorimeters, it is sensible to allow cell thresholds to be varied independently for the two devices. No performance advantage is found, however, in reducing the hadronic cell threshold below 1 GeV. 2.3.4 Cluster counting and region-of-interest generation The cluster and isolation algorithms described above are based upon a 4 × 4-cell sliding window in the calorimeter. Since the windows overlap, a shower in one trigger cell may pass the trigger conditions in up to four windows, and so a single shower results in a ‘cluster’ of trigger hits. This could lead to multiple-counting. Some additional logic or condition is therefore needed to ‘de-cluster’ these overlapping triggers. There are two distinct problems to be resolved: • Counting the number of distinct triggers in an event. • Uniquely identifying the location of showers passing the trigger conditions. The former task is required to allow global trigger decisions based upon cluster multiplicity. The latter is needed by the level-2 trigger, which bases its decision on information from regions of the detector identified by the level-1 trigger as potentially containing interesting objects, known as ‘regions of interest’ or ‘RoIs’. While there is considerable overlap between the two problems, there are also specific requirements which differ. The two will therefore be considered separately. Because the volume of data which must be transferred to the level-2 processors depends on the precision with which an electron/photon candidate’s position can be specified, it is desirable to make as accurate an estimate as possible of this quantity. The RoI coordinate generation must therefore be performed using the full granularity of the trigger-cell input data. In order to avoid large transfers of data within the trigger system, it is desirable that this task should be performed ‘locally’, i.e. within the cluster-finding logic. This leads to the following constraints on the algorithm: • The algorithm must be ‘local’, in the sense that all of the information required for its execution can be found in the cluster-finding input data. • The algorithm must be such that the same RoI cannot be generated by more than one trigger cell. One such ‘local’ algorithm is the following: require that, in addition to being part of a cluster passing the trigger conditions, an RoI candidate trigger cell must also contain more ET than its neighbours. To resolve the rare cases where a shower is equally shared (within the trigger resolution) between two cells, this condition can be modified to require that the cell ET be greater than the neighbours on two sides and greater than or equal to the neighbours on the opposite sides. Clearly no two neighbouring cells can both pass such a condition. There is then no ambiguity of RoI coordinate, and the most energetic cell in the cluster provides a good and reliable measure of the shower’s position in the calorimeter. It is therefore proposed to use this algorithm to generate RoI coordinates for electron/photon candidates. - 15 -
The same ‘local’ algorithm may also be used to resolve the cluster-counting problem: if the trigger requirement is modified to become the AND of the cluster and isolation requirements plus the RoI condition, then there will be no multiple-counting of triggers. The drawback of this solution is that it does not permit the most efficient allocation of input data to processing units, resulting in an increased data fan-out within the trigger system. Our cluster-trigger processing units are application-specific integrated circuits (ASICs). The smallest processing unit that can execute the preferred trigger algorithm is one dealing with a single window of 4 × 4 trigger-cells (figure 2.3). However, due to the overlapping nature of the windows, a large number of interconnections between ASICs can be avoided if the cluster ASICs process n × n such overlapping windows, requiring input from (n+3) × (n+3) pairs of trigger cells (e.m. plus hadronic). The ASIC processes n × n isolation regions and all of the cluster pairs contained within them. The overlap of the different trigger windows means that any electromagnetic cell is combined with its neighbours on all four sides to form clusters, and each of those clusters is combined with two isolation windows. However, for many cells some of these different cluster and isolation combinations will be formed in different ASICs. If one wishes to allow only a single ASIC to form triggers with a given cell as the RoI, then all of the cluster pairs containing that cell, together with all of their corresponding isolation regions, must be formed within a single ASIC. To form all of these sums for a single trigger cell requires data from 5 × 5 cells, sufficient to form the four isolation windows within which this cell can contribute to clusters. Therefore an ASIC processing n × n trigger cells requires input from (n+4) × (n+4) pairs of cells, as opposed to (n+3) × (n+3) for the most compact arrangement. This then requires a significant increase in the complexity of the signal fan-out within the trigger processing logic. The above problem only arises when isolation is required. In fact, it is not foreseen that isolation will be required for RoI generation. In that case, then only (n+2) × (n+2) cells are needed to de-cluster n × n possible RoIs, and it is possible to use the more compact ASICs with simpler fan-out. Since the density of the signal fan-out within the cluster-processing crates is one of the main technical issues to be demonstrated, this solution, which minimises the fan-out, is to be preferred. Note that in our proposed design, the ASICs each handle 4 × 4 windows. This does, however, require an alternative solution to cluster counting. If this is not based upon ‘local’ de-clustering within the ASICs, then the alternative is to gather trigger results from all ASICs together and perform a ‘global’ de-clustering. Such global de-clustering cannot be performed at the trigger cell granularity, since the volume of data required would be unmanageable (approximately 50% of the total input data rate to the trigger processors). Instead a coarser granularity must be used to reduce the data volume to be transferred to the global de-clustering logic to a manageable level. However, this may cause a loss of efficiency for multiplicity-based triggers, because distinct clusters separated by less than twice the granularity used for de-clustering will be counted as a single object. The effect of this has been studied, and is shown in table 2.4 for a few key physics processes. It can be seen that a granularity of 0.4 × 0.4 may be used for cluster counting with only minimal impact on the efficiency of the cluster pair trigger, and when the single-cluster triggers are included as well there is no loss in overall efficiency. From these simulations, and from kinematical considerations, we consider that counting triggers with the granularity of the cluster ASICs (0.4 × 0.4) provides acceptable trigger efficiency with a lower overhead than the local de-clustering scheme. For global cluster-counting a different algorithm is required. Instead of comparing cluster ETs at the trigger cell granularity, the algorithm instead operates on a bitmap of yes/no flags for each 4 × 4 region of the calorimeter and for each threshold combination. A hit is accepted if there is no hit in the neighbouring ‘veto’ region shown in figure 2.4. This algorithm has the - 16 -
advantage of requiring less data to operate, which is important for global de-clustering. Since RoI coordinates are generated locally, this loss of precision in the location of triggers is not important. Process
0.1 × 0.1
0.4 × 0.4
0.8 × 0.8
H0 → γ γ
0.979 ± 0.008
0.969 ± 0.010
0.928 ± 0.015
H0 → e+ e – e+ e–
0.987 ± 0.006
0.957 ± 0.010
0.839 ± 0.019
t t → e+ e– jets
0.938 ± 0.013
0.903 ± 0.016
0.824 ± 0.021
Table 2.4: Efficiency of two-cluster trigger as a function of de-clustering granularity. All events contained two electrons or photons with pT > 20 GeV/c within |η| < 2.5.
R
Figure 2.4: Global cluster-counting algorithm. A hit in the ASIC R is counted provided there are no hits in the shaded ASICs. 2.4 Jet trigger algorithm Jet production will be the dominant high-pT process at the LHC. Consequently, unlike the electron/photon trigger, jet triggers will be largely background-free. Optimisation of the jet trigger algorithm is primarily a matter of maximising the sharpness of the threshold curve, since it is this which, for a given physics requirement, will determine the trigger rate. The jet trigger is based upon the ET sum in a square window in the electromagnetic and hadronic calorimeters. The window size must be at least as large as the core of the jet. For maximum uniformity of trigger efficiency the windows should overlap. The parameters which might affect the sharpness of the trigger threshold are: • The relative calibration of the electromagnetic and hadronic calorimeters. • The size of the jet trigger window. • The degree of overlap between adjacent jet clusters. • The trigger-cell ET threshold. The coarse granularity, particularly in depth, of the trigger input data prevents very complex calibration adjustments being made to optimise jet resolution. Nevertheless, a significant improvement in trigger sharpness may be obtained by suitable adjustment of the relative weighting of ET in the e.m. and hadronic calorimeters. Since the e/π response ratio of the e.m. calorimeter will be approximately 1.3, and jets are a mixture of e.m. and hadronic energy, the optimum calibration will be to weight the e.m. calorimeter ET more than would be required for accurate e.m. E T measurement but less than would be needed for optimal hadronic measurement. This has no effect on the e.m. cluster measurement, since the effect is merely to change the number of counts/GeV, easily corrected for by an adjustment in threshold. The separate thresholds on e.m. and hadronic isolation sums mean that the performance of the - 17 -
isolation veto in the electron/photon trigger is also largely independent of the relative calibration of the two measurements. This calibration should be performed for jets, and cannot be separated from the adjustment of the trigger cell threshold. Since however the purpose of the trigger cell threshold, to suppress noise and pile-up, is important for both electron/photon and jet triggers, the optimum value of this is very similar for both triggers. Its value is therefore taken to give optimum electron/photon trigger performance, as this will be the dominant contribution to the trigger rate. The size of the jet window is the main parameter of the algorithm. This is a pure optimisation question: if the window is too small, it does not contain the jet ET fully, resulting in a loss of resolution. If too large, the summation of noise and pile-up over the larger area also leads to a degradation of resolution. As a consequence, the optimum jet window size for low luminosity operation may be larger than the optimum for design luminosity. However, since the window size will probably have to be fixed, the optimisation should be performed for high luminosity, where the rate reduction problem is greatest. At present jet windows of 0.6 × 0.6 and 0.8 × 0.8 are being studied with different levels of minimum-bias pile-up in order to determine the optimum window size. The remaining parameter is the step size by which the jet windows slide. Its optimum value will depend on granularity. A small jet window, barely containing the jet core, should be moved in small steps so that one window should achieve maximum containment. For a larger jet window, easily able to contain an entire jet, sliding the window in such small steps is inefficient, as it requires many more jet sums to be formed and complicates de-clustering, while giving no tangible performance benefit. An additional constraint comes from the requirement that the algorithm maps onto the calorimeter granularity. Since the number of calorimeter cells in φ is a power of two (64), the jet windows should slide by an even number of trigger cells (e.g. sliding the jet window by 0.3 in φ will result in problems with the wraparound). Thus we see that for the algorithms considered, there are natural step sizes for the sliding, with the larger (0.8 × 0.8) jet window sliding by 0.4 in η and ϕ (i.e. by half the window dimension), and the smaller (0.6 × 0.6) jet window sliding by 0.2 (i.e. by one-third of the window dimension). The natural implementation of such an algorithm is to sum groups of trigger cells in η, ϕ and depth to form ‘jet cells’ whose granularity equals the step size. The jet trigger algorithm then reduces to a simple sum over 2 × 2 or 3 × 3 ‘jet cells’. In the system described below, the larger jet window of 0.8 × 0.8 is assumed, though the design could be adapted to a smaller jet window if simulation studies demonstrate a performance advantage. As with the electron/photon trigger, the jet clusters overlap, and so in general a high-pT jet will generate triggers in several overlapping jet windows. Therefore, an algorithm is again required to resolve the multiple counting of jet triggers. Since jets also generate regions of interest, the RoI coordinate must also be determined, and ideally the same algorithm should perform both functions. In the system described here, jet trigger hits are generated for each 2 × 2 jet window above threshold. These hits are associated with the bottom-left ‘jet cell’ of the window (an arbitrary choice), and are then passed to de-clustering logic identical to that used for the electron trigger counting. There the jet trigger hits at each threshold are counted. Note that the granularity of a jet cell, 0.4 × 0.4, is the same as is used for the electron/photon counting, so that the jet-counting and electron-counting logic are truly identical. Since the jet cell granularity is also the finest granularity contributing to the jet trigger, this is also an appropriate granularity for the RoI coordinate determination (unlike the case for the electron/photon trigger). The ‘veto matrix’ algorithm used for counting jet triggers does in fact identify the spatial coordinate of the jet window generating the trigger (i.e. of the jet cell passing the veto), and so this information can be saved and used as a jet RoI coordinate. - 18 -
Some other possibilities for jet de-clustering have been suggested, and are under study. It is too early to say whether any of these offer real performance benefits over the simple algorithm described above. 2.5 Missing-ET trigger algorithm The principle of the missing-ET trigger is simple. All input data (E T) are resolved into Ex and Ey components, and these components summed to form global Ex and Ey for the event. The quadratic sum of these gives the missing E T. This missing-ET measurement forms an input to the level-1 trigger decision, and the value, plus the E x and E y components, are made available to the level-2 trigger. Since the level-1 missing-E T measurement is based purely upon calorimeter measurements, this can be refined at level-2 by combining the calorimeter Ex and Ey values (from level-1) with muon momenta. Whether further refinement is possible at level-2 is under study, but is made difficult by the fact that missing E T is a global quantity, i.e. its region of interest is the entire calorimeter. However, some background might be rejected by jet validation. In the optimisation of the missing-ET trigger, the following factors need to be considered: • The optimum relative calibration of e.m. and hadronic calorimetry. • The pseudo-rapidity coverage of the calorimetry. • The granularity at which E T is resolved into E x and E y . • The treatment of transition regions between different calorimeter systems. • The rejection of non-physics backgrounds, such as beam halo and cosmic rays. Since jets are the dominant high-pT process, to a first approximation the optimum calibration will be the same as for the jet trigger. This will tend to over-weight large electromagnetic ET deposits, but events containing such showers are likely to be triggered on anyway. One possible correction would be to adjust the calibration of energetic e.m. trigger cells with little or no ET in the corresponding hadronic cell, but this would be expensive in on-chip memory look-up tables (LUTs) and as yet has not been studied. Similarly, events containing high-pT muons will also tend to have mis-measured missing ET, though this can be corrected for in the level-2 trigger. The missing-E T spectrum from jet events as a function of pseudo-rapidity coverage has been studied within ATLAS. Too small a coverage results in a mis-measurement of the missing ET due to jets falling outside the acceptance of the calorimetry. For the resolution not to be degraded, calorimeter coverage out to pseudo-rapidity of 4.5 – 5.0 is required. It is therefore foreseen that the whole of the ATLAS forward calorimeter (|η| < 5.0) shall be included in the missing-E T trigger. There is however no requirement to include this information in the other calorimeter triggers. The effect of the granularity used for the E T → E x , Ey conversion can also be studied using simple detector models. The missing-ET spectra from jet events, with a minimum pT of the initial hard scatter of 100 GeV/c, are shown in figure 2.5 for different choices of φ granularity (the granularity in η does not affect the missing-ET resolution). As can be seen, there is little degradation in resolution for granularities up to 0.4. As long as performance is acceptable, use of a coarser granularity has lower overheads, since fewer LUTs are required for the conversion, and if the number is small it becomes practical to implement these in discrete memory components rather than within the cluster ASICs, where they require a large silicon area. Our preferred solution is therefore to use a granularity of 0.4 in φ, allowing a single ET sum to be output from each ASIC, with LUTs on the cluster-processing modules to perform the conversion. - 19 -
Figure 2.5: Missing-E T distribution observed in jet events with pT > 100 GeV/c for three choices of φ granularity: 0.1 × 0.1 (solid), 0.4 × 0.4 (dashed) and 0.8 × 0.8 (dotted). The effect of transition regions in the calorimetry on the missing-ET measurement is the largest irreducible contribution to the missing-ET trigger background. In these regions of the detector, the E T measurement is degraded by the extra material in front of the active detectors (cryostat end walls, services and mechanical supports) and by the difficulty of combining signals from the different calorimeters. Adjustments to the calibrations of the trigger readout in these regions can partially offset the effect on average, but the resolution will still be degraded, leading to an irreducible background. The magnitude of this background, after such corrections have been made, is currently under investigation. It is possible that some reduction in this background may be achievable at level-2, if jets falling into these regions are flagged as RoIs, enabling this part of the detector information to be reprocessed. This possibility has not yet been studied. Finally, there are non-physics backgrounds from beam–wall, beam halo and cosmic ray events. The effects of these are difficult to quantify: some calculations have been made of the total beam halo and cosmic ray rates, but without detailed simulation it is difficult to estimate the missing-E T trigger rate due to these sources. Also, the short beam-crossing interval of the LHC and the relatively slow signals from the calorimeters mean that timing cannot be used to reduce these backgrounds, as is done in HERA experiments. There are, however, a number of strategies which could be used to reduce the rates from these sources, and these will be studied as soon as effort permits. The main defence against non-physics backgrounds is to combine missing E T with other triggers, e.g. jets, or low-pT leptons or photons. This is a reasonable trigger strategy in itself, since missing E T is only a part of any physics signature (which will always include one or more of the other signatures). The combination will also be less sensitive to some possible background sources, such as coherent noise and possibly beam halo (where the ET from the muon may be spread across a band in the detector, and thus may lie below the relevant jet thresholds). The inclusion of missing E T in the trigger selection would permit a lower threshold on the other trigger signals, increasing physics acceptance or reducing rates. At higher thresholds an inclusive missing-ET trigger could also be included, but it is doubtful that this would have more physics acceptance than the triggers using missing E T in combination. 2.6 Expected trigger rates at design luminosity In estimating trigger rates, it is necessary to define cluster and isolation thresholds for all trigger selections. The physics requirements are that the trigger should be efficient for: - 20 -
• Single isolated electrons/photons with pT > 40 GeV/c. • Pairs of isolated electrons/photons, both with pT > 20 GeV/c. As has been noted above, isolation is required to fulfil the first requirement. The same is true of the cluster-pair trigger. In this case the requirement is that the pair trigger must be efficient, requiring higher efficiency for the individual clusters and leading to looser isolation cuts. However, since the trigger now requires more than one cluster passing the isolation criteria there is no loss of jet rejection from the looser isolation requirements. Since the isolation veto will introduce some inefficiency, which in the case of isolation in the e.m. calorimeter will increase with cluster E T, it is not reasonable to maintain a tight isolation requirement for cluster E Ts high enough that the cluster threshold alone reduces the trigger rate to a small fraction of the total. We assume therefore that the isolation requirement will be relaxed, and ultimately removed, with increasing cluster E T The estimated trigger rate then depends upon which scheme is used for relaxing isolation. The exact combination of cluster and isolation thresholds that will be used will depend upon experience gained in the early, low-luminosity period of LHC operation. In order to provide a concrete estimate of rates, and also to demonstrate that the proposed algorithms can provide the required rejection and efficiency, one possible scheme is constructed below. It is motivated by the requirements of physics efficiency, robustness against unexpected conditions, and the desire to produce a balanced suite of trigger selections, with no one selection dominating the trigger rate. Since it is the e.m. isolation veto which is most vulnerable to bremsstrahlung and pile-up, this requirement, although more powerful than hadronic isolation as a stand-alone veto, is relaxed first. In estimating trigger rates, the following trigger selections were used (the thresholds are the nominal ones, e.g. ≥ 35 GeV means 95% efficiency at 40 GeV): • Single cluster, ET ≥ 35 GeV, e.m. isolation < 5 GeV, hadronic isolation < 2 GeV. • Single cluster, ET ≥ 55 GeV, hadronic isolation < 2 GeV. • Single cluster, ET ≥ 75 GeV, no isolation requirement. • Pair of clusters, ET ≥ 16 GeV, e.m. isolation < 10 GeV, hadronic isolation < 2 GeV. • Pair of clusters, ET ≥ 30 GeV, hadronic isolation < 2 GeV. • Pair of clusters, ET ≥ 40 GeV, no isolation requirement. Note that the lowest E T thresholds, 35 GeV for single clusters and 16 GeV for pairs of clusters, are chosen to be efficient for electrons and photons with p T of 40 GeV/c and 20 GeV/c respectively (the single and pair pT requirements). The estimated trigger rates, for L = 1034 cm –2 s –1, are shown in table 2.5 for the individual selections and also for the complete suite of triggers. Note that due to overlap between some of the triggers the combined rate is less than the sum of the components. Errors are from Monte-Carlo statistics only. 2.7 Requirements for low-luminosity running The physics requirements for low luminosity operation of the calorimeter trigger system are mostly very similar to the high-luminosity requirements. This is not surprising, since most of the possible physics processes which will be investigated at the LHC at either low or high luminosity will be associated with mass scales greater than or equal to the Z 0 mass, and thus the lepton, jet and missing-ET thresholds required are essentially the same. However, in the early stages of LHC operations it would clearly be prudent to run with the lowest tolerable thresholds, at least until the data are understood. However, here we are concerned with what - 21 -
the minimum requirements on the trigger selections are. There are in fact two processes that could provide direct motivation for setting lower thresholds than those proposed above for high luminosity. Trigger Selection
Rate at L = 10 34 cm–2 s –1
Single cluster, ET ≥ 35 GeV e.m. and hadronic isolation
3.5 ± 0.4 kHz
Single cluster, ET ≥ 55 GeV hadronic isolation
1.4 ± 0.3 kHz
Single cluster, ET ≥ 75 GeV no isolation
1.8 ± 0.3 kHz
Pair of clusters, ET ≥ 16 GeV e.m. and hadronic isolation
2.4 ± 0.5 kHz
Pair of clusters, ET ≥ 30 GeV, hadronic isolation
0.9 ± 0.3 kHz
Pair of clusters, ET ≥ 40 GeV, no isolation
1.4 ± 0.4 kHz
Combination of above selections
8.4 ± 0.8 kHz
Table 2.5: Estimated electromagnetic cluster-trigger rates at LHC design luminosity. The first process is the possible pseudo-scalar Higgs decay A0 → τ+ τ– . Here the level-1 signature is the leptonic decay of one of the taus. While the A0 mass in this channel is assumed to be greater than 100 GeV/c 2 (for lower masses the most promising channel to search is A0 production in top decays, which presents no challenge to the trigger), the charged lepton produced in the tau decay is typically softer than the electrons or photons produced in other Higgs decays. A lepton pT threshold of 24 GeV/c is required in the physics studies of this process. Estimated rates at L = 1033 cm –2 s –1 are given in table 2.6 for this threshold for different isolation criteria. As can be seen, it is possible at low luminosity to achieve an acceptable trigger rate for such a threshold. Since most other single-cluster and cluster-pair triggers would be a subset of this selection, these numbers provide a rough estimate of the total e.m. cluster-trigger rate at low luminosity, should such a selection be implemented. Trigger Selection
Rate at L = 10 33 cm–2 s –1
Single cluster, ET ≥ 20 GeV no isolation
15 kHz
Single cluster, ET ≥ 20 GeV Isolation: e.m. < 5 GeV, hadronic < 2 GeV
4 kHz
Table 2.6: Estimated trigger rates for a low-luminosity A 0 → τ+ τ– calorimeter trigger. It should be noted that in an RoI-driven level-2 trigger, this channel also provides a motivation for a single (isolated) hadron selection in the level-1 trigger, in order to produce an RoI for the non-leptonic tau decay. This trigger could be used purely for RoI generation, or in combination with a low-threshold electron candidate in order to reduce the trigger rate. The feasibility and usefulness of such a trigger requires study before it could be included in the design. - 22 -
The other major difference at low luminosity is the high-statistics B-physics selection. This requires very low lepton-pT thresholds in order to maximise acceptance, and also a different mode of operation for level-2, in which RoIs are not used to determine which parts of the detector should be studied. Since the muon trigger is much cleaner than the electron trigger, the B-physics selection is based upon low-pT muons. There is however an indirect impact on the calorimeter trigger: because level-2 is processing these triggers without RoIs, the maximum level-2 input rate is reduced compared to that achievable when it is RoI-driven. Since the level-2 architecture is still being defined, it is not possible to say at the moment what the maximum sustainable rate for RoI-producing triggers will be when non-RoI-driven B-physics triggers are being processed. However from Table 2.6 it would appear to be desirable that the second-level trigger should be designed to accept a few tens of kHz of nonB triggers. As an aside, a low-threshold electron selection, while it might not be competitive with a muon trigger for B physics, may be desirable as a cross-check. Since electrons from B hadron decays are unlikely to be isolated, and the non-isolated rate would be totally unsustainable at any threshold which might be effective even for a cross-check on the B physics sample, it is not clear whether a useful B → electron selection will be possible.
3. Trigger system design 3.1 Introduction Based on the algorithms outlined above, system design studies have been carried out within the RD27 collaboration to develop a level-1 calorimeter trigger system for ATLAS to select events on the basis of high-pT electrons and photons, jets, or missing transverse energy. With a pseudo-rapidity coverage of |η| < 3 and a trigger cell size of ∆η × ∆φ = 0.1 × 0.1 in the electromagnetic and hadronic calorimeters, the system will be required to process a total of approximately 8000 trigger cells. Cells from the forward calorimeter will be used, but only for the missing-ET trigger. The calorimeter trigger cells will generate data at a total rate of 320 Gbyte/s, so it is evident that data transmission into the trigger processor system is a major issue influencing system architecture. Furthermore, the two-dimensional nature of the e.m. cluster-finding algorithm requires that each processing element be aware of its environment. Data must therefore be fanned-out between processing elements, further increasing the overall bandwidth demands and potentially producing serious interconnection problems. Initial studies of this I/O problem led to a solution based on asynchronous data transmission of zero-suppressed and bunch-crossing-tagged data on 160 Mbit/s serial links [5]. Although this approach appeared to be feasible, the need for de-randomising buffer memories inherent in such an asynchronous system introduced considerable additional latency, which was considered undesirable. Other concerns involved the potential for buffer overflow, and failure of the tag-matching mechanism. The attractions of a synchronous system were considered to be sufficiently great that further design studies were undertaken to achieve this goal. Building on earlier work in the context of RD27 [6] and exploiting the rapid advances in commercial high-speed optical datatransmission techniques, coupled with the extensive use of high-density micro-systems [7], have together resulted in the conceptual design of a fully-synchronous trigger system presented here. The proposed system architecture relies on three key techniques:
- 23 -
• Transmission of serialised data from the calorimeters to the processing crates via highspeed optical links. • Integration of high-density optical receivers with pre-processing dies on multi-chip modules (MCMs). • Transmission and fan-out of the resultant data to the processing ASICs in a parallel-serial format via transmission-line backplanes. The partitioning of the system evolved after careful consideration of issues of testability, maintainability, availability of existing sub-systems, and the availability of existing technologies. It was also considered important that the system be scalable to benefit in cost and performance from any future technological developments. Figure 3.1 shows a block diagram of the full calorimeter trigger processor system. Calorimeter Signals
Analogue Sum
or FERMI
ADC System
Jet Trigger Logic
Central TriggerLogic First-level Trigger Decision
Electron Trigger Logic
RoI Builder
Missing ET Logic
Host Processor
To Second Level Processor
Figure 3.1: Trigger system block diagram. 3.2 The front-end digitisation system The level-1 calorimeter trigger system will require calorimeter information with a granularity of 0.1 × 0.1 in η – φ space. Depending on the readout system adopted by ATLAS, the trigger ADC system could be derived from FERMI [7] or from an independent custom-built ADC system. In either case, it is envisaged that the digitisation system would be on the detector and the digitised information transmitted serially using high-speed optical fibres. The ADC clock will be derived from the precision central timing system for the detector, but its relative phase will be adjustable, thereby allowing the ADC sample to be positioned precisely at the peak of the analogue pulse. The ADC calibration in ET units will vary across the calorimeters as a function of η, so RAM look-up tables (LUTs) will be used to convert the raw ADC data to the correct E T values. The requirements of the front-end digitisation system may then be summarised as follows, for the non-FERMI option: • Sum individual analogue signals laterally and in depth to form trigger towers of 0.1 × 0.1 in η – φ space. - 24 -
• Digitise the analogue signals with eight-bit resolution at 40 MHz. • Perform pedestal subtraction, energy threshold, calibration, and conversion to ET using LUTs. • Carry out Bunch Crossing Identification (BCID) — see section 3.2.1 below. • Convert pairs of eight-bit trigger channels into serial bit-streams, using 16-bit parallel-to-serial converters running at an effective data rate of 640 Mbit/s. The number of optical links required will therefore be half the number of trigger channels. • Convert the electrical bit-streams to optical signals for transport off the detector. The front-end system will also include a source of digital data for trigger testing and setup, as described in section 6.1. Figure 3.2 shows a block diagram of the front-end digitisation system. It should be noted that if the BCID logic is fully digital, it may be possible to move it with the LUTs off the detector and into the trigger processing logic, which would be preferable for ease of access. 4000 × 2 channels of 0.1 × 0.1 trigger cells
FADC
FADC
LUT
LUT
BCID
BCID
16-bit parallel to serial converter Electrical to optical converter ADC System
4000 optical signals i.e. 2 trigger channels/link @ 640 Mbit/s to the calorimeter trigger system
Figure 3.2: Front-end system block diagram (non-FERMI). 3.2.1 Bunch-crossing identification for non-FERMI systems As the signals produced by the calorimeters are likely to span several bunch crossings, bunchcrossing identification (BCID) will be required for the level-1 calorimeter trigger. The role of BCID is to identify the data sample containing the peak of the calorimeter pulse, and to pass on data for this sample only. All other samples are suppressed to zero. Without BCID, energy deposits originating in a single bunch-crossing would enter the trigger algorithms for several successive crossings. The RD27 collaboration has been investigating digital BCID techniques [8]. Several algorithms have been evaluated offline, using data from the RD3 prototype liquid-argon accordion calorimeter running in a CERN test beam. These investigations showed that bunchcrossing identification could be performed using relatively simple algorithms which were
- 25 -
efficient for energy deposits down to a few GeV. In addition, an electronics module has already been tested and a full demonstrator programme is under way — see section 7.1. All the BCID algorithms tested consisted of a finite impulse response (FIR) filter, followed by a peak-finding operation, as shown in the block diagram in figure 3.3. One limitation of the BCID algorithms tested so far is their inability to identify correctly calorimeter pulses which saturate the ADCs. Possible solutions to this problem include the use of a separate digital algorithm for saturated pulses, or the use of an analogue BCID scheme for large pulses only. Data In
Pipeline Memory (PM)
FIR Filter
0
M U X
Data Out
PM
Peak Finder
Figure 3.3: BCID block diagram. 3.3 Electron/photon trigger logic The most complex part of the trigger processor is the electron/photon logic system, which will receive and process 4000 optical signals from the front-end digitisation system, each carrying data at an effective rate of 640 Mbit/s (800 MBaud including framing and protocol) from two trigger cells. In addition to finding e.m. clusters, it carries out the first steps of the jet and missing-ET triggers. The building blocks of this system are shown in figure 3.4. 4000 optical signals @ 640 Mbit/s from front-end system
Optical to electrical converter Serial to parallel converter 4 bits × 4 @ 160 Mbit/s serialiser Multi-chip module
Electron/Photon Trigger: Cluster processing
To jet trigger To missingET trigger
To RoI builder
Figure 3.4: Electron/photon trigger logic block diagram. - 26 -
3.3.1 Integrated-optics multi-chip module The optical fibres will be received in four-channel integrated-optics multi-chip modules (MCMs) which will generate the 160 Mbit/s electrical signals used in the trigger crates. Each MCM will include four types of un-packaged dies: • An integrated optical-to-electrical converter with a fibre pigtail. • A serial-to-parallel converter to translate the incoming serial bit-streams to 16-bit words (data from two trigger cells) every 25 ns. • A 4–bit × 4 serialising ASIC, which will transmit the 16-bit word on four serial links operating at 160 Mbit/s, as required by the cluster ASIC. • Diagnostic and readout memory.
Fibre Optical signal in
16 bits DPRAM
4 × 4 serialising ASIC
160 Mbit/s electrical signals
4 × 4 serialising ASIC
16 bits
Optical to Electrical Converter
640 Mbit/s Serial to Parallel Converter 640 Mbit/s Serial to Parallel Converter
DPRAM
16 bits
Optical signal in
4 × 4 serialising ASIC
DPRAM
4 × 4 serialising ASIC
16 bits
Fibre
640 Mbit/s Serial to Parallel Converter
Optical signal in
640 Mbit/s Serial to Parallel Converter
Fibre
Optical to Electrical Converter
Optical signal in
Optical to Electrical Converter
Fibre
Optical to Electrical Converter
.
Sufficient dies for four input fibres will be bonded and packaged as a single MCM, with the fibres entering through the side of the package as shown in figure 3.5. The MCM will thus handle data from eight trigger cells.
DPRAM
Slow controls Data[15:0]
Read-out memory
ROC
Figure 3.5: Integrated-optics MCM block diagram. 3.3.2 Optical-to-electrical converter An integrated optical-to-electrical converter will be developed, containing an embedded optical fibre, PIN diode, and an amplifier with logic thresholds suitable for interfacing to the 640 Mbit/s serial-to-parallel converter. This optical device will operate at up to 1 Gbit/s. - 27 -
The multi-mode fibre, typically 150 µm in diameter, will be located in a ‘V’-groove in the silicon substrate on which a PIN diode and an amplifier are mounted. The groove retains the fibre-end against a natural silicon crystal face inclined at 54.7˚. Light from the fibre is reflected from this face into the PIN diode mounted directly on the silicon. Four such assemblies, each measuring approximately 2.5 mm × 2.5 mm, will be bonded on to the main MCM, with the fibres entering the package via collars. Figure 3.6 shows two views of the optical assembly. Fibre pigtail with collar
PIN Diode
Amplifier
PIN Diode
Light Silicon
Silicon Side View
Front View
Figure 3.6: Integrated optical-to-electrical converter. 3.3.3 Serial-to-parallel converter The serial-to-parallel converter will receive an electrical bit stream from the embedded-fibre MCM at 800 Mbit/s (including the framing and coding bits from the serial protocol). The useful data rate is 640 Mbit/s, corresponding to a 16-bit word every 25 ns. The parallel-toserial and serial-to-parallel converters at the two ends of the transmission chain form a chipset using the same serial protocol. The first prototype MCMs will use a commercial chip set in bare die form to perform the parallel-to-serial and serial-to-parallel functions. A custom chip-set may subsequently be developed if this reduces the price or power dissipation 3.3.4 Serialising ASIC The serialising ASIC is required to overcome the I/O limitations of the cluster ASIC, which will be designed using standard 0.5 µm CMOS gate array and will therefore be unable to handle data rates beyond 160 Mbit/s per pin. Data rates in the trigger crates are also restricted by the decision to use an electrical transmission-line backplane for fan-out of signals to neighbouring modules. Data rates significantly higher than 160 Mbit/s would probably demand use of a more expensive optical technique. The serialising ASIC (figure 3.7) will convert the 16-bit data to four 160 Mbit/s bit-streams. It will be based on 0.7 µm CMOS technology, and its functions will be to: • Receive data from the serial-to-parallel converter at 40 MHz. • Provide programmable delays, in steps of 25 ns, to compensate for different fibre delays and different detector response times. • Record the incoming data in an 80-deep (2 µs) dual-port memory, to be read out following a level-1 trigger-accept decision and also used for testing, monitoring and diagnostics. • Serialise the 16-bit word onto four links at 160 Mbit/s, with four bits of serial data on each line every 25 ns. Hence for each trigger cell, two links will be required to transfer eight-bit data to the cluster ASIC within the 25 ns bunch-crossing period. • Provide a test facility using a playback scheme through the dual-port memory (DPRAM).
- 28 -
160 MHz
Prog. Delays
Latch
Parallel Data 16 Data[15:0]
4
Parallel to Serial
4
Parallel to Serial
4
Parallel to Serial
CDR CS Test Reset Rd Wr
Slow Controls & Registers
MUX
ADD[6:0]
4
Counter
Parallel to Serial
M U Wr ADD X 80 Deep Dual-Port FromRdother MCMs Memory ADD
Readout Memory 4 × 160 Mbit/s serial outputs
TriState
Strobe (40 MHz)
Figure 3.7: Serialising ASIC block diagram. 3.4 Cluster processing The cluster-processing logic will form the heart of the calorimeter trigger. It will receive data from the MCMs described above, and compute the e.m. cluster hit-pattern for de-clustering, energy sums for jet processing and missing-E T calculations, and RoI information. 3.4.1 E.M. cluster trigger algorithm The electron/photon cluster-trigger algorithm is described in detail in section 2.3. Referring to figure 2.3, all possible 4 × 4 trigger-cell areas of the e.m. and hadronic calorimeters are searched for adjacent inner pairs of e.m. cells exceeding an ET threshold. The optional isolation criterion looks at 12-cell outer rings in the e.m. calorimeter and 4 × 4-cell areas in the hadronic calorimeters to determine whether they exceed separate thresholds on their total E T. The logic will also compute the ET sum over the 4 × 4 area of the e.m. and hadronic calorimeters, for later use in the missing-ET and jet trigger logic. 3.4.2 Cluster ASIC The most complex part of the logic required for the trigger processor will be implemented in the cluster ASIC. Each ASIC will have the following features: • Receive digitised e.m. and hadronic information from the serialising ASIC, using two 160 Mbit/s serial links per trigger cell. • Synchronise and perform serial-to-parallel conversion of the input data. • Process 4 × 4 overlapping windows, each consisting of 4 × 4 trigger cells. This will require data from a 7 × 7 trigger-cell area of the e.m. and hadronic calorimeters. • Provide eight sets (cluster; e.m. isolation; hadronic isolation) of threshold values for the e.m. cluster trigger. • Number of trigger-cell input signals to the ASIC: [(4+3) × (4+3) × 2] × [2 links/cell] = 196 input signals at 160 Mbit/s. • Results output by the ASIC:
- 29 -
- Eight-bit hit pattern, one bit per threshold set giving an OR over the area covered by the ASIC, for global cluster counting. - Sixteen-bit region-of-interest, which is the 4 × 4 ‘RoI pixel array’ for one threshold value (without isolation) locally de-clustered. - 13-bit E T sum over a 4 × 4 trigger-cell area (e.m. + hadronic), for missing-ET calculations. - The 12 LSBs of the above sum serialised onto 3 links at 160 Mbit/s, to be sent on to the jet crate. • Memory to capture the results (37 bits × 80 deep). • Following a positive level-1 trigger decision (‘level-1 accept’ signal), the data corresponding to the appropriate bunch-crossing number will be transferred out from the dual-port RAMs. At least during commissioning, it will also be useful to read out several bunch crossings before and after the triggered one. • Logic will be included to test the ASIC. • The ASIC will use a 160 MHz clock for the 160 Mbit/s links, and the core logic will run at a 40 MHz rate. .
40 MHz 160 MHz 196 Bits @ 160 Mbit/s
Serial to Parallel Converter
Synchronising Logic
Cluster Processing Logic Thresholds
Test Logic
Serialise
The cluster ASIC will be implemented using 0.5 µm CMOS technology. A total of 256 such ASICs will be required to process the entire e.m. plus hadronic calorimeter (4000 each of e.m. and hadronic calorimeter trigger cells). Figure 3.8 is a block diagram of the cluster ASIC. 8-bit Hit 16-bit RoI 13-bit E T Sum 3 Serial Links to Jet Crate
DualPort RAM 29 × 80
Address Decoding Logic
BCID Level -1 Address Number Accept
Data
Figure 3.8: Cluster ASIC block diagram. 3.4.3 Cluster processor module The cluster processor module will fully process an 8 × 8 area of the e.m. and hadronic calorimeters. Each module (figure 3.9) will contain 16 MCMs receiving optical data on a total of 64 optical fibres, four cluster ASICs, four 8K × 4-byte LUTs to convert the energy to its Ex and Ey components, two adder ASICs for adding the energy sums, and other control and interface functions. The functionality and requirements of the cluster processor module are: • To process an 8 × 8 area of the e.m. and hadronic trigger cells using signals from [(8+3)(8+3)] × 2 × 2 = 484 links at 160 Mbit/s. The 16 MCMs on the module will
- 30 -
receive 64 optical signals and provide 256 of these links internally. The remaining 228 links will be received from neighbouring cluster processor modules via the backplane. • 156 of the 256 160-Mbit/s links from optic fibres must be fanned out to neighbouring modules. • Results: - The 8 × 4-bit hit-patterns will be transmitted by parallel cable links to the e.m. clustercounting crate. - The 4 × 12-bit E T sum (i.e. the 12 MSBs of the 13-bit sums) will be transmitted to the jet processor crate on 12 serial cable links at 160 Mbit/s. - The 16-bit signed (2’s complement) E x and Ey missing-energy values will be transmitted as parallel signals via crate backplanes to the two results modules per crate. - On receipt of a level-1 accept, the RoI data corresponding to the appropriate BCID number will be transmitted to the second-level trigger. With current connector technology, the physical size of the module will accommodate a 16 SU (400 mm) high connector, providing approximately 700 connections to the backplane (e.g. using four-row 2 mm Futurebus+ type connectors). A total of 64 cluster processor modules will be required for the complete trigger system (16 modules/crate × 4 crates).
To Neighbours (78 × 2)
BTL
64 Optical Signals @ 640 Mbit/s
16 MCMs
Hits Neighbours
4 Cluster ASICS
BTL
(114 × 2)
Energy
TTLECL TTLECL
E.M. Cluster-counting (4×8 bits) Jet Crate (4×3 Links @ 160 Mbit/s)
Level-1 Accept
Daisy Chain In
Controller
RoI bits to Level-2 BCID Number
LUT FIFO Buffer
Interface
ROC
2×16 bits Ex , Ey to Results Modules
.
Adder ASIC
Daisy Chain Out Board Address
(4×16 bits)
Ey
Ex Latch
Slow Controls (ASICs & board setup)
BTL
Figure 3.9: Cluster processor module block diagram. 3.4.4 Fan-in and fan-out To process an 8 × 8 area of the e.m. and hadronic calorimeters, the cluster processor module requires signals from 242 trigger cells [(8+3)(8+3) × 2]. Of the 242 trigger cells, data for 128 will arrive via the front panel of the cluster processor module on 64 optical links. Data for the - 31 -
remaining 114 trigger cells will arrive from neighbouring modules over the backplane. Similarly, of the data for 128 trigger cells arriving optically via the front panel, data from 78 trigger cells need to be fanned out to neighbouring modules. Sixty of these require a two-fold fan-out and 18 need four-fold fan-out. One of the two or four always stays on the same module. As each trigger cell requires two links operating at 160 Mbit/s to transfer the data to the cluster ASICs, the total fan-in and fan-out is (114 + 78) × 2 = 384 signals operating at 160 Mbit/s. The fan-in and fan-out within the crate will be carried out using a high-speed transmissionline backplane to transfer the 160 Mbit/s electrical signals. The maximum distance that the data have to travel on the backplane will be a distance of five module spacings. Signals shared between crates will require a fan-out of two, and will be transmitted to the crates using passive optical-fibre splitters. The number of trigger cells shared between two adjacent crates will be 192 from each of the electromagnetic and hadronic calorimeters (192 split fibres in total). Receiver modules will be designed to receive these signals and convert them to electrical form at 160 Mbit/s using the MCMs described above. These modules will be placed in the crates so that signals do not have to travel long distances on the backplane. 3.5 Missing-ET logic The missing-E T calculation will start on the cluster processor module, where E x and E y components of the total energy in the fully processed 8 × 8 trigger-cell area of the calorimeter will be calculated. Further calculations will be carried out on two other modules, namely the results module and the missing-ET module. 3.5.1 Results module There are 16 cluster processor modules in a crate, each calculating Ex and Ey components. Two results modules in each crate (one for E x and one for E y ) will carry out further summing using adder ASICs. These sums will be transmitted to the missing-E T module. A block diagram of the results module is shown in figure 3.10, and the pipelined adder tree is shown in figure 3.11. 3.5.2 Missing-ET module The function of the missing-E T module will be to receive the partial Ex and Ey sums from the eight results modules (2 results modules/crate × 4 crates), carry out further additions using the adder ASICs, and then to test ET = √(E x 2 + Ey 2 ) against thresholds using LUTs.
16 Bits × 16 Ex (E y) from the Cluster Processor Modules
BTL Clk
Clk
Interface
FIFO ROC
TTL to ECL
5 Adder ASICS
FIFO
Address Decoding
Figure 3.10: Results module block diagram.
- 32 -
.
16 Bit Ex (Ey) to Missing-E T Module
The module provides four threshold values and transmits a 4-bit ET hit-flag to the central trigger logic (CTL). A single missing-ET module is required in the system, which will receive four 16-bit E x and four 16-bit E y values from the eight results modules in the clusterprocessing crates. Figure 3.12 shows a block diagram of the missing-E T module and figure 3.13 shows the pipeline logic used on the module for the missing-ET calculation. 16
16 16
16 16
16 16
16 16
16 16
16 16
16 16
16
Adder
Adder
Adder
Adder
Adder
Adder
Adder
Adder
Latch
Latch
Latch
Latch
Latch
Latch
Latch
Latch
Adder
Adder
Adder
Adder
Latch
Latch
Latch
Latch
Adder
Adder
Latch
Latch
Adder
Latch 16-bit Ex (E y ) MSB to the Missing-E T Module
Figure 3.11: Pipelined adder tree for missing ET on the results module. 40 MHz Clock SRAM (LUT)
2 Adder ASICs
TTL-ECL
(from the Results Modules)
ECL-TTL
16 bits × 4 Ex
(64k×4)
16 bits × 4 Ey FIFO
ROC
Interface
FIFO
FIFO
4-bit Missing-E T Hit to Central Trigger Processor
Address Decoding
E x , Ey , ET to Level-2 .
Figure 3.12: Missing-E T module block diagram. 3.6 Jet trigger logic The jet algorithm considered here will use jet trigger cells of 0.4 × 0.4 in η – φ, formed in the cluster ASICs by summing over 4 × 4 areas of calorimeter trigger cells. These sums will be sent from the cluster processor modules over 160 Mbit/s serial links. The algorithm will use a 2 × 2 jet cell window, and the sums of the four jet cells will be compared with eight threshold values, as shown in figure 3.14. - 33 -
4 × Ex values from the Results Modules Adder
Adder
16 MSBs
16 MSBs
Latch
FIFO
4 × Ey values from the Results Modules
Latch
Adder
Adder
16 MSBs Latch
16 MSBs Latch
Adder
Adder
Latch
Latch
FIFO
8 MSBs from E y
8 MSBs from E x ROC
ROC Look-up table to calculate: ET = Sqrt{Ex 2 + E y 2} and to give 1 or 0 result for 4 threshold values
1
4
4
Latch
1
1 to 4 to the Central Trigger Processor
Figure 3.13: Pipelined logic for missing-E T calculations. 0.4 × 0.4 Sum Latch
0.4 × 0.4 Sum Latch
0.4 × 0.4 Sum Latch
Adder
0.4 × 0.4 Sum Latch
Adder
Adder Latch Thresholds 1-8
Comparator Latch Jet Hits 1-8
Figure 3.14: Jet algorithm. A jet ASIC will be designed to perform the algorithm over a 5 × 3 area, thereby fully processing eight (4 × 2) jet-cell windows. Since there will be 256 of the jet trigger cells, 32 jet ASICs will be required to process the jets. With four jet ASICs per jet processor module, each module will fully process an 8 × 4 jet area and require information from a 9 × 5 jet area. The information for the 8 × 4 jet trigger cells will arrive directly from the cluster-processing modules on three serial lines per jet trigger cell, each operating at 160 Mbit/s. Transmitting these data using balanced ECL will require - 34 -
192 twisted pairs into each jet processor module. Data for the remaining 13 trigger cells required for the algorithm will arrive on the backplane from neighbouring jet processor modules in a similar scheme to that used in the cluster processor crates. A total of eight jet processor modules in a single crate will be required in the system. Figure 3.15 shows a block diagram of the jet ASIC, which will receive 15 × 3-bits at 160 Mbit/s from the cluster-processing modules and will perform serial-to-parallel conversion on these data before the signals go on to the jet algorithm. Test logic, e.g. boundary scan, will be included in the ASIC for diagnostic purposes. The ASIC will be implemented in 0.7 or 0.5 µm CMOS technology. Figure 3.16 shows a block diagram of the jet processor module. The signals may be brought directly onto the backplane connector, and the hits will be transmitted to the cluster-counting modules using twisted-pair cables . 15 × 3 bits at 160 Mbit/s
Serial to Parallel Converter
160 MHz Clock
Jet Algorithm
Latch
Clocking & Control
8 × 8 bit Hit
8 Thresholds
Test Logic Slow Controls
13 (192) ..
12
ROC
BTL 4 Jet ASICS
ECLTTL BTL Interface
32 × 3 bits at 160 Mbit/s
Figure 3.15: Jet ASIC block diagram.
Snap Shot Logic
FIFO
Slow Controls
40 MHz Clock 160 MHz Clock
TTLECL
32 × 8 bit Hits to the Cluster-counting Crate
Clock Control
Figure 3.16: Jet processor module. 3.7 Cluster counting The cluster-counting electronics for jets and e.m. clusters will be identical, and will provide the following functions: • Receive the 256 pixel array (hits) from either the cluster processor modules or the jet processor modules.
- 35 -
• Apply vetoing and count non-vetoed pixels — this attempts to avoid double counting of contiguous hits. • Compare multiplicity with eight threshold values (more than required). • Provide RoI information. This will be used for the jets only, but can be used for diagnostic purposes when the de-cluster module is used for electron cluster counting. Part of the vetoing and counting logic will be implemented on a veto ASIC, as shown in figure 3.17, which will veto and count the electrons/jets from a 4 × 4 pixel array. The ASIC will count the cell marked R, provided that the cells marked 1 to 4 are not set. The vetoed pattern will be saved in a dual port memory to be used for jet RoIs.
1
2
R
3 4
R 1 23 4
R 1234
And 1 Bit Add
R 1234
And 1 Bit
R 123 4
And And 1 Bit 1 Bit Add 2 Bits
2 Bits Add
3 Bits
16 × 1-bit data from veto logic
Same as above 3 Bits
RoI Logic
Add Same as above 4 Bits
8 Bits
4 Bits
Add
Dual Port RAM
Latch 5 Bits To the adder ASICs for further counting
ROC
Figure 3.17: Cluster counting logic. Each module will contain 16 veto ASICs, with five adder ASICs to complete the adder tree. A total of eight cluster-counting modules each for processing e.m. clusters and jets are needed. The cluster-counting module will convert the 256 balanced-ECL signals to TTL before feeding them to the veto ASICs. The module will process 256 pixels for each e.m. cluster or jet threshold. The results will be transmitted to the central trigger logic via twisted-pair cables. FIFOs will be provided to capture the incoming data and the results for trigger monitoring. Figure 3.18 shows a block diagram of this module. 3.8 Readout controller A readout controller module (ROC) [9] will be included in each crate to enable the host computer to communicate with the modules in the crates, and also to provide an interface to - 36 -
the level-2 trigger. The ROC, illustrated by a block diagram in figure 3.19, will have a CPU to control and format the data and to provide the following functions: • Interface to the trigger and data acquisition computers. • Receive configuration data. • Transfer data from the modules for online monitoring. • Interface to level-2. • Interface to the central trigger logic. • Receive ‘level-1 accept’ and the BCID number, and transfer the RoIs and other relevant information. • Interface to the modules in the crates. • Initialise and set-up all ASICs and modules. • Receive data from the modules
40 MHz Clock
TTL-ECL
5 Adder ASICs
Threshold FIFO
Interface
ROC
16 Veto ASICs
Comparator
256 Pixels (Balanced ECL)
ECL-TTL
• Provide test facilities. For example, when the CPU is idle it may perform a test routine (e.g. a software cluster algorithm) on the data received from the modules. The test results could be recorded in a status register to be read out by the host computer.
FIFO
FIFO
Multiplicity Satisfied To Central Trigger Processor 256 bits RoI (jets only) to Level-2 .
Slow Controls
Figure 3.18: Cluster counting module block diagram. 3.8.1 Data transfer procedure The following is a description of the procedure by which the data distributed over the level-1 calorimeter trigger system, from the serialising ASICs onwards, could be collected and transferred to level-2 and also read out for off-line evaluation. • On each clock cycle (25 ns) the input data, intermediate results, and final results will be captured in the dual-port memories. • When the trigger signal ‘level-1 accept’ is received, the data corresponding to the BCID number, and several adjoining time frames, will be copied from the dual port RAMs into the on-board FIFO buffer. • The 16 cluster processor modules will be daisy-chained for the purpose of data transfer, and each module in turn will transfer its data from the on-board FIFO to the FIFO buffer - 37 -
in the ROC. The address of the module will also be recorded. This transfer will be made on the backplane. • When the last cluster processor module in the chain has completed its transfer, it will signal the ROC by the daisy-chain out signal. • When the ROC receives the daisy-chain out signal, the CPU will read the FIFOs and make copies of the input data and results. These data will be used to provide RoI information to the level-2 trigger and for the readout. • The CPU could make up a record from the data available as follows: - BCID number - Crate number - Card number - RoI location - Energy, etc., as required • The ROCs in the system will transfer the records to level-2 when requested. Zero-suppression could be implemented if required. • The data will be available in the ROCs if required for off-line evaluation. Daisy ChainOut From Board 16 Address Data
Processor Board Interface
.
FIFO Buffer
Input Data
Host Computer
Host Interface
Status Register
Results
CPU
BCID Data Request Data
Central Trigger & Level-2 Interface
Level-1 Accept
ROI Records
Program
Test Data
Figure 3.19: ROC block diagram. 3.9 Testing and monitoring facilities The system will provide test and monitoring facilities by incorporating FIFO ‘spy’ buffers at the input and output of each module (see module block diagrams), allowing the data to be read out for analysis. As mentioned in section 3.7.1, the CPU on the ROC may also perform data analysis on all the modules in the crate and set a flag to enable the host computer to
- 38 -
identify a faulty module in the crate. Since all the crates will have a ROC, the complete system can be monitored in this manner. 3.10 System crates 3.10.1 Cluster processor crates Each cluster processor crate will process up to 1024 e.m. and hadronic trigger cells and will include: • 16 cluster processor modules. • Two results modules. • One readout controller. Four crates will be required for the cluster processor logic. 3.10.2 Jet processor crate The jet processor crate will include eight jet processor modules, eight cluster-counting modules required for the jet trigger, and one readout controller module. 3.10.3 E.M. cluster-counting crate The e.m. cluster-counting crate will include eight cluster-counting modules for electron/photon triggers, and one readout controller module. Since there are spare slots in this crate, the missing-E T module can be housed in this crate. 3.10.4 Overall system The system will make use of 18 SU size crates (1 SU = 25 mm) with 21 slots per crate. Figure 3.20 shows the building blocks of the full calorimeter trigger system. 3.11 Summary and conclusions The proposed level-1 calorimeter trigger system will process up to 4096 electromagnetic and 4096 hadronic trigger cells of granularity ∆η × ∆φ = 0.1 × 0.1 for |η| < 3, as well as forward calorimetry with reduced granularity for missing E T, and will provide the following subtriggers to the central trigger logic: • EM cluster (electron/photon) trigger, with eight sets of programmable cluster and isolation threshold values, each with several programmable multiplicity thresholds. • Jet trigger with eight programmable threshold values, each with several programmable multiplicity thresholds. • Missing transverse energy trigger with four threshold values. Apart from providing the above sub-triggers to the central trigger logic, the system will provide region-of-interest information to the level-2 trigger, and allow intermediate results to be read out for off-line evaluation and monitoring. The following is a list of electronics required to achieve the above: • Four crates of e.m. cluster processing electronics, each containing: - 16 cluster processor modules. - 2 results modules (for partial missing-ET calculation). • One jet processor crate containing: - 8 jet processor modules. - 8 cluster-counting modules. - 39 -
• One electron cluster-counting crate containing: - 8 cluster-counting modules. - 1 missing-E T module (which will occupy a spare slot). Each crate will have a readout controller module. The system therefore requires a total of six crates, and involves six different module designs and five different ASIC designs. It can be implemented using technology which is either already available or which will be available in the very near future.
Optical Splitters & Distribution Box
(4000)
100 0 100 0 100 0 100 0
From the Front-end System
Optical Fan-out To Level-2 ROI Builder
1-4 Cluster Processor Crates Jet Processor Crate Note: 1 = Jet Trigger 2 = Electron Trigger 3 = Missing-E T Trigger
Muon Trigger
.
Electron De-cluster Crate
1
2
3
Central Trigger Processor Level-1 ACCEPT
Figure 3.20: Level-1 calorimeter trigger system.
4. Technical details and layout 4.1 Physical location underground The initial stages of the trigger, e.m. cluster finding and jet finding, are based on localised regions of the calorimeter. Only cluster counting, jet counting, and missing transverse energy calculation are global operations. In principle, the localised logic could be placed on or adjacent to the detector. However, there would be no reduction in latency if this were done, since the final level-1 trigger decision is taken in the central trigger logic outside the detector. Further, the bulk of the optical cables carrying the 8000 or so trigger signals is not enormous, and it is preferable to place this critical logic in an accessible place, saving space and minimising power dissipation near the detector. The calorimeter trigger processor will therefore be sited in the cavern on the outside of the shielding. The length of the optical fibres from the detector to the trigger is estimated to be about 65 m. 4.2 Power dissipation and cooling It is assumed that the counting room will be provided with standard cooled racks with watercooled heat exchangers and forced-air ventilation. Such racks can typically house 2 to 4 large crates dissipating a total of up to 10 kW. - 40 -
4.3 Crate structure and physical layout Prototype work has been done using crates 9U high and 40 cm deep. These are available commercially with a variety of power supply options, and, unless there is a good reason, crates of a similar size will be used for the final system. Depending on rack height, cooling capabilities and the power consumption of our electronics, there will be 2 to 4 crates per rack. It will be possible to change a module without major disruption of electrical or optical cabling, or serious risk of damage. Power supplies will be easily replaceable without removing modules or cabling, and will be of standard commercial design. 4.4 Backplane A custom backplane will be needed for signal fan-out within the crate. The modules will be arranged so that no signal need travel for a distance of more than about five slots. As the majority of the fan-out connections are to the adjacent modules, it is possible that an alternative solution of routing these on easily removable front-panel links may be preferable to reduce the density of backplane connections. The backplane will carry single-ended 160 Mbit/s electrical signals. This will be done using a high-speed transmission-line backplane, IEEE P1114.1 Futurebus+ Backplane Transceiver Logic (BTL) [10], rather than the more usual balanced ECL (which requires complementary signals) in order to halve the number of input-output pins on the modules. Backplane connectors will be high-density types. It may be desirable to use power bus-bars to the modules rather than pins in order to keep insertion and removal forces reasonable. For example, connectors specified for Futurebus+ might be suitable. Four-row connectors with 2 mm pin spacing would allow up to three 192-pin connectors and one 96-pin connector per module and still leave room for power bus-bars. This gives 672 connections per module; if this is not sufficient then 5-row connectors are also available. 4.5 Control bus Prototype work has been done using VMEbus for downloading and readout of modules. If a new standard, such as Futurebus+, is advantageous and easily available for use on the ATLAS timescale then it would be used if the experiment were to adopt it as a standard. But for the immediate future VMEbus will remain the most easily used and viable solution. VMEbus uses a 3U connector and, in its 32-bit and 64-bit versions, part or all of a second 3U connector. It may thus be necessary to use the VMEbus protocol, but with denser connectors. 4.6 Optical fibre handling 4.6.1 Cables It is likely that commercial ribbon cables will be used; the modularity will be decided later. 4.6.2 Fan-outs Signals needing to be sent to more than one crate will be fanned out using passive optical splitters, which are commercially available. This avoids many problems which would arise in making electrical links between crates. The optical signal transmitters will require sufficient power to allow splitting without degrading the error rate, but this does not seem to be a significant problem. 4.6.3 Connectors Optical ribbon cable connectors are available in various sizes, e.g. MPO series, typically requiring 125 mm of front-panel space for 64 fibres. - 41 -
5. Connections to other parts of the trigger system The two main communication paths from the level-1 trigger processor are to the central trigger logic (CTL) and to the level-2 trigger, as shown schematically in figure 5.1. The task of the CTL will be to collect and combine results from the level-1 calorimeter and muon trigger systems and produce an overall level-1 decision. Following a level-1 accept, the level2 system will further refine the trigger decision using full-granularity sub-detector data. Level-2 processing will be guided by region-of-interest information from the level-1 systems, indicating which regions of the sub-detectors contain potentially interesting tracks or clusters, i.e. the location of potential electron/photon, muon or jet candidates. Calorimeters
Muon Detectors
Calorimeter Trigger Processor
Muon Trigger Processor
ET
Jet
e/γ
Subtrigger information
µ
RoI data Central Trigger Processor
Region-of-Interest Unit (Level-1/Level-2)
Timing, trigger and control distribution
Front-end Systems
Level-2 Trigger
Figure 5.1: Schematic representation of the communication paths from the level-1 trigger processors (links to DAQ not shown). 5.1 Central trigger logic The level-1 central trigger logic (CTL) [11] will form the final level-1 trigger decision based on combinations of sub-trigger data patterns (SDPs) which it will receive from the sub-trigger processors. This decision will be made synchronously every beam crossing. Data from different sub-trigger processors may arrive at the CTL with different latencies (due to the differing processing algorithms), and will be brought into phase within the CTL using variable-length pipeline delays. The CTL will expect to receive data patterns that are either four or eight bits wide, depending upon their source. It will include scalers to record trigger rates and pre-scalers to limit high-rate trigger inputs. The sub-trigger processors will work independently and in parallel to extract event characteristics such as: • Electron/photon multiplicity for several thresholds with various isolation requirements. • Jet multiplicity for several thresholds. • Missing transverse energy. • Muon multiplicity for several thresholds.
- 42 -
5.2 Level-1 calorimeter sub-trigger data patterns As can be seen in figure 5.1, the calorimeter trigger processor will send three types of subtrigger data patterns to the central trigger logic. Figure 3.20 shows the global structure of the level-1 calorimeter trigger system, and the data flow which will enable the above SDPs to be formed. The missing-ET module will receive partial Ex and Ey sums from the eight results modules and produce a final missing transverse energy sum. This will be compared with four thresholds using look-up tables, and the results sent to the CTL as a 4-bit ET flag. The jet and electron cluster-counting modules will receive information on potential jet or electron/photon clusters. The candidates will then be de-clustered to avoid double counting. The event multiplicity for each type of cluster will be compared against eight multiplicity threshold values and the result sent to the CTL. 5.3 Level-1/level-2 interface To reduce the level-1 trigger rate of ≈100 kHz to a rate which can be read out and recorded on permanent media (~100 Hz), complex algorithms using full-granularity detector information must be employed. This will be achieved in the level-2 trigger system, which is based on programmable processors. The level-1 and level-2 systems are divided into units [12] which will interact with each other in a well-defined way (figure 5.2). When an event is accepted by level-1, the event number (generated in the level-1 CTL) will be sent to the level-2 trigger supervisor (T2S). The supervisor will maintain a list of free level-2 global processors (T2G), from which one will be allocated to handle the event. The supervisor will send the event number and T2G number to the region-of-interest builder. An inhibit signal to the level-1 CTL will be used to prevent further level-1 triggers should the level-2 system approach saturation (i.e. if it is about to run out of free global processors, or if the buffers are almost full). The RoI builder will collect RoI data from the level-1 sub-trigger processors and construct RoI records, copies of which will be sent to the local processors associated with each of the sub-detectors and to the global processor responsible for the event. On receipt of an RoI record, a local processor will obtain the information it requires from the sub-detector readout system, perform a feature analysis, construct a feature record parametrising the object of interest (track, cluster, etc.), and send this to the global processor responsible for the event. The global processor will receive copies of all of the RoI records for the event. When all the feature records have been collected, the global processor will perform its feature combination analysis and make a final level-2 decision for the event. The decision record will be sent to the supervisor, which will then distribute the level-2 trigger decision to the readout systems and return the T2G processor to the ‘free’ list. Two architectures, asynchronous and systolic, are currently being investigated for level-2. Apart from a tighter time constraint for the systolic option, both will require similar RoI information. In each case, a level-1 trigger will initiate data transfer from the front-end of each sub-detector into level-2 buffers, where it will be stored until after the level-2 decision. In the ‘asynchronous’ option, the data for feature extraction will be transferred from the buffers to ‘local processors’; for the systolic option, the data will be intercepted before the level-2 buffers and ‘routed’ to the feature extractors. In either case, a mechanism will be needed to select the correct data for analysis, to transfer it to the feature extraction processors and to initiate the process.
- 43 -
LHC signals
Front-end systems
L1 data (for readout)
Trigger timing dist'n
L1 yes/no (synch.)
RoI records RoI data RoI builder (RoIB)
Level-1 trigger Event #
Global T2 # Inhibit triggers
Local processor (T2L)
Feature records RoI records
Event #
Level-2 buffer
Global processor (T2G)
Event # Level-2 supervisor (T2S)
Decision records
L2 yes/no (to readout systems)
Figure 5.2: Interaction between level-1 and level-2. 5.4 Region-of-interest information Information for the RoI builder will be derived from four sources — the muon system, the calorimeter system, the CTL system, and the level-2 trigger supervisor. All such information must be combined and processed in the RoI builder. The information available from the calorimeter system will be in the form of hit maps indicating the positions of possible clusters. There will be separate maps for jet and e.m. hits. The e.m. map will be based on a low threshold and will not include isolation. The maps will be sent to the RoI builder together with an event number and BCID number. By only analysing such RoIs at level-2, a considerable reduction in processing and data transfer rate can be made because only data from areas of the detector covered by an RoI have to be sent to level-2. As level-1 itself will require multi-threshold information to produce combinatorial sub-triggers, generation of RoIs for level-2 will not be a big overhead.
6. Trigger operation The quality of the trigger will have a critical influence on the physics performance of the experiment. The architecture proposed therefore incorporates extensive features to aid in trigger commissioning, set-up, performance monitoring, early detection of impending component or timing failure, and diagnostics to identify failed modules. 6.1 Timing control and set-up The clocks used in the trigger crates will be derived from the precision timing system developed by RD12 [13,14], which also supplies clocking to detector front-end systems and pipelines. The whole trigger system timing is thus inherently stable, both internally and with respect to the detector. This means that when power is first applied to the system, only the relative phases of detector channels and trigger components remain to be adjusted. - 44 -
A test pattern generator is included in the transmitting logic for all detector channels involved in forming the trigger decision. A sequence of digital test patterns will be transmitted from all detector trigger channels at a programmable bunch crossing number, normally positioned in the long gap in the LHC bunch structure. On arrival in the trigger system, these test signals will be brought into phase using programmable delays and diagnostic memories. Residual timing errors after the delays can approach half the bunch crossing interval (i.e. ~10 ns) without compromising proper signal latching. Fine-grain delays are used to measure the timing width of the acceptable region and to position incoming signals centrally on entry to the trigger crates. This procedure is repeated for the following parts of the trigger, up to and including the central trigger logic. At this stage the calorimeter trigger is correctly timed relative to the detector. The final part of timing adjustment occurs as individual detector channels are adjusted in time to centre FADC samples on the peak of analogue detector signals from LHC collisions. Exactly compensating adjustments are applied in the trigger system while this is carried out. The scheme proposed by RD12 is used to determine exact bunch crossing numbers by observing the distinctive pattern of empty LHC buckets in each detector channel. The fine-grain delays are subsequently used to detect and track any long-term timing drifts. 6.2 Monitoring The test patterns used to set up timing are used for trigger monitoring, both under normal LHC running conditions and when the experiment is awaiting beam. In this mode, a repeated cyclic pattern of data values is sent in the long LHC gap. The LHC turn rate of 88 kHz allows an independent test of trigger data paths and logic to be completed every few seconds as the experiment runs. If provided in the calorimeters, analogue pulses are injected into the detector electronics during the long LHC gap, providing a regular check of the analogue data path to the trigger FADCs and the analogue BCID circuitry. The aim of this monitoring is to ensure perfect trigger operation by using internal testing. This is supplemented by analysis later in the data acquisition chain, or off-line, of samples of accepted and rejected events. In the event that a problem is found, sufficient information will be available to identify the failing module for replacement by a non-expert. 6.3 Module testing and repair A separate diagnostic and repair facility will be provided for module testing and repair. All modules will include diagnostic memories and logic-analyser probe points to aid fault tracing, and computer-based procedures will be developed to isolate the majority of faults down to component level. A similar facility will be required in home institutes for testing new modules as they are built and for repair of any more difficult faults. 6.4 Control computers Local computing support for the trigger system is provided by a microprocessor in each trigger crate. Full access is possible over the backplane bus in the trigger crates to each module for testing. The processors are linked to each other, to dedicated trigger workstations, and to the central ATLAS trigger and data acquisition suite. It cannot be assumed that the main ATLAS data acquisition system will be constantly available for trigger set-up while the experiment is being assembled. The trigger computers are needed to ensure that trigger commissioning can be completed independently of the main data acquisition system. Access will be needed for test purposes to several areas of experiment, including detector pulsing, readout, and control of the central timing system. Requirements have not yet been specified in detail. - 45 -
When installation is complete, the trigger computers will be integrated with other parts of the ATLAS computer system, which will then take over responsibility for loading trigger tables and parameters at run start. Computers used for module diagnostics and repair will not however be incorporated into the ATLAS on-line system. 6.5 Latency estimate The latency is calculated in 25 ns LHC bunch-crossing times (bc), reflecting the pipelined nature of the trigger processor. The detailed timing calculation presented here starts at the presentation of the analogue pulse peak to the trigger FADCs, and thus does not explicitly show time-of-flight, front-end electronics delays and pulse-peaking times. The sum of these is 8 bc for FERMI and 9 bc for non-FERMI front-end electronics; the difference is due to the analogue signal summation in the latter, while the FERMI summing is included in our tables. However, all internal cable delays in the trigger, as well as cabling required to send trigger flags to the central trigger logic, are included. Optical data transmission and serialisation using the Hewlett-Packard G-link chip set are assumed. Item
Time (bc)
Comments
Analogue-sum peak presented to FADC
0
FADC sample presented to LUT
1
Calibrated FADC data enters BCID logic
2
BCID output enters 800 Mbit/s serialiser
6
80 MHz BCID ASIC
First serial bit sent on fibre
6 + 2 ns
H-P G-link specification
Last serial bit sent on fibre (in 20-bit frame)
7 + 0.75 ns
Table 6.1: Latency calculation for non-FERMI digitisation, BCID and serialisation. Table 6.2 shows the corresponding timing for electronics near the detector for the case when FERMI front-end electronics is used, with 40 MHz and 80 MHz internal timing. It should be noted that the FERMI latency includes a complete implementation of the fault-tolerance protocol: ECC encoding/decoding of all data transferred between the internal ASICs as well as the modulo-3 residue encoding/decoding around the BCID logic. Item
Time (bc): 40 MHz Time (bc): 80 MHz
Analogue-sum peak presented to FADC
0
0
FADC sample presented to LUT
14
6
Calibrated data enters FERMI summing
17
7.5
Summed data enters BCID logic
20.5
10
Data enters FERMI board summing
28
14
First serial bit sent on fibre
29 + 2 ns
15 + 2 ns
Last serial bit sent on fibre (in 20-bit frame)
30 + 0.75 ns
16 + 0.75 ns
Table 6.2: Latency calculation for FERMI-based digitisation, BCID and serialisation. An estimated 65 metres of fibre-optic cable is required from the detector, giving a delay of 325 ns, or 13 bc. Parallel data derived from the 800 Mbit/s stream is delivered with a latency - 46 -
of two bc plus 2 ns. Timing at the input side of the 160 MHz serialising ASIC is derived from the 40 MHz strobe, recovered from the 800 Mbit/s serial data and qualified by the 160 MHz clock. In the worst case, serial transmission starts 1 bc + 6.25 ns after the 40 MHz strobe. Timing synchronisation is recovered in the synchronisation logic of the cluster-finding ASIC. The latency through the cluster processing stage is shown in table 6.3. Item
Time (bc)
Comments
Last serial bit received from fibre
20 + 0.75 ns
325 ns = 13 bc
Parallel data reach 160 Mbit/s serialiser
22 + 2.75 ns
2 bc + 2 ns s/p latency
First serial bit sent
23 + 9.0 ns
After 1 bc + 6.25 ns
Last serial bit sent
24 + 2.75 ns
Last serial bit enters cluster ASIC
24 + 2.75 ns
Parallel data enters synchronising logic
26 + 2.75 ns
Synchronised data enters cluster algorithm
27
22.25 ns synch. delay
Results presented on algorithm output
31
4-bc algorithm
Table 6.3: Latency calculation for cluster processing. The missing-energy calculation is in phase with cluster processing until data is transmitted in parallel format to the missing-ET module. Half a bc is allowed for transmission, implying a maximum cable length of around 2.5 m. The missing-E T module runs a half bc displaced from the earlier logic. A further half bc is allowed for transmission to the central trigger logic on a 2.5 m cable. The missing-ET latency calculation is in table 6.4. Item
Time (bc)
ET enters LUT
31
Ex and E y enter adder ASIC
32
Ex and E y output from adder ASIC
33
Ex and E y sent on backplane at 40 MHz
33
Ex and E y enter results module adders
34
Ex and E y sums leave adder ASICs
35
Ex and E y received on missing-ET module
35.5
Hit flags sent to central trigger logic
38.5
Hit flags arrive at central trigger logic
39
Total ET latency
39
Comments
80 MHz adder ASIC
80 MHz adder ASIC
Table 6.4: Latency calculation for missing-energy calculation. Half a bc is allowed for parallel e.m.-hit transmission to the cluster-counting modules, and a further half for results transmission to the central trigger logic, both on 2.5 m cables. The cluster-counting modules run a half bc displaced from earlier logic. This part of the latency is given in table 6.5. - 47 -
Item
Time (bc)
Electron hits leave cluster module
31
Hits enter veto ASICs on counting modules
31.5
Hits enter adder ASICs
32.5
Hit sums enter comparator
33.5
Multiplicity flags sent to CTL
34.5
Multiplicity flags enter CTL
35
Total e.m. hit latency
35
Comments
80 MHz adder ASIC
Table 6.5: Latency calculation for e.m. trigger processing. Item
Time (bc)
Comments
ET sum enters 160 Mb/s serialiser
31
First ET sum-bit transmitted
32 + 6.25 ns
Last ET sum-bit transmitted
33
Last ET sum-bit received on jet module
33.5
ET sum latched in jet ASIC
35.5
Jet algorithm complete
37.5
Jet hits sent to CTL
37.5
Jet hits enter CTL
38
Total jet latency
38
= 32 bc + 1 bc
Table 6.6: Latency calculation for jet trigger. Item
Latency (bc) Cumulative latency (bc)
Analogue chain (FERMI takes 8 bc)
9
9
Digitisation, BCID and serialisation (non-FERMI)
7
16
Fibre delay
13
29
Cluster processing
11
40
Missing ET
8
48
Electron trigger
4
Jet trigger
7
Central trigger logic (see Technical Proposal)
5
53
Trigger distribution and return fibres
17
70
Table 6.7: Summary of latency calculation for non-FERMI option.
- 48 -
For jet processing, serialisation takes place inside the cluster processing ASIC with a latency of 1 bc, since the 40 and 160 MHz clocks are exactly in phase. Conversion to parallel format requires a further 2 bc. The jet latency is shown in table 6.6. The missing-ET calculation is the slowest trigger component and thus determines the overall latency, which is summarised in table 6.7. A comparison of the results, for the FERMI and non-FERMI front-end logic, is given is table 6.8. Overall latency (non-FERMI option)
70 bc
Overall latency (40 MHz FERMI option)
92 bc
Overall latency (80 MHz FERMI option)
78 bc
Table 6.8: Overall latency results for different front-end options.
7. Demonstrator and prototyping strategy 7.1 Overview The continuing programme to demonstrate the feasibility of this system is discussed in detail in reference [2]. A parallel programme to investigate alternative technologies, with the aims of improving performance and/or reducing costs, is also in progress [3] — parts of that system showing clear advantages will be incorporated in the final ATLAS trigger. An intensive R&D programme has been pursued over the last three years with the general aims of exploring the problems of a digital implementation of a calorimeter trigger at level 1. This programme has involved continuing simulation studies of various algorithms for e.m. cluster-finding and bunch-crossing identification, and hardware implementation of the chosen algorithms in custom-designed ASICs. Evaluation of these ASICs in a realistic environment was achieved by means of technical demonstrator systems, which were thoroughly assessed in a test beam. The first phase of this programme initially studied the operation of a first-generation cluster-processing ASIC at full LHC speeds, and later studied the performance of a single-channel BCID module. A second system to perform BCID, on the 36 calorimeter channels which are currently instrumented for the phase-I demonstrator programme, is nearly ready and will be tested in 1995. The final phase of this demonstrator programme will explore the remaining areas of novel technology inherent in the full ATLAS system design. These include high-speed optical and electrical data transmission, and signal fanout on transmission-line backplanes. A successful conclusion of this phase will allow a realistic prototype trigger system for ATLAS to be constructed. 7.2 Final system prototyping At the conclusion of the demonstrator programme a full system design will be undertaken, following which a prototype programme will be required before production of the final modules could start. The precise details of this work will depend to some extent on the results from the demonstrator programme, but in general terms it may be described as follows. Assuming that the demonstrator programme proves the viability of the system principles outlined in section 3, it is planned to design and construct a small-scale version of the final level-1 trigger system with prototype modules closely equivalent in function to the expected final system modules. To study system-specific effects, a minimal set of prototype modules - 49 -
would be needed, including for example at least five cluster processor modules to provide the full data fanout environment. The design of the system modules will require that designs of the first generation of each of the five ASIC designs are undertaken at this time, which will imply considerable nonrecurring engineering costs. In addition, issues related to infrastructure such as choice of crates, bus, power supplies, cooling, etc. will need by then to be resolved and a small number of crates with power supplies purchased. The experience gained by operating this prototype system may lead to some design changes, of necessarily limited scope, which should still be able to be accommodated at this stage. Hopefully it will not be necessary to re-design any of the ASICs, but provision has been made in the cost estimates for a second round of NRE costs for each ASIC. The final phase of the prototyping, however, will involve the construction of full preproduction modules, after which no further design changes can be permitted without a major impact on costs and timescales.
8. Estimated timescale The following timescale is based on an LHC start date of 2003. The trigger system is then required to be installed and fully operational early in 2002, so that it is available for detector commissioning and readout tests as the experiment is installed. Manufacture and testing of approximately 100 modules is expected to require two years. The trigger concept must be frozen in 1997 to allow time for detailed design and final prototype testing before manufacture begins. This leads to the following schedule: 1994
Construct BCID demonstrator.
1995
BCID beam tests. Design & construct phase-II demonstrator.
1996
Phase-II demonstrator beam tests at CERN.
1997
Concept frozen, detailed design starts.
1998
Detailed design completed.
1999
Prototype testing completed. Manufacture of final modules starts.
2000
Manufacture of final modules continues.
2001
Manufacture of final modules completed. Assembly at CERN starts.
2002
Assembly at CERN completed.
2003
Running with beam.
References [1] ATLAS Technical Proposal. CERN/LHCC/94-43 (1994). [2] A Demonstrator Programme for the Atlas Level-1 Calorimeter Trigger. I.P. Brawn et al., ATLAS internal note DAQ-NO-31. [3] An R&D Programme for Alternative Technologies for the ATLAS Level-1 Calorimeter Trigger. G. Appelquist et al., ATLAS internal note DAQ-NO-32. - 50 -
[4] Physics Simulation Studies of the First-Level Electron/Photon Trigger. A. Watson, RD27 Note 13 (1993). [5] A First-Level Calorimeter Trigger Processor for The Large Hadron Collider. V. Perera et al., RD27 Note 8 (1993). [6] A Bit-Serial First-Level Calorimeter Trigger for an LHC Detector. C. Bohm et al., RD27 Note 6 (1993). [7] A Digital Front-end and Readout Microsystem for Calorimetry at LHC: The FERMI Project. A. Dell’Acqua et al., IEEE Transactions on Nuclear Science 40 (1993) 516. [8] Preliminary Investigations into Bunch-Crossing Identification for the Level-1 Trigger. I.P. Brawn, RD27 Note 11 (1993). [9] Crate/Readout Controller (ROC) (For the First-Level Calorimeter Trigger Processor). V. Perera, RD27 Note 10 (1993). [10] Standard for Futurebus+ — Physical Layer and Profile Specification. IEEE Computer Society Document ANSI/IEEE 896.2 (1991). [11] Central Trigger Processor for the First-Level Trigger for LHC Experiments. J.-P. Vanuxem and H. Wendler, RD27 Note 9 (1993). [12] Ideas for a Local/Global Level-2 Trigger System. N. Ellis, RD27 Note 7 (1993). [13] Multichannel Optical Fibre Distribution System for LHC Detector Timing and Control Signals. B.G. Taylor, RD27 Note 3 (1992). [14] Optical Timing, Trigger and Control Distribution for LHC Detectors. B.G. Taylor, RD27 Note 18 (1993).
- 51 -