Available online at www.sciencedirect.com Available online at www.sciencedirect.com
Procedia Engineering
Procedia Engineering 00 (2011) 000–000 Procedia Engineering 15 (2011) 3270 – 3276 www.elsevier.com/locate/procedia
Advanced in Control Engineering and Information Science
The Multi-object Optimal Pass Design based on MOGA Ma Jinhonga* , ZHANG Wen-zhib a
Metallurgy and energy college of Hebei Polytechnic University, Tangshan, 063009 China b Hebei Province modern metallurgy technology key laboratory,063009,china c College of Mechanical and Engineering, Yanshan University, Qinhuangdao ,066004, China
Abstract The optimal pass design is based on Multi-Object Genetic Algorithm (GA) with the objective of the least of total energy consumption and loads balance on bar mill. By optimization, in condition of normal rolling, the less total energy consumption and relative balanced bar mill loads. Genetic Algorithm Toolbox with Matlab software is adopted to search optimum parameters, which is a new method for the multi-object optimal pass design.
© 2011 Published by Elsevier Ltd. Open access under CC BY-NC-ND license. Selection and/or peer-review under responsibility of [CEIS 2011] Keywords: Multi-Objective Genetic Algorithm(MOGA); Pass design; Multi-object optimal design; Total energy consumption ;Load balance
B
Nomenclature the each pass width
H
the each pass hight
R
arc radius
r
outsider arc radius vi
rolling speed of the ith pass
*
Corresponding author. Tel.: +086-315-2592155; fax: +086-315-2592155;. E-mail address:
[email protected].
1877-7058 © 2011 Published by Elsevier Ltd. Open access under CC BY-NC-ND license. doi:10.1016/j.proeng.2011.08.614
Ma JinhongMa andJinhong ZHANGetWen-zhi / Procedia Engineering 15 (2011) 3270 – 3276 al/ Procedia Engineering 00 (2011) 000–000
2
Mi
τi
rolling torque of the ith pass rolling time of the ith pass
a
coefficient;
qi
rolling energy consumption of the ith pass
n
rolling pass
Ni
the ith stand the main motor power
N hi
the ith stand the main motor rated power
λ
the group main motor load coefficient
a
axial ratio of unequal shaft section rolling piece
amin
actual the minimum allowed axial ratio
a max
actual the maximum allowed axial ratio
t0
the rolling temperature before pass,◦C
Π
the cross-sectional circumference of rolling-piece after rolling,mm
ω
the cross-sectional area of rolling piece after rolling,mm2
t1
cooling time of rolling piece,s
Δtb
the rise of temperature in the pass,◦C
σ
metal plastic deformation resistance,Mpa
μ
elongation coefficient
σ0
benchmark deformation resistance, namely the deformation resistance when
t=1000◦C , γ = 0.4 and u = 10 s −1 , Mpa t
deformation temperature,◦C
u
deformation speed,s-1
a1 ~ a6
regression coefficient, which value is depended on steel kinds
Di
rolling diameter of the ith pass
1 Introduction Continuous rolling is generally used in bar production, the process is divided into three stage, which is rough rolling, intermediate rolling and finishing rolling. According to commonly used pass design method
3271
3272
Ma Jinhong and ZHANG Wen-zhi Engineering / Procedia Engineering 15 (2011) 3270 – 3276 Ma Jinhong et al / Procedia 00 (2011) 000–000
3
of rolling bar, it is difficult to make balance loads between the mills and make the least total energy consume . With the objective of least energy consumption and mill loads balance, the passes of bars are optimized by the Multi-Objective Genetic Algorithm compiled by Matlab language, thus, the reasonable rolling process is obtained. Taking continuous rolling alloy steel 40Cr of the bar factory in a steel company as example, the main rolling line is made up by 22 stands, which is divided into rough group, inter-mediate group and finishing group. Each strand is driven by a direct current motor respectively. Mills are layout with flat vertical alternate arrangement. Billets 180mm square are used. The train is composed by 4-6-6-6 strands, i.e rough rolling group is composed by four stands, intermediate rolling group by six stands, the first finishing rolling group by six strands and the second finishing group by six stands. The method of changing pass size or adjusting rolling gap is adopted to obtain the least energy consumption and the rolling loads balance[1]. Adjusting roller gap has to be in adjusting gap range, however ,the size of the rolling piece is greatly altered, only the method of changing the pass size is used to reduce the total energy consumption and balance the mill loads. In this paper , the former method is used. 2 Optimization method Genetic algorithm (GA) refers to natural selection and natural hereditary random searching algorithm based on natural hereditary[2]. Genetic algorithm is to search the optimal solution through simulating natural evolution process.Using chromosome is made up of string coded by some coding technique, simulating of the evolution of the group made up of strings. Genetic algorithm restructs the strings with better adaptability by organization and random information exchange , which generates new list of groups. Because each stand is driven alone, the optimization of pass design for reducing the total energy consumption and balance the mill loads is to deal with the whole mill group. 2.1 Design variables X = [ B, H , R, r ]T
(1)
Where, B = [ B1 , B2 ,L , B22 ] , H = [ H1 , H 2 ,L , H 22 ] , R = [ R4 , R5 ,L , R22 ] , r = [ r4 , r2 ,L r22 ] , Therefore, X = [ x1 , x2 ,L , x22 ] 2.2 Objective function 2.2.1 minimum rolling energy consumption Rolling process is consisted of n passes, therefore, the total energy is shown as formula (2). n
n
Q = ∑ qi =∑ M i viτ i Di → min (2)
i =1
i =1
From slab to production, totally by n rolling passes, although the rolling energy consumption is different of each pass, total energy consumption should be minimum. Thus, which can save energy and reduce the producing cost.
Ma JinhongMa andJinhong ZHANGetWen-zhi / Procedia Engineering 15 (2011) 3270 – 3276 al/ Procedia Engineering 00 (2011) 000–000
4
2.2.2 relative equal load distribution When the motor power is not equal, if load is distributed according to equal load, equal load distribution power may be lead to small capacity motor inadequacy, however, the big capacity motor not give full play to its ability. In this kind of circumstance, the rolling rules is according to relative equal energy consumption of each mill, i.e, big capacity motor consumes more, however, the small capacity motor consumes less, thus, the equipment ability can be full played and can avoid load uneven distribution and produces rolling accidents. The objective function of bar mill load distribution is expressed as formula (3). n
min S = ∑ ( N i − λ N hi ) → min 2
i =1
(3) The objective function shows that difference between rolling power and rated power multiply by load coefficient , then which is squared, whose sum attains minimum. I.e the mill load achieves to relative balance. 2.3 Boundary conditions In the process of searching objective function limit, usually, which is subjected by some constraints. These constraints are called for boundary conditions. The introduction of boundary conditions, on one hand, makes the solution of optimal problem practical significance, and on the other hand, boundary conditions for optimization problem search space narrowed also plays a large role. Taking into accounting of the pass design and optimal practical problems, the following boundary conditions are introduced, • Bite condition. In order to guarantee the rolling-piece into roller smoothly and ensure normal and stable rolling process, bite condition must be considered into rolling condition. rolling angle is usually used to measure the rolling conditions when rolling piece into roller, namely bite angle of the actual rolling piece should be less than that of maximum pass of mill. • Stable condition of rolling piece in the pass. The stable condition of rolling piece in the pass can be shown as following formula: amin < a < amax (4) Motor Capability. Main motor of mill is not overheating and overload. • Mill capability. The maximum allowable rolling force, maximum allowed torque, minimum allow rolling speed and maximum allowable rolling speed requirements are meet, and roller, transmission system strength and mill speed range should be meet. • The rolling-piece filled pass condition. To meet the demand of filled pass degrees to ensure the rolledpiece cross-section shape correct. 3 Mathematical model 3.1 Rolling temperature model a. и LeonKeFu method is adopted to calculate rolling temperature as following formula (5). 1000 ΔT = t0 − 3 + 273 3 ⎞ 0.0255Π t1 ⎛ 1000 +⎜ ⎟ t + Δ t + 273 ω b ⎝ 0 ⎠ (5)
3273
3274
Ma Jinhong and ZHANG Wen-zhi Engineering / Procedia Engineering 15 (2011) 3270 – 3276 Ma Jinhong et al / Procedia 00 (2011) 000–000
Δtb is determined by formula (6).
Δtb = 0.183σ ln μ (6)
3.2 Deformation resistance model According to ZhouJiHua's research[3], the deformation resistance mathematical model is repressed as following formula, which formula shows the relationship between the deformation resistance and deformation temperature, and the relationship of the deformation speed and deformation degree. With each unit of the various kind of steel, nonlinear regression used, each regression coefficient values are obtained by formula (7). a3T + a4 ⎡ ⎛ γ ⎞ a5 γ ⎤ ⎛u ⎞ σ σ 0 exp ( a1T + a2 ) ⎜ ⎟ (7) = × ⎢ a6 ⎜ ⎥ ⎟ − ( a6 − 1) 0.4 ⎥⎦ ⎝ 10 ⎠ ⎢⎣ ⎝ 0.4 ⎠ Where, T= (t + 273) 1000 3.3 Mechanical parameters model
5
Ma JinhongMa andJinhong ZHANGetWen-zhi / Procedia Engineering 15 (2011) 3270 – 3276 al/ Procedia Engineering 00 (2011) 000–000
6
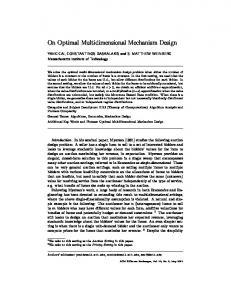
SiMiErNuoFu method is adopted to calculate rolling force and rolling torque, although this method is trival, its accuracy is high and it is close to actual measurement . 4.optimal results Genetic algorithm program compiled by Matlab language is operated. the passes dimensions are obtained , which can reduce total energy consumption in the rolling process of bar and balance the mill loads. Taking the bar mill of a steel company as example, 180mm x 180mm continuous casting slab is used for rolling Φ16mm bar, the type of steel is 40Cr. The pass is optimized , taking the minimum total energy consumption and mill loads equilibrium as objective and Weight coefficient 0.5. The program diagram is shown as Figure 1. The dimensions of pass before and after optimization are shown in Table 1, mill loads are seen as Table 2 before and after optimization. Based on genetic algorithm by Matlab optimization design, bar mill units realize that the total energy consumption is relatively small and mill load relative balance. The optimization results show that the total energy consumption is reduced 9.8% after optimized, The original load of tenth mill, which load is highest, compared with the original design rolling power drop nearly 13.4%, therefore, rolling load distribution is more reasonable,the roller rings collapse accident is no longer happen.
Fig.1 Flowchart of program designing Passes
pass
1 2 3 4 5 6 7 8 9 10 11 12 13
box Box oval circle oval circle oval circle oval circle oval circle oval
Table 1 Pass dimension before and after optimization pass dimension before optimization pass dimension after optimization B 204.32 161.44 195.00 130.55 178.00 104.44 138.79 84.81 120.00 65.17 90.51 51.11 75.26
H 135.00 145.00 108.00 125.00 82.00 100.00 68.00 81.00 48.00 62.00 39.00 48.50 30.00
B 205.80 166.18 196.50 130.55 147.36 104.44 124.16 84.81 102.87 65.17 85.90 51.11 67.50
H 141.03 145.47 108.00 125.00 87.67 98.37 71.11 79.49 53.94 60.62 43.33 47.31 33.53
3275
3276
Ma Jinhong and ZHANG Wen-zhi Engineering / Procedia Engineering 15 (2011) 3270 – 3276 Ma Jinhong et al / Procedia 00 (2011) 000–000 14 15 16 17 18 19 20 21 22
circle oval circle oval circle oval circle oval circle
40.08 55.24 31.57 45.14 25.10 37.92 20.54 24.82 16.79
38.00 24.00 30.00 19.00 24.00 16.00 19.50 14.00 16.19
40.08 52.87 31.57 43.68 25.10 36.08 20.54 26.15 16.79
37.04 24.36 29.30 20.85 23.58 16.98 19.03 12.66 16.03
Table 2 Mill load before and after optimization pass
1 2 3 4 5 6 7 8 9 10 11
Mill load % Original pass
46.3 46.14 52.81 70.53 56.67 46.14 55.44 45.26 64.74 66.32 61.28
Optimal pass
45.33 50.91 54.39 66.17 58.26 52.47 62.5 53.27 64.2 57.44 60.64
Comparison with original pass %
-2.10 10.33 1.99 -6.18 2.81 13.72 12.73 17.70 -0.83 -13.39 -1.04
pass
12 13 14 15 16 17 18 19 20 21 22
Mill load % Original pass
66.14 67.18 70.52 71.8 71.93 64.87 71.93 64.87 68.07 52.44 62.81
Optimal pass
63.69 67.33 68.84 65 67.15 67.59 68.23 70.02 68.46 60.2 63.91
Comparison with original pass %
-3.70 0.22 -2.38 -9.47 -6.65 4.19 -5.14 7.94 0.57 14.80 1.75
5 Conclusion Multi-objective optimization based on the genetic algorithm is adopted in this paper, although its programming process is complicated, calculations is quickly and accurately and drawing is handy and it can quickly and accurately output the result for a specific rolling process. This has a very important role in shortening the design cycle, improving product quality, reducing accident and improving efficiency. The genetic algorithm used in optimization of pass is not very broad, so more thorough research is necessary. References [1] S.Y,Zhao, W.L,Tang. Shaped steel pass design. Peking:Metallurgical Industry Press, 2000:276-295 [2]Kalyanmoy Deb.Chichester:John Wiley&Sons,Ltd.2001:12-38 [3] J.H,Zhou, K.Z,Guang. Metal plastic deformation resistance. Peking: Machinery industry press, 1989:211-229.
7