Delft University of Technology Parallel and Distributed Systems Report Series
The Peer-to-Peer Trace Archive: Design and Comparative Trace Analysis Boxun Zhang, Alexandru Iosup, and Dick Epema {B.Zhang,A.Iosup,D.H.J.Epema}@tudelft.nl
Completed April 2010.
To be submitted after revision
report number PDS-2010-003
PDS ISSN 1387-2109
Published and produced by: Parallel and Distributed Systems Section Faculty of Information Technology and Systems Department of Technical Mathematics and Informatics Delft University of Technology Zuidplantsoen 4 2628 BZ Delft The Netherlands Information about Parallel and Distributed Systems Report Series:
[email protected] Information about Parallel and Distributed Systems Section: http://pds.ewi.tudelft.nl/
c 2010 Parallel and Distributed Systems Section, Faculty of Information Technology and Systems, Department
of Technical Mathematics and Informatics, Delft University of Technology. All rights reserved. No part of this series may be reproduced in any form or by any means without prior written permission of the publisher.
Abstract Real-world measurements play a key role in studying the characteristics and improving the design of Peer-to-Peer (P2P) systems. Although many P2P measurements have been carried out in the last decade, few traces are publicly accessible, and the available traces are available online in different formats. This situation hampers researchers in exchanging, studying, and reusing existing traces. As a result, many P2P studies have been based on unrealistic assumptions about the characteristics of P2P systems, and many P2P algorithms and methods still lack a realistic evaluation. To address this problem, in this work we introduce the P2P Trace Archive, which we design as a virtual meeting place for the community to exchange P2P traces. First, we design the Trace Archive, including a single, flexible data format for storing anonymized P2P traces. Using the tools we have developed as part of the Archive, we add to the Archive more than 20 traces collected from 12 P2P communities; the traces capture the characteristics of millions of user sessions between 2003 and 2010. Second, we make a comparative analysis of traces in the Archive that focuses on content characteristics, peer arrivals and departures, and peer sharing behavior. We find that the characteristics and usage patterns differ significantly among systems and among communities, and that they change significantly over multi-year intervals. Third, we investigate how different methods for identifying peers and sessions in P2P traces may lead to very different analysis results.
1
Contents 1 Introduction
5
2 Requirements for a P2P Trace Archive
6
3 The P2P Trace Archive 3.1 A Unified Trace Format . . . . . . . . . . . . . . . . . . . . . . . . . . . . . . . . . . . . . . . . . 3.2 The Archive Design . . . . . . . . . . . . . . . . . . . . . . . . . . . . . . . . . . . . . . . . . . .
6 6 7
4 Traces Currently in the Archive 4.1 Community Dataset: SuprNova . . . . . 4.2 Community Dataset: PirateBay . . . . . 4.3 Community Dataset: FileList.org . . . . 4.4 Community Dataset: LegalTorrents.com 4.5 Community Dataset: eTree.org . . . . . 4.6 Community Dataset: tlm-project.org . . 4.7 Community Dataset: transamrit.net . . 4.8 Community Dataset: unix-ag.uni-kl.de . 4.9 Community Dataset: idsoftware.com . . 4.10 Community Dataset: boenielsen.dk . . . 4.11 Community Dataset: alluvion.org . . . . 4.12 Community Dataset: Gnutella . . . . . 4.13 Community Dataset: eDonkey . . . . . 4.14 Community Dataset: PP Live . . . . . . 4.15 Community Dataset: Skype . . . . . . .
. . . . . . . . . . . . . . .
. . . . . . . . . . . . . . .
. . . . . . . . . . . . . . .
. . . . . . . . . . . . . . .
. . . . . . . . . . . . . . .
. . . . . . . . . . . . . . .
. . . . . . . . . . . . . . .
. . . . . . . . . . . . . . .
. . . . . . . . . . . . . . .
. . . . . . . . . . . . . . .
. . . . . . . . . . . . . . .
. . . . . . . . . . . . . . .
. . . . . . . . . . . . . . .
. . . . . . . . . . . . . . .
. . . . . . . . . . . . . . .
. . . . . . . . . . . . . . .
. . . . . . . . . . . . . . .
. . . . . . . . . . . . . . .
. . . . . . . . . . . . . . .
. . . . . . . . . . . . . . .
. . . . . . . . . . . . . . .
. . . . . . . . . . . . . . .
. . . . . . . . . . . . . . .
. . . . . . . . . . . . . . .
. . . . . . . . . . . . . . .
. . . . . . . . . . . . . . .
. . . . . . . . . . . . . . .
. . . . . . . . . . . . . . .
. . . . . . . . . . . . . . .
. . . . . . . . . . . . . . .
. . . . . . . . . . . . . . .
. . . . . . . . . . . . . . .
8 8 8 9 9 10 10 10 11 11 11 11 12 12 12 12
5 A Comparative Trace Analysis 5.1 Content characteristics . . . . 5.2 Peer arrival and departure . . 5.3 Bandwidth characteristics . . 5.4 Peer Sharing Behavior . . . .
. . . .
. . . .
. . . .
. . . .
. . . .
. . . .
. . . .
. . . .
. . . .
. . . .
. . . .
. . . .
. . . .
. . . .
. . . .
. . . .
. . . .
. . . .
. . . .
. . . .
. . . .
. . . .
. . . .
. . . .
. . . .
. . . .
. . . .
. . . .
. . . .
. . . .
. . . .
. . . .
12 12 15 18 22
. . . .
. . . .
. . . .
. . . .
. . . .
. . . .
6 Identifying Peers and Sessions 31 6.1 Peer Identification . . . . . . . . . . . . . . . . . . . . . . . . . . . . . . . . . . . . . . . . . . . . 31 6.2 Session Identification . . . . . . . . . . . . . . . . . . . . . . . . . . . . . . . . . . . . . . . . . . . 34 7 Related Work
36
8 Conclusion and Ongoing Work
39
9 Acknowledgements
39
2
List of Figures 1 2 3 4 5 6 7 8 9 10 11 12 13 14 15 16 17 18 19 20 21 22 23 24 25
CDF of the file size in 6 traces collected between 2003 and 2005 (horizontal axis in logarithmic scale). . . . . . . . . . . . . . . . . . . . . . . . . . . . . . . . . . . . . . . . . . . . . . . . . . . . CDF of the file size in 4 communities measured in 2005 and 2009. . . . . . . . . . . . . . . . . . . CDF of the file popularity in 6 traces collected between 2003 and 2005 (horizontal axis in logarithmic scale). . . . . . . . . . . . . . . . . . . . . . . . . . . . . . . . . . . . . . . . . . . . . . . . CDF of the file popularity in 4 communities measured in 2005 and 2009 (horizontal axis in logarithmic scale). . . . . . . . . . . . . . . . . . . . . . . . . . . . . . . . . . . . . . . . . . . . . CDF of the (hourly) peer arrival rate in 5 traces collected between 2003 and 2005 (horizontal axis in logarithmic scale). . . . . . . . . . . . . . . . . . . . . . . . . . . . . . . . . . . . . . . . . CDF of the (hourly) peer arrival rate in 4 communities measured in 2005 and 2009 (horizontal axis in logarithmic scale). . . . . . . . . . . . . . . . . . . . . . . . . . . . . . . . . . . . . . . . . CDF of the peer session length in 5 traces collected between 2003 and 2005 (horizontal axis in logarithmic scale). . . . . . . . . . . . . . . . . . . . . . . . . . . . . . . . . . . . . . . . . . . . . CDF of the peer session length in 4 traces collected in 2009 (horizontal axis in logarithmic scale). CDF of the peer session length in 4 communities measured in 2005 and 2009 (horizontal axis in logarithmic scale). . . . . . . . . . . . . . . . . . . . . . . . . . . . . . . . . . . . . . . . . . . . . CDF of the peer download speed in 5 traces collected between 2003 and 2005. . . . . . . . . . . . CDF of the peer download speed in 4 communities measured in 2009. . . . . . . . . . . . . . . . Comparison of the peer upload speed distributions in 4 traces collected in 2005 (horizontal axis in logarithmic scale). . . . . . . . . . . . . . . . . . . . . . . . . . . . . . . . . . . . . . . . . . . . Comparison of the peer upload speed distributions in 4 communities measured in 2009 (horizontal axis in logarithmic scale). . . . . . . . . . . . . . . . . . . . . . . . . . . . . . . . . . . . . . . . . CDF of the download completion of traces collected between 2003 and 2005. . . . . . . . . . . . . CDF of the download completion in 4 communities measured in 2005 and 2009. . . . . . . . . . . CDF of the seeding time in 5 traces collected between 2003 and 2005 (horizontal axis in logarithmic scale). . . . . . . . . . . . . . . . . . . . . . . . . . . . . . . . . . . . . . . . . . . . . . . . . . CDF of the seeding time in 4 communities measured in 2009 (horizontal axis in logarithmic scale). CDF of the seeding-after-leeching time in 5 traces collected between 2003 and 2005 (horizontal axis in logarithmic scale). . . . . . . . . . . . . . . . . . . . . . . . . . . . . . . . . . . . . . . . . CDF of the seeding-after-leeching time in 4 communities measured in 2009 (horizontal axis in logarithmic scale). . . . . . . . . . . . . . . . . . . . . . . . . . . . . . . . . . . . . . . . . . . . . CDF of peer arrival rate for various peer identification intervals (horizontal axis in logarithmic scale). . . . . . . . . . . . . . . . . . . . . . . . . . . . . . . . . . . . . . . . . . . . . . . . . . . . CDF of session length resulting for various peer identification intervals (horizontal axis in logarithmic scale). . . . . . . . . . . . . . . . . . . . . . . . . . . . . . . . . . . . . . . . . . . . . . . . CDF of download speed for various peer identification intervals (horizontal axis in logarithmic scale). . . . . . . . . . . . . . . . . . . . . . . . . . . . . . . . . . . . . . . . . . . . . . . . . . . . CDF of peer arrival rate resulting from various session identification intervals (horizontal axis in logarithmic scale). . . . . . . . . . . . . . . . . . . . . . . . . . . . . . . . . . . . . . . . . . . . . CDF of session length resulting from various session identification intervals (horizontal axis in logarithmic scale). . . . . . . . . . . . . . . . . . . . . . . . . . . . . . . . . . . . . . . . . . . . . CDF of download speed resulting from various session identification intervals (horizontal axis in logarithmic scale). . . . . . . . . . . . . . . . . . . . . . . . . . . . . . . . . . . . . . . . . . . . .
3
13 13 16 16 19 19 20 20 21 24 24 25 25 27 27 29 29 32 32 34 34 35 37 37 38
List of Tables 1 2 3 4 5 6 7 8 9 10 11 12 13 14 15 16 17 18 19 20 21 22 23 24 25 26 27 28 29 30 31 32 33 34 35 36 37 38 39 40 41 42
Data format for dynamic peer-level data. . . . . . . . . . . . . Summary of the datasets . . . . . . . . . . . . . . . . . . . . . . File Size Statistics . . . . . . . . . . . . . . . . . . . . . . . . . P-values from KS and AD test for file size distributions. . . . . Parameters of fitting distributions for file size. . . . . . . . . . . File Popularity Statistics . . . . . . . . . . . . . . . . . . . . . . P-values from KS and AD test for file popularity distributions. Parameters of fitting distributions for file popularity. . . . . . . Peer Arrival Rate Statistics . . . . . . . . . . . . . . . . . . . . Peer Arrival Rate Statistics . . . . . . . . . . . . . . . . . . . . Peer Arrival Rate Statistics . . . . . . . . . . . . . . . . . . . . Session Length Statistics . . . . . . . . . . . . . . . . . . . . . . Session Length Statistics . . . . . . . . . . . . . . . . . . . . . . Session Length Statistics . . . . . . . . . . . . . . . . . . . . . . Download Speed Statistics . . . . . . . . . . . . . . . . . . . . . Download Speed Statistics . . . . . . . . . . . . . . . . . . . . . Download Speed Statistics . . . . . . . . . . . . . . . . . . . . . Upload Speed Statistics . . . . . . . . . . . . . . . . . . . . . . Upload Speed Statistics . . . . . . . . . . . . . . . . . . . . . . Upload Speed Statistics . . . . . . . . . . . . . . . . . . . . . . Download Completion Statistics . . . . . . . . . . . . . . . . . . Download Completion Statistics . . . . . . . . . . . . . . . . . . Downlod Completion Statistics . . . . . . . . . . . . . . . . . . Seeding Time Statistics . . . . . . . . . . . . . . . . . . . . . . Seeding Time Statistics . . . . . . . . . . . . . . . . . . . . . . Seeding Time Statistics . . . . . . . . . . . . . . . . . . . . . . Seeding-after-Leeching Time Statistics . . . . . . . . . . . . . . Seeding-after-Leeching Time Statistics . . . . . . . . . . . . . . Seeding-after-Leeching Time Statistics . . . . . . . . . . . . . . Hourly Peer Arrival Rate Statistics . . . . . . . . . . . . . . . . Session Length Statistics . . . . . . . . . . . . . . . . . . . . . . Peer Download Speed Statistics . . . . . . . . . . . . . . . . . . Peer Difference Statistics . . . . . . . . . . . . . . . . . . . . . . Peer Difference Statistics . . . . . . . . . . . . . . . . . . . . . . Peer Difference Statistics . . . . . . . . . . . . . . . . . . . . . . Peer Difference Statistics . . . . . . . . . . . . . . . . . . . . . . Hourly Peer Arrival Rate Statistics . . . . . . . . . . . . . . . . Session Length Statistics . . . . . . . . . . . . . . . . . . . . . . Peer Download Speed Statistics . . . . . . . . . . . . . . . . . . Session Difference Statistics . . . . . . . . . . . . . . . . . . . . Session Difference Statistics . . . . . . . . . . . . . . . . . . . . Session Difference Statistics . . . . . . . . . . . . . . . . . . . .
4
. . . . . . . . . . . . . . . . . . . . . . . . . . . . . . . . . . . . . . . . . .
. . . . . . . . . . . . . . . . . . . . . . . . . . . . . . . . . . . . . . . . . .
. . . . . . . . . . . . . . . . . . . . . . . . . . . . . . . . . . . . . . . . . .
. . . . . . . . . . . . . . . . . . . . . . . . . . . . . . . . . . . . . . . . . .
. . . . . . . . . . . . . . . . . . . . . . . . . . . . . . . . . . . . . . . . . .
. . . . . . . . . . . . . . . . . . . . . . . . . . . . . . . . . . . . . . . . . .
. . . . . . . . . . . . . . . . . . . . . . . . . . . . . . . . . . . . . . . . . .
. . . . . . . . . . . . . . . . . . . . . . . . . . . . . . . . . . . . . . . . . .
. . . . . . . . . . . . . . . . . . . . . . . . . . . . . . . . . . . . . . . . . .
. . . . . . . . . . . . . . . . . . . . . . . . . . . . . . . . . . . . . . . . . .
. . . . . . . . . . . . . . . . . . . . . . . . . . . . . . . . . . . . . . . . . .
. . . . . . . . . . . . . . . . . . . . . . . . . . . . . . . . . . . . . . . . . .
. . . . . . . . . . . . . . . . . . . . . . . . . . . . . . . . . . . . . . . . . .
. . . . . . . . . . . . . . . . . . . . . . . . . . . . . . . . . . . . . . . . . .
. . . . . . . . . . . . . . . . . . . . . . . . . . . . . . . . . . . . . . . . . .
. . . . . . . . . . . . . . . . . . . . . . . . . . . . . . . . . . . . . . . . . .
. . . . . . . . . . . . . . . . . . . . . . . . . . . . . . . . . . . . . . . . . .
. . . . . . . . . . . . . . . . . . . . . . . . . . . . . . . . . . . . . . . . . .
. . . . . . . . . . . . . . . . . . . . . . . . . . . . . . . . . . . . . . . . . .
7 9 14 14 15 15 17 17 18 18 21 22 22 23 23 23 24 26 26 27 28 28 28 30 30 30 31 31 33 33 34 35 35 35 35 36 36 36 37 38 38 38
1
Introduction
Peer-to-Peer (P2P) systems have gained phenomenal popularity in the past few years, and several studies [1, 20] show that P2P applications generate large amounts of Internet traffic. Measurement data collected from real P2P systems are fundamental for gaining solid knowledge and understanding of the usage patterns and the characteristics of these systems. Thus, measurement data are important for the modeling, the design, and the evaluation of P2P systems. Although many P2P measurements have been carried out in the last decade, few measurement results [16, 12, 15] are publicly available, and for these few the data are presented in different formats. This situation makes it difficult for researchers to exchange, study, and reuse existing traces. Furthermore, due to the lack of available datasets, many P2P studies have been based on unrealistic assumptions about the characteristics and usage patterns of P2P systems, and as a consequence, many P2P algorithms and methods still lack a realistic evaluation. Until now, no effort has been put into making existing P2P traces accessible to the research community. To remedy this situation, in this work we present the P2P Trace Archive (P2PTA): a virtual meeting place that facilitates the collection and exchange of P2P traces. In addition, we perform a comparative analysis of many of the traces in the P2PTA. One of the main benefits of building the P2PTA is that the Archive paves the way for comparative studies of P2P systems, which may help researchers to consider various (types of) P2P systems and to capture their overall characteristics simultaneously, and to discover the long-term evolution in the behavior of P2P systems. Such studies may lead to better knowledge of the commonalities and differences in usage patterns in P2P systems, so that it becomes possible to envisage the usage pattern of a new P2P system by looking at those of similar systems. Another important benefit of the P2PTA is that it complements the current model-based approaches with a trace-based approach. In this way, the hidden patterns that exist in real traces of existing P2P systems will be implicitly used to improve the testing and tuning of P2P systems. In this work, we first present the P2P Trace Archive. The main design goal of the Archive is to facilitate and simplify the exchange of P2P traces. To achieve this goal, we design a unified data format to represent traces in the Archive with three main considerations. First, the data format is designed to fully reflect the structure of P2P systems. Secondly, the data format can be easily extended for new traces, and extending the data format will not affect the traces already stored in the Archive. Thirdly, the data format ensures the anonymization of user information in the Archive. With the tools associated with the data format, we add to the Archive more than 20 traces collected from 12 communities, which capture the characteristics of millions of users between 2003 and 2009. Besides the unified data format, the Archive also has several software modules for trace collection, anonymization, and processing, respectively. Secondly, we perform a comparative analysis of traces in the Archive, both across multiple P2P systems and across time. The analysis focuses on content characteristics, peer arrivals and departures, peer bandwidth, and peer sharing behavior, respectively. We find that these characteristics differ significantly in different communities, and some characteristics also change dramatically over the years. This result indicates the need to calibrate P2P models and algorithms with a sufficient number of traces. We also investigate how different ways of identifying peers and sessions in traces in the face of dynamic IP-address reassignment influence the analysis results. Our contribution in this work is threefold: 1. We establish the largest P2P trace archive to date, and adopt a unified data format to represent anonymized traces (Section 3). 2. We conduct a multi-angle comparative trace analysis, and we find that P2P systems differ significantly and evolve rapidly over the years (Section 5). 3. We investigate how different ways of identifying peers and sessions in the face of dynamic IP-address reassignment impacts the results of analyzing P2P traces (Section 6).
5
2
Requirements for a P2P Trace Archive
In this section, we formulate five requirements for building a P2P trace archive. The first three of these are for designing the data format used to include traces in the Archive, while the last two are for building the actual Archive. Requirement 1: Trace Archiving. First, the data format used to include traces in the Archive must reflect as much as possible the structure of P2P systems. Thus, a common set of operational levels must be found across P2P systems. Second, because of the complexity and fast evolution of P2P systems, the format must be flexible and extensible, in order to not only support existing, but also future traces. Finally, existing traces in the Archive should not be affected when the data format is extended for new traces. Requirement 2: Trace Comparison. The data format should ease the process of trace comparison. The data format should organize the traces in such a way that it is straightforward for researchers to compare traces collected from different P2P systems, traces collected from same P2P system but in different years, and traces collected with different measurement techniques. Requirement 3: Trace Processing. First, for privacy and ethical reasons, information that can be used to identify users should be anonymized in the Archive. Previous privacy breaches of AOL [5] and NetFlix [19] indicate that simply anonymizing user names is not enough to preserve privacy, as other relevant information can still be used to identify users. Thus, all user-related information in the Archive must be anonymized thoroughly to ensure user privacy. Furthermore, traces originally represented in other formats must be converted into the trace format without losing useful information. Requirement 4: Trace Using. To facilitate the usage of traces, the Archive should provide a set of tools to extract commonly used properties of P2P traces, such as peer arrival rate and bandwidth. The Archive should also provide tools for generating input to P2P simulators. Requirement 5: Trace Sharing. The Archive must host its traces at a place that is accessible for large numbers of users. The Archive should also allow researchers to rank traces and share use cases of these traces. This information will be considered as feedback on and suggestions for improving the Archive, and will provide other prospective trace users extra information about traces in the Archive, helping them to select the appropriate traces for their research.
3
The P2P Trace Archive
In this section, we present our P2P Trace Archive (P2PTA). We first introduce the data format of the traces, and then we introduce the main software modules in the Archive.
3.1
A Unified Trace Format
In order to simplify the exchange and reuse of traces, we design a unified data format to represent all the traces in the Archive, and this data format is extended from the format proposed in our previous work [26]. We now introduce the main design features of this data format, and also show how this design addresses Requirements 1.-3. formulated in Section 2. To address Requirement 1, in our design the trace data are stored at four different levels, three corresponding each to one of the community, the swarm, and the peer levels, and a fourth level to store data that characterize the interaction between the P2P application and the resources it uses (hard disks, bandwidth, etc.). At each level, we distinguish between static and dynamic data, which are stored separately. As an example, Table 1 shows the format for storing dynamic peer-level data. Each peer event such as starting downloading a file and sending a query message is stored in a record with information identifying the peer, the event type, etc. and one or more data fields. In our experience, three values for each event type are enough for all the traces in the Archive. We keep a separate event mapping table that records for every event type its ID and additional information about the event type. In this way, new event types can be easily added by adding new entries 6
into the event mapping table without affecting existing traces in the Archive, which also addresses one part of Requirement 3 of Section 2. Static information like file names and sizes are stored in a similar format, without a time stamp. To address Requirement 2 of Section 2, in our design we distinguish between traces and community datasets. A trace is the result of a single measurement collected from a P2P community. A community dataset is a set of traces collected from the same P2P community by possibly different authors, in different years, and with different measurement techniques. Traces in a community dataset are further grouped by the year when they were collected and by the measurement techniques used to collect them. This design simplifies the study of characteristics of different systems (by comparing different community datasets), the study of the evolution of P2P systems (by comparing traces collected in different years in one community dataset), and also the study of measurement techniques (by comparing traces within one community dataset but collected with different measurement techniques.) To address Requirement 3 of Section 2, in our design we employ user mapping tables, one per trace, to store the relationships between information identifying users (e.g., IP address) and integer user identifiers generated by tools in the Archive. When the user mapping table for a converted dataset is not made public, this approach effectively anonymizes the traces, with the notable drawback of loosing information (e.g., (approximate) geographical location). When converting a trace into our format, all event types in the original trace should first be identified and added to the corresponding event mapping table, and then the data related to actual events are stored in the records for dynamic and static data, respectively. Since the unique identifiers in the mapping tables are stored as integral values, the mapping tables greatly reduce the storage requirements and significantly increase the speed of processing the stored data, especially for dynamic data. Another benefit of using event mapping tables is that the research community can work together to establish such tables with generic event types of the systems, which will further simplify the trace comparison process. Furthermore, since the data volume of most P2P traces is large, the Archives trace format is designed to include initially only the minimal amount of information needed to reproduce accurately the original trace. However, through its extensibility features our format can also store information derived through intensive computation, thus reducing the trace processing efforts of the Archive users. ID 1 2
Field Time Stamp Swarm ID
3
Peer ID
4
Event ID
5
iVal
6 7
fVal sVal
Description Timestamp when data are collected (only for dynamic data) Unique identifier of the swarm or the group the measured peer belongs to Unique identifier of the measured peer Unique identifier of peer event type The integer value of the peer event The float value of the peer event The string value of the peer event
Table 1: Data format for dynamic peer-level data.
3.2
The Archive Design
We envision three main roles for P2PTA members. The contributor is the legal owner of P2P traces, and agrees to offer these traces to the Archive. The archive administrator manages the operation of the P2PTA and helps 7
contributors to add and convert traces. The trace user uses the traces in the Archive for their research but does not own these traces. We now introduce the main software modules in the P2PTA—collectively, they make the P2PTA meet Requirements 4 and 5 of Section 2. The trace collection module is responsible for collecting traces from contributors. If the collected trace is already anonymized by the contributor, it will be converted into the unified trace format directly by the trace conversion module. Otherwise, the trace will be anonymized by the trace anonymization module, and mapping tables for user relevant information will be sent back to the trace contributor but will not be included in the Archive. The trace processing module provides basic functions to extract common features of P2P systems, like peer bandwidth and content popularity, and the simulator module is designed for generating input for simulators. Both these modules are open to the research community, so that they can be improved by the community for future research. We also invite the community to contribute tools for complex trace analysis to the Archive. Finally, the trace sharing module is responsible for hosting the traces in the Archive and providing space for users to rank and comment on traces.
4
Traces Currently in the Archive
In this section we present the traces included in the Archive—currently more than 20 heterogeneous traces collected from the BitTorrent, the Gnutella, and the eDonkey P2P systems by various researchers. In particular, the Archive includes a rich collection of traces taken from BitTorrent, one of the most popular file-sharing systems. From the community perspective, the BitTorrent traces focus on communities with either general or very specific types of content, and communities that are accessible either to everyone or that are only open to a small number of users and adopt sharing-ratio enforcement. From the community size perspective, these traces have been collected from the largest communities in the world at the time of the data collection down to small communities, both in terms of number of users and number of shared files. Table II gives an overview of all the traces in the P2PTA; many of these traces have not been analyzed before. Besides including traces that we have collected ourselves in the Archive, we have also converted traces collected by others, such as the community dataset eDonkey (T13’03 and T13’04) [12, 17], the trace T5’05 (small) [4], and the trace T11’03 [16]. The trace T12’04 is a subset of the Gnutella trace collected by [15]; because of time constraints, we currently only include data of 10 out of the 56 days of the trace collected in the original measurement, but we plan to include the rest of the data in the Archive in the near future.Below, we describe three community datasets in some detail.
4.1
Community Dataset: SuprNova
Trace (1): T1’03 This trace was collected from SuprNova during the period between 2003 and 2004, and it was first studied by [21]. SuprNova was the biggest BitTorrent community at that time and it distributed various types of contents. This trace contains detailed peer level data, which was collected from 12 big swarms during the period between Dec 6, 2003 and Jan 17, 2004, with a sampling interval of 2.5 minutes; in total, 28,423,470 sessions were captured. In this trace, peer’s IP address, port number, download progress (number of downloaded chunks), and error messages are recorded.
4.2
Community Dataset: PirateBay
Trace (1): T2’04 This trace was collected from the ThePirateBay during the period between 05 May 2005 and 11 May 2005, and it was first studied by [13]. ThePiratecommunity distributes vary types of contents. The trace contains peer level data. which was collected from 4,000 swarms with sampling interval of 2.5 minutes, and in total 35,881,338 8
ID T1’03 T2’05 T3’05 T4’05 T4’09 T5’05 T5’05 (small) T5’10 T6’05 T6’09 T7’05 T7’09 T8’05 T8’09 T9’05 T9’09 T10’05 T11’03 T12’04 T13’03 T13’04 T14’07 T15’07
Trace description (content type) SuprNova, (general) ThePirateBay, (general) FileList.org, (general) LegalTorrents.com (General) eTree.org collected by [4] (Recorded events & meetings) tlm-project.org (Linux OS) transamrit.net (Slackware OS) unix-ag.uni-kl.de (Knoppix OS) zerowing.idsoftware.com (Game demos) boegenielsen.dk (Knoppix OS) alluvion.org, (general) [16] Gnutella, (general) eDonkey (general) PPLive (Streaming & VoD) Skype (VoIP)
Period 06 Dec 2003 to 17 Jan 2004 05-11 May 2005 14 Dec 2005 until 4 Apr 2006 22 Mar to 19 Jul 2005 24 Sep 2009 to Feb 2010 22 Mar to 19 Jul 2005 Mar 2004 24 Sep 2009 to Feb 2010 22 Mar to 30 Apr 2005 24 Sep 2009 to Feb 2010 22 Mar to 19 Jul 2005 24 Sep 2009 to Feb 2010 22 Mar to 19 Jul 2005 24 Sep 2009 to Feb 2010 22 Mar to 19 Jul 2005 24 Sep 2009 to Feb 2010 22 Mar to 19 Jul 2005 Oct 27 2003 to Jan 16 2004 Mar 19 2004 to Mar 28 2004 Oct 14 2003 to Oct 16 2003 Dec 9 2003 to Feb 2 2004 Jan 2007 Sep 2005
Sampling 2.5 min 2.5 min 6 min 5 min 5 min 15 min 30 min 15 min 10 min 10 min 5 min 5 min 5 min 5 min 5 min 5 min 5 min 30 min n/a n/a n/a 10 min 30 min
Files 120 4,800 3,000 41 183 52 1,505 45 264 74 14 60 11 12 13 37 15 1,476 2,896,885 1,282,420 23,965,651 n/a n/a
Sessions 28,423,470 35,881,338 2,172,738 n/a n/a 165,168 81,584 169,768 149,071 21,529 130,253 61,011 279,323 160,522 48,271 14,697 36,391 173,532 n/a n/a n/a 67,051 29,218
Traffic n/a 12 PB/year n/a 698 GB/day 1.1 TB/day 9 GB/day n/a 143 GB/day 735 GB/day 15 GB/day 258 GB/day 840 GB/day 493 GB/day 348 GB/day 19 GB/day 12 GB/day 308 GB/day n/a n/a n/a n/a n/a n/a
Table 2: Summary of the traces in the P2PTA. sessions were captured, which contains peers’ IP address, port number, client ID, download progress (number of downloaded chunks), and error messages. The estimated annual throughput of this community during that period is 12 PB.
4.3
Community Dataset: FileList.org
Trace (1): T3’05 The trace T3’06 was collected from Filelist.org during the period from Dec 14, 2005 until Apr 4, 2006, and it was first studied by [22]. FileList.org is a private BitTorrent community that distributes various types of contents. This community adopts a sharing-ratio enforcement scheme and removes users who do not actively contribute to the community, which is its main difference from most other BitTorrent communities represented in the Archive. This trace contains data collected from 3,000 swarms this community, and in each swarm peer’s ID, download and upload amount, download and upload speed, connectivity, and connected time are recorded, which captures 2,172,738 sessions. At the time when this trace was collected, the FileList.org community had around 110,000 members.
4.4
Community Dataset: LegalTorrents.com
Traces (2): T4’05, T4’09 T3’05 was collected from the LegalTorrents.com during the period between 22 Mar 2005 and 17 Jul 2005, and T3’09 has been collected from this community since 24 Sep 2009 with 5 minute sampling interval. This community mainly distributes general types of contents. Both datasets only contain community-level data, which is the number of leechers and seeders, total number of completed downloads and traffic of each swarm. And both datasets contain descriptive information of measured torrents including file name, added time, file size, number of files in each torrent and description.
9
In 2005, 41 swarms were measured and the daily throughput of this community was 698 GB traffic. In 2009, 183 swarms until now are measured and the daily throughput of this community is 1.1 TB traffic.
4.5
Community Dataset: eTree.org
Traces (3): T5’05, T5’05(small), T5’09 T5’05 was collected from etree.org during the period between 22 Mar 2005 and 17 Jul 2005, T5’09 has been colloected from this community since 24 Sep 2009 with 15 minute sampling interval, and T5’05(small) was collected in a 10-day duration in 2005 May with 30 minutes sampling interval. Both of T5’05 and T5’09 are collected by the PDS group of TU Delft, and T5’05(small) was collected by [4]. This community mainly distributes recorded events and only provides legal contents. Both datasets only contain swarm level data, which is peer’s ip address with last byte blinded, client type, port number, download amount, upload amount, connected time, sharing ratio, download progress, download speed and upload speed of in each swarm. And both datasets contain descriptive information of measured torrents including file name, infohash, added time, file size, number of files in each torrent and torrent description. In 2005, 165,168 sessions in 52 swarms were measured and the daily throughput of this community was 9 GB. In 2009, until now 169,768 sessions in 45 swarms are measured and the daily throughput of this community is 143 GB traffic.
4.6
Community Dataset: tlm-project.org
Traces (2): T6’05, T6’09 T6’05 was collected from tlm-project.org during the period between 22 Mar 2005 and 30 Apr 2005, and T6’09 has been collected from this community since 24 Sep 2009 with 10 minute sampling interval. This community mainly distributes various linux distributions and only provides legal contents. Both datasets contain community level and swarm level data: community level data contains the number of leechers and seeders, total number of completed downloads and traffic of each measured swarm; peer level data contains peer’s ip address with last byte blinded, port number, download amount, upload amount, download progress, connected time, sharing ratio in each swarm, and T5’09 also includes peer’s download and upload speed. And both datasets contain descriptive information of torrents including file name, infohash, added time, file size, number of files in each torrent. In 2005, 149,071 sessions in 264 swarms were measured and the daily throughput of this community was 735 GB. In 2009, until now 21,529 sessions in 74 torrents are measured and the daily throughput of this community is 15 GB.
4.7
Community Dataset: transamrit.net
Traces (2): T7’05, T7’09 T7’05 was collected from the transamrit.net during the period between 22 Mar 2005 and 19 Jul 2005, and T7’09 has been collected from this community since 24 Sep 2009 with 5 minute sampling interval. This community mainly distributes Slackware linux distributions and only provides legal contents. Both datasets contain community level and swarm level data: community level data contains the number of leechers and seeders, total number of completed downloads and traffic of each measured swarm; peer level data contains ip address with last byte blinded, port number, download amount, upload amount, connected time, sharing ratio, download progress, download speed and upload speed in each measured swarm. And both datasets contain descriptive information of torrents including file name, infohash, added time, file size and number of files in each torrent. In 2005, 130,253 sessions in 14 swarms were measured and the daily throughput of this community was 258 GB. In 2009, until now 61,011 sessions in 60 swarms are measured and the daily throughput of this community
10
is 840 GB.
4.8
Community Dataset: unix-ag.uni-kl.de
Traces (2): T8’05, T8’09 T8’05 was collected from unix-ag.uni-kl.de during the period between 22 Mar 2005 and 19 Jul 2005, and T8’09 has been collected from this community since 24 Sep 2009 with 5 minute sampling interval. This community mainly distributes Knoppix linux distributions and only provides legal contents. Both datasets contain community level and swarm level data: community level data contains the number of leechers and seeders, total number of completed downloads, total traffic and average download progress of all participating peers of each swarm; peer level data contains peer’s ip address with last byte blinded, port number, download amount, upload amount, connected time, sharing ratio, download progress, download speed and upload speed in each measured swarm. And both datasets contain descriptive information of torrents including file name, infohash, added time, file size and number of files in each torrent. In 2005, 279,323 sessions in 11 swarms were measured and the daily throughput of this community was 493 GB. In 2009, until now 160,522 sessions in 12 swarms are measured and the daily throughput of this community is 348 GB.
4.9
Community Dataset: idsoftware.com
Traces (2): T9’05, T9’09 T9’05 was collected from idsoftware.com during the period between 22 Mar 2005 and 19 Jul 2005, and T9’09 has been collected from this community since 24 Sep 2009 with 5 minute sampling interval. This community distributes demos of games from id Software and only provides legal contents. Both datasets contain community level and swarm level data: community level data contains the number of leechers and seeders in each swarm: peer level data contains peer’s ip address with last byte blinded, port number, download amount, upload amount, connected time, download progress and sharing ratio in each measured swarm. And both datasets contain descriptive information of torrents including file name, infohash, added time, file size and number of files in each torrent. In 2005, 48,271 sessions in 13 swarms were measured and the daily throughput of this community was 19 GB. In 2009, until now 14,697 sessions in 37 swarms are measured and the daily throughput of this community is 12 GB.
4.10
Community Dataset: boenielsen.dk
Datasets (2): T10’05 T10’05 was collected from boegenielsen.dk during the period between 22 Mar 2005 and 19 Jul 2005 with 5 minute sampling interval. This community mainly distributed Knoppix linux distributions and only provided legal contents. The dataset contains community level and swarm level data: community level data contains the number of leechers and seeders, total number of completed downloads, total traffic and average download progress of all peers of each swarm: peer level data contains peer’s ip address with last byte blinded, port number, download amount, upload amount, connected time, download progress and sharing ratio in measured swarms. And the dataset also contains descriptive information of torrents including file name, infohash, added time, file size and number of files in each torrent. In 2005, 36,391 sessions in 15 swarms were measured and the daily throughput of this community was 308 GB.
4.11
Community Dataset: alluvion.org
Trace (1):
T11’03 11
The trace T11’03 was collected from alluvion.org during the period from Dec 14, 2005 until Apr 4, 2006, and it was collected by [16]. Alluvion.org is a BitTorrent tracker for users of the Something Awful forums. SA members can upload torrents and anyone can download them. This trace contains data collected from 1,476 swarms in this community, and in each swarm peer’s ID, download and upload amount, download and upload speed, connectivity, and connected time are recorded, which captures 173,532 sessions.
4.12
Community Dataset: Gnutella
Trace (1): T12’04 The trace T12’04 is a subset of the Gnutella trace collected by [15]; because of time constraints, we currently only include data of 10 out of the 56 days of the trace collected in the original measurement, but we plan to include the rest of the data in the Archive in the near future.
4.13
Community Dataset: eDonkey
Trace (2): T13’03, T13’04 Trace T13’03 and T13’04 were collected by [12, 17] in 14-16 october 2003 and 09 december 2003 - 02 february 2004, respectively. These traces were collected from a fake client, connecting to other clients, and asking for their lists of files.
4.14
Community Dataset: PP Live
Trace: T14’07 The trace T14’07 was collected and studied by [24] in 2007 by taking snapshot of PP Live network. The measurement was conducted in two video channels on PP Live for one day, with 10 minute sampling interval. As a result, 67,051 sessions were collected.
4.15
Community Dataset: Skype
Trace: T15’05 The trace T15’05 was collected and studied by [11] in 2005 by pinging the super nodes in Skype network. With 30 minute sampling interval, 29,218 sessions were collected.
5
A Comparative Trace Analysis
In this section, we present a comparative analysis of the traces currently in the Archive. Our analysis focuses on content characteristics, peer arrivals and departures, peer bandwidth, and peer sharing behavior, respectively. We show how these characteristics differ across P2P communities and evolve over the years. In the analysis results, IQR stands for the Inter-Quartile Range of a stochastic variable.
5.1
Content characteristics
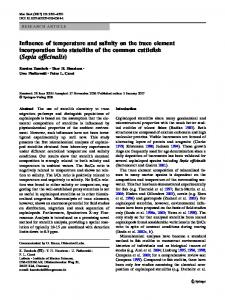
The size and the popularity of content distributed in P2P systems are basic properties to characterize these systems. We find that the content size distributions differ significantly in P2P communities. In Gnutella and eDonkey, more than 70% of the file sizes are less than 10 MB. In contrast, most of the files distributed in most of the BitTorrent communities are much larger, as shown in Figure 1. We also notice that in some communities, the file size distribution changes dramatically over time and the evolution trend is different among communities: Most of the files distributed in LegalTorrents (T4’05,’09) in 2009 were smaller than in 2005, while most of the files in eTree (T5’05,’09) and id Software (T9’05,’09) were larger in 2009 than in 2005; the file size distribution 12
1
0.8
BitTorrent
CDF
0.6
IQR Gnutella
0.4
T3’05 T6’05 T11’05 T12’04 T13’04
0.2 eDonkey 0 0.1
1
10
100
1000
10000
File Size (MB)
CDF
1 0.8 0.6 0.4 0.2 0
CDF
Figure 1: CDF of the file size in 6 traces collected between 2003 and 2005 (horizontal axis in logarithmic scale).
1 0.8 0.6 0.4 0.2 0
1 0.8 0.6 0.4 0.2 0
T4’05 T4’09 0
300
600
900
1200
300
600
0
300
1 0.8 0.6 0.4 0.2 0
T6’05 T6’09 0
T5’05 T5’09
900
1200
File Size (MB)
600
900
1200
900
1200
T9’05 T9’09 0
300
600
File Size (MB)
Figure 2: CDF of the file size in 4 communities measured in 2005 and 2009. of tlm-project (T6’05,’09) remained almost unchanged between 2005 and 2009, as shown in Figure 2. Statistics of the file size in the traces analyzed in this section further support this finding, as shown in Table 3. The file size distributions of most traces can be fit with either Weibull, Log-Normal, or Gamma distributions, but only the file size distribution of eDonkey (T13) can be fit with Pareto distribution, as shown in Table 4. Table 5 shows the parameters for each fitting distributions. We also find that the file popularity distributions are very different in P2P communities. Files distributed in most BitTorrent communities are requested by thousands of peers. In contrast more than 80% of the files in eDonkey and Gnutella are owned or requested by less than 10 peers, as shown in Figure 3. Similar to file size distribution, the file popularity distributions change significantly over time in some communities, and again its evolution trend is not same among communities. Many of the files distributed in tlm-project (T6’05,’09) and unix-ag.uni-kl (T8’05,’09) were requested by much fewer peers in 2009 than in 2005, some of the files in id Software (T9’05,’09) were requested by more peers in 2009 than in 2005, and the file popularity distribution in transamrit (T7’05,’09) remained almost unchanged between 2005 and 2009, as shown in Figure 4. Statistics of the file popularity in the traces analyzed in this section further support this finding, as shown in Table 6.
13
Trace T3’05 T4’05 T4’10 T5’05 T5’09 T6’05 T6’09 T9’05 T9’09 T11’03 T12’04 T13’04
Max 17,963 1,010 10,032 1,955 18,200 3,205 2,079 463 745 9,953 4,096 4,096
Mean 1,053 492 303 793 6,648 410 411 129 285 702 14 76
StDev 1,344 247 807 322 7,175 329 333 168 212 879 70 205
Q1 349 329 39 656 790 92 135 8 103 186 3 0
Median 604 434 80 824 1,087 439 390 17 248 672 4 3
Q3 1,212 700 219 937 15,682 644 667 258 446 716 5 8
IQR 863 371 180 281 14,891 552 532 250 343 530 3 8
Table 3: File Size Statistics (MB).
Trace T1’03 T2’05 T3’05 T4’05 T4’09 T5’05 T5’05(s) T5’09 T6’05 T6’09 T7’05 T7’09 T8’05 T8’09 T9’05 T9’09 T10’05 T11’03 T12’04 T13’03 T13’04
Exponential 0.003 0.253 0.120 0.739 0.094 0.321 0.026 0.252 0.014 0.099 0.007 0.069 0.013 0.053 0.000 0.087 0.116 0.326 0.193 0.406 0.000 0.015 0.000 0.044 0.000 0.083 0.003 0.314 0.000 0.221 0.240 0.645 0.000 0.018 0.220 0.481 0.000 0.003 0.000 0.000 0.000 0.000
Weibull 0.094 0.715 0.093 0.739 0.121 0.344 0.257 0.630 0.198 0.435 0.211 0.579 0.363 0.495 0.005 0.187 0.108 0.304 0.207 0.414 0.214 0.723 0.000 0.056 0.056 0.754 0.000 0.335 0.013 0.445 0.210 0.680 0.002 0.324 0.209 0.492 0.015 0.104 0.215 0.494 0.216 0.503
Pareto 0.000 0.000 0.000 0.036 0.000 0.000 0.000 0.000 0.000 0.000 0.000 0.000 0.000 0.000 0.000 0.001 0.000 0.000 0.000 0.000 0.000 0.000 0.000 0.000 0.000 0.000 0.000 0.000 0.000 0.018 0.000 0.000 0.000 0.000 0.000 0.000 0.000 0.000 0.009 0.053 0.009 0.053
Log-Normal 0.040 0.633 0.108 0.732 0.177 0.487 0.074 0.307 0.340 0.579 0.122 0.514 0.348 0.514 0.007 0.216 0.086 0.269 0.167 0.409 0.114 0.633 0.000 0.056 0.033 0.720 0.000 0.296 0.024 0.524 0.258 0.666 0.002 0.255 0.139 0.367 0.015 0.106 0.173 0.469 0.221 0.510
Gamma 0.057 0.669 0.087 0.752 0.089 0.319 0.245 0.578 0.129 0.330 0.165 0.555 0.427 0.565 0.005 0.190 0.112 0.303 0.203 0.418 0.117 0.648 0.000 0.060 0.031 0.721 0.000 0.298 0.012 0.452 0.221 0.677 0.002 0.302 0.212 0.490 0.004 0.051 0.083 0.297 0.081 0.284
Table 4: P-values from KS and AD test for file size distributions.
14
Trace T1’03 T2’05 T3’05 T4’05 T4’09 T5’05 T5’05(s) T5’09 T6’05 T6’09 T7’05 T7’09 T8’05 T8’09 T9’05 T9’09 T10’05 T11’03 T12’04 T13’03 T13’04
Exp(µ) 1767.71 1.05 1056.93 492.48 308.58 793.34 743.04 6647.98 409.94 411.36 649.59 1112.78 693.72 1865.59 138.58 285.24 653.34 702.33 13.98 63.26 76.11
Wbl(κ, λ) 1977.07 2.90 1.11 1.14 1015.81 0.93 546.36 1.91 200.68 0.65 891.80 2.59 837.43 2.01 5540.23 0.74 431.04 1.17 440.61 1.24 655.85 65.71 1207.79 1.23 696.24 174.38 2011.65 1.24 96.61 0.62 309.23 1.31 682.51 14.42 675.70 0.92 6.62 0.59 8.21 0.32 9.04 0.31
Pareto -1.09 3422.23 -0.03 1.09 0.27 777.97 -0.95 964.90 0.74 102.14 -0.57 1139.92 -0.19 848.74 0.88 2603.20 -0.09 442.90 -0.14 466.01 -1.69 1126.39 0.01 1103.58 -1.47 1026.86 -1.10 4684.01 1.37 28.10 -0.58 466.53 -1.72 1205.29 0.11 618.93 0.48 4.16 3.80 0.23 3.93 0.21
LogN(µ, σ) 7.38 0.52 -0.38 0.98 6.38 1.07 5.97 1.00 4.55 1.50 6.58 0.47 6.49 0.53 7.87 1.49 5.54 1.19 5.62 1.01 6.48 0.02 6.73 0.65 6.54 0.01 7.17 0.85 3.68 1.81 5.28 1.00 6.47 0.13 5.89 1.47 1.10 1.88 0.36 3.70 0.43 3.71
Gam(κ, λ) 5.14 343.79 1.31 0.81 1.00 1061.88 2.29 215.09 0.53 581.47 5.37 147.72 4.19 177.34 0.65 10163.75 1.19 344.59 1.39 295.48 1972.54 0.33 1.90 584.68 15388.67 0.05 1.52 1223.75 0.51 272.86 1.50 189.92 67.76 9.64 0.88 794.92 0.42 32.94 0.20 324.08 0.19 400.49
Table 5: Parameters of fitting distributions for file size. Table 7 and Table 8 shows the significance values from GOF test and parameters of fitting distributions for file popularity, respectively.
5.2
Peer arrival and departure
The peer arrival rate is one of the key elements to model churn in P2P networks, and we find that it differs significantly across P2P communities. The peer arrival rate in SuprNova (T1’03) can reach a few thousand per hour, while in alluvion (T11’04) it is less than 10 peers per hour most of the time, as shown in Figure 5. When comparing the peer arrival rate of the same communities in different years, we do not find significant differences in most communities, except that in trasamrit (T7’05, ’09) for most of the time the peer arrival rate was lower in 2009 than 2005, as shown in Figure 6. Statistics of the peer arrival rate in the traces analyzed in this section are shown in Table 9. Trace T2’05 T3’05 T6’05 T6’09 T7’05 T7’09 T8’05 T8’09 T9’05 T9’09 T11’04 T12’04 T13’04
Max 9,951 13,618 8,553 30,162 49,199 90,485 129,978 227,098 23,493 9,725 2,364 9,011 5,533
Mean 441 709 576 634 9,304 7,892 25,393 19,640 3,448 2,811 114 2 2
StDev 751 1,253 1,295 3,124 15,873 21,595 35,039 42,038 5,917 2,728 198 14 11
Q1 8 73 28 2 166 176 5,794 57 360 925 15 1 1
Median 36 245 114 8 290 427 10,784 4,505 1,445 1,289 50 1 1
Q3 691 783 420 40 13,374 6,470 27,579 19,902 3,411 4,539 124 1 2
IQR 683 710 392 38 13,209 6,294 21,785 19,845 3,051 3,614 109 0 1
Table 6: File Popularity Statistics (number of requests per file).
15
1
0.8
CDF
0.6 IQR 0.4
T3’05 T6’05 T11’05 T12’04 T13’04
0.2
0 1
10
100
1000
10000
File Popularity
CDF
CDF
Figure 3: CDF of the file popularity in 6 traces collected between 2003 and 2005 (horizontal axis in logarithmic scale). 1 0.8 0.6 0.4 T6’05 0.2 T6’09 0 0 1 10 10 102 103 104 1 T8’05 0.8 T8’09 0.6 0.4 0.2 0 100 101 102 103 104 105 File Popularity
1 0.8 0.6 0.4 0.2 0 100 1 0.8 0.6 0.4 0.2 0 100
T7’05 T7’09
101
102
103
104
T9’05 T9’09
101
102 103 File Popularity
104
Figure 4: CDF of the file popularity in 4 communities measured in 2005 and 2009 (horizontal axis in logarithmic scale).
16
Trace T1’03 T2’05 T3’05 T5’05 T5’05(s) T5’09 T6’05 T6’09 T7’05 T7’09 T8’05 T8’09 T9’05 T9’09 T10’05 T11’03 T12’04 T13’03 T13’04
Exponential 0.138 0.716 0.002 0.071 0.100 0.203 0.042 0.182 0.218 0.402 0.153 0.417 0.008 0.041 0.000 0.001 0.000 0.046 0.000 0.034 0.136 0.639 0.004 0.078 0.063 0.418 0.076 0.407 0.000 0.060 0.167 0.306 0.000 0.440 0.000 0.525 0.001 0.485
Weibull 0.126 0.704 0.104 0.377 0.471 0.595 0.332 0.619 0.455 0.582 0.224 0.455 0.433 0.576 0.047 0.329 0.070 0.591 0.137 0.656 0.171 0.678 0.123 0.552 0.308 0.741 0.078 0.415 0.196 0.656 0.472 0.610 0.000 0.451 0.000 0.567 0.000 0.488
Pareto 0.000 0.000 0.000 0.017 0.000 0.003 0.006 0.042 0.000 0.003 0.000 0.000 0.001 0.010 0.002 0.263 0.003 0.108 0.001 0.065 0.000 0.016 0.001 0.045 0.002 0.058 0.000 0.000 0.006 0.223 0.000 0.004 0.000 0.362 0.000 0.300 0.000 0.316
Log-Normal 0.119 0.671 0.117 0.398 0.453 0.606 0.206 0.552 0.473 0.656 0.404 0.620 0.485 0.642 0.268 0.510 0.122 0.665 0.192 0.686 0.161 0.723 0.099 0.519 0.236 0.722 0.094 0.515 0.235 0.703 0.388 0.600 0.000 0.651 0.000 0.736 0.003 0.690
Gamma 0.132 0.711 0.116 0.381 0.429 0.542 0.334 0.603 0.379 0.521 0.258 0.501 0.278 0.430 0.008 0.071 0.044 0.499 0.083 0.489 0.158 0.654 0.194 0.541 0.264 0.671 0.064 0.418 0.107 0.583 0.424 0.555 0.000 0.436 0.000 0.675 0.002 0.484
Table 7: P-values from KS and AD test for file popularity distributions.
Trace T1’03 T2’05 T3’05 T5’05 T5’05(s) T5’09 T6’05 T6’09 T7’05 T7’09 T8’05 T8’09 T9’05 T9’09 T10’05 T11’03 T12’04 T13’03 T13’04
Exp(µ) 32458.00 441.22 709.12 3514.23 51.34 7435.00 575.57 634.22 9303.86 7892.19 25393.09 19640.38 3448.00 2810.50 2599.43 113.57 2.17 1.48 2.54
Wbl(κ, λ) 33880.10 1.13 212.61 0.48 508.32 0.66 2083.22 0.54 42.44 0.77 7876.55 1.15 290.42 0.53 46.14 0.34 2738.32 0.39 2061.94 0.40 22634.27 0.83 5839.71 0.37 2280.77 0.60 2937.25 1.11 789.10 0.39 85.30 0.68 1.81 0.84 1.61 1.22 2.26 0.88
Pareto -0.30 43056.37 2.25 25.92 0.75 275.49 1.12 877.53 0.46 28.59 0.05 7049.89 1.28 94.18 2.01 5.54 2.56 225.11 2.00 323.77 0.37 16439.22 3.94 130.40 0.80 1241.14 -0.06 2974.18 2.93 48.61 0.60 53.28 0.21 1.35 0.04 1.40 0.22 1.72
LogN(µ, σ) 9.91 1.22 4.20 2.31 5.40 1.72 6.57 2.31 3.08 1.36 8.55 0.81 4.68 2.02 2.51 2.42 6.53 2.84 6.31 2.81 9.39 1.36 7.10 3.29 6.78 2.14 7.52 0.91 5.26 2.96 3.65 1.68 0.22 0.61 0.20 0.46 0.41 0.71
Gam(κ, λ) 1.19 27326.07 0.36 1242.71 0.54 1311.33 0.41 8531.34 0.70 73.34 1.53 4863.84 0.39 1463.51 0.19 3365.89 0.27 34590.87 0.26 29848.23 0.79 32039.18 0.25 77191.58 0.47 7318.12 1.32 2122.07 0.27 9648.87 0.57 198.31 1.03 2.10 2.84 0.52 1.10 2.31
Table 8: Parameters of fitting distributions for file popularity.
17
Trace T1’03 T3’05 T5’05 T5’09 T6’09 T7’05 T7’09 T11’04 T8’05 T8’09 T9’05 T9’09
Max 2,614 4,503 29 315 83 321 516 477 681 430 44 36
Mean 83 12 5 10 3 13 10 2 17 16 3 2
StDev 132 30 3 15 4 12 19 4 29 22 3 2
Q1 23 2 3 3 1 2 1 1 2 3 1 1
Median 51 5 4 5 2 10 3 1 6 7 2 2
Q3 86 12 5 11 4 20 6 3 14 17 4 3
IQR 63 10 2 8 3 18 5 2 12 14 3 2
Table 9: Peer Arrival Rate Statistics (number of peers per hour). Trace T1’03 T2’05 T3’05 T5’05 T5’05(s) T5’09 T6’05 T6’09 T7’05 T7’09 T8’05 T8’09 T9’05 T9’09 T10’05 T11’03 T14’07(1) T15’07
Exponential 0.347 0.524 0.394 0.636 0.118 0.416 0.014 0.445 0.000 0.606 0.341 0.609 0.002 0.682 0.021 0.691 0.275 0.637 0.013 0.287 0.057 0.311 0.222 0.528 0.019 0.697 0.001 0.640 0.197 0.675 0.001 0.638 0.233 0.452 0.018 0.111
Weibull 0.393 0.567 0.393 0.642 0.250 0.588 0.038 0.719 0.000 0.639 0.346 0.623 0.012 0.670 0.050 0.682 0.275 0.644 0.080 0.517 0.237 0.541 0.334 0.599 0.064 0.688 0.043 0.723 0.211 0.678 0.004 0.647 0.278 0.627 0.120 0.235
Pareto 0.000 0.000 0.000 0.005 0.000 0.059 0.000 0.016 0.000 0.309 0.000 0.016 0.000 0.185 0.000 0.119 0.000 0.003 0.000 0.107 0.000 0.038 0.000 0.010 0.000 0.109 0.000 0.117 0.000 0.052 0.000 0.214 0.000 0.000 0.000 0.000
Log-Normal 0.371 0.606 0.438 0.713 0.350 0.670 0.041 0.728 0.002 0.720 0.348 0.705 0.025 0.725 0.077 0.729 0.165 0.545 0.198 0.583 0.363 0.627 0.439 0.685 0.082 0.735 0.036 0.774 0.190 0.719 0.016 0.716 0.205 0.556 0.452 0.610
Gamma 0.361 0.539 0.386 0.623 0.236 0.496 0.039 0.744 0.002 0.672 0.340 0.608 0.025 0.686 0.072 0.685 0.281 0.649 0.060 0.426 0.191 0.457 0.301 0.565 0.091 0.700 0.059 0.759 0.231 0.682 0.014 0.640 0.247 0.594 0.334 0.475
Table 10: P-values from KS and AD test for arrival rate distributions. Table 10 and Table 11 shows the significance values from GOF test and parameters of fitting distributions for peer arrival rate, respectively. Session length is another important element to model churn in P2P systems. We find that the session length distributions are very different in communities of different types, as shown in Figure 7. We also find that the session length distributions in communities of similar types are very close, as shown in Figure 8. Furthermore, the session length distribution does not change dramatically within one community over the years, as shown in Figure [?]. This result suggests a possible correlation between the session length distribution and the community type. Statistics of the session length in the traces analyzed in this section are shown in Table 12. Table 13 and Table 14 shows the significance values from GOF test and parameters of fitting distributions for session length, respectively.
5.3
Bandwidth characteristics
Bandwidth is one of the most frequently investigated properties in empirical P2P studies, as it is closely related to the service capacity of P2P systems. We find that the peer download speed differs significantly across P2P communities, and that the download speed has increased differently over the years in all measured communities, as shown in Figures 10 and 11, respectively. Statistics of the peer download speed in the traces analyzed in this 18
1
0.8
CDF
0.6 IQR 0.4
T1’03 T3’05 T7’05 T9’05 T11’04
0.2
0 1
10
100
1000
10000
Peer Arrival Rate (per hour)
CDF
CDF
Figure 5: CDF of the (hourly) peer arrival rate in 5 traces collected between 2003 and 2005 (horizontal axis in logarithmic scale). 1 0.8 0.6 0.4 0.2 0 100 1 0.8 0.6 0.4 0.2 0 100
T6’05 T6’09 101
102
103
104
T8’05 T8’09 101 102 103 104 Peer Arrival Rate (hourly)
1 0.8 0.6 0.4 0.2 0 100 1 0.8 0.6 0.4 0.2 0 100
T7’05 T7’09 101
102
103
104
T9’05 T9’09 101 102 103 104 Peer Arrival Rate (hourly)
Figure 6: CDF of the (hourly) peer arrival rate in 4 communities measured in 2005 and 2009 (horizontal axis in logarithmic scale).
19
1
0.8
CDF
0.6 IQR 0.4
T1’03 T3’05 T7’05 T9’05 T11’04
0.2
0 1
10
100
1000
10000
Session Length (min)
Figure 7: CDF of the peer session length in 5 traces collected between 2003 and 2005 (horizontal axis in logarithmic scale). 1
0.8
CDF
0.6 IQR 0.4
0.2
T6’09 T7’09 T8’09 T9’09
0 1
10
100
1000
10000
Session Length (min)
Figure 8: CDF of the peer session length in 4 traces collected in 2009 (horizontal axis in logarithmic scale).
20
Trace T1’03 T2’05 T3’05 T5’05 T5’05(s) T5’09 T6’05 T6’09 T7’05 T7’09 T8’05 T8’09 T9’05 T9’09 T10’05 T11’03 T14’07(1) T15’07
Exp(µ) 83.36 11.63 12.49 4.70 1.82 9.68 2.46 3.23 12.84 10.06 16.65 15.78 3.19 2.30 5.22 2.44 1396.71 45.30
Wbl(κ, λ) 77.52 0.88 11.55 0.99 9.96 0.75 5.30 1.71 1.96 1.19 9.25 0.92 2.63 1.18 3.38 1.11 12.92 1.02 7.67 0.72 12.95 0.72 14.34 0.85 3.39 1.16 2.56 1.44 5.28 1.03 2.53 1.08 1546.83 1.51 49.84 1.30
Pareto 0.24 62.33 0.16 9.75 0.50 6.30 -0.18 5.40 0.07 1.69 0.22 7.41 0.05 2.33 0.07 3.01 -0.01 12.99 0.67 4.07 0.65 7.16 0.36 10.38 0.02 3.14 -0.06 2.42 0.11 4.62 0.12 2.12 -0.63 2272.43 0.03 43.91
LogN(µ, σ) 3.77 1.21 1.94 1.02 1.66 1.24 1.37 0.62 0.34 0.59 1.69 1.05 0.58 0.71 0.78 0.82 1.98 1.23 1.37 1.26 1.87 1.33 2.06 1.19 0.80 0.80 0.61 0.63 1.17 0.96 0.53 0.72 6.95 0.86 3.62 0.54
Gam(κ, λ) 0.89 93.35 1.10 10.52 0.70 17.92 2.91 1.61 2.07 0.88 1.00 9.66 1.72 1.43 1.43 2.27 1.01 12.76 0.65 15.52 0.65 25.72 0.84 18.75 1.52 2.10 2.40 0.96 1.18 4.42 1.54 1.58 1.84 758.95 2.79 16.26
CDF
CDF
Table 11: parameters of fitting distributions for peer arrival rate in all traces.
1 0.8 0.6 0.4 0.2 0 100 1 0.8 0.6 0.4 0.2 0 100
T6’05 T6’09 101
102
103
104
T8’05 T8’09 101 102 103 104 Session Length (min)
1 0.8 0.6 0.4 0.2 0 100 1 0.8 0.6 0.4 0.2 0 100
T7’05 T7’09 101
102
103
104
T9’05 T9’09 101 102 103 104 Session Length (min)
Figure 9: CDF of the peer session length in 4 communities measured in 2005 and 2009 (horizontal axis in logarithmic scale).
21
Trace T1’03 T3’05 T7’05 T7’09 T8’05 T8’09 T9’05 T9’09 T11’04
Max 50,264 40,246 42,630 48,240 62,220 124,485 80,310 58,160 64,799
Mean 1,013 421 332 401 355 348 366 531 1,551
StDev 2,357 949 1,003 1,468 1,473 1,730 2,529 3,159 3,004
Q1 92 45 35 45 40 30 40 45 240
Median 404 136 85 95 80 80 75 80 660
Q3 1,065 459 285 255 250 205 190 180 1,500
IQR 973 415 250 210 210 175 150 135 1,260
Table 12: Session Length Statistics (minutes). Trace T1’03 T2’05 T3’05 T5’05 T5’05(s) T5’09 T6’05 T6’09 T7’05 T7’09 T8’05 T8’09 T9’05 T9’09 T10’05 T11’03 T14’07(1) T15’07
Exponential 0.000 0.000 0.000 0.000 0.080 0.175 0.046 0.246 0.190 0.406 0.060 0.424 0.023 0.158 0.032 0.200 0.028 0.146 0.010 0.074 0.015 0.098 0.009 0.066 0.004 0.048 0.000 0.011 0.024 0.105 0.169 0.350 0.042 0.143 0.049 0.108
Weibull 0.063 0.124 0.015 0.082 0.447 0.564 0.020 0.391 0.389 0.568 0.101 0.598 0.310 0.521 0.278 0.506 0.385 0.574 0.308 0.514 0.310 0.528 0.347 0.541 0.249 0.478 0.187 0.412 0.399 0.561 0.402 0.565 0.458 0.589 0.384 0.496
Pareto 0.000 0.003 0.000 0.000 0.000 0.001 0.000 0.049 0.000 0.008 0.000 0.020 0.000 0.015 0.000 0.011 0.000 0.009 0.000 0.006 0.000 0.006 0.000 0.013 0.000 0.004 0.000 0.007 0.000 0.007 0.000 0.002 0.000 0.025 0.000 0.002
Log-Normal 0.415 0.579 0.081 0.204 0.459 0.612 0.101 0.519 0.453 0.652 0.055 0.596 0.434 0.654 0.434 0.664 0.433 0.642 0.449 0.644 0.420 0.646 0.419 0.642 0.377 0.637 0.352 0.623 0.448 0.645 0.445 0.632 0.448 0.637 0.449 0.581
Gamma 0.000 0.000 0.007 0.039 0.367 0.479 0.042 0.315 0.313 0.497 0.125 0.606 0.202 0.362 0.179 0.374 0.253 0.435 0.159 0.304 0.173 0.337 0.181 0.330 0.103 0.246 0.044 0.140 0.247 0.392 0.311 0.471 0.332 0.458 0.282 0.402
Table 13: P-values from KS and AD test for session length distributions. section are shown in Table 15. Table 16 and Table 17 shows the significance values from GOF test and parameters of fitting distributions for download speed, respectively. We find that the difference of peer upload speed across P2P communities is not as significant as that of peer download speed, as shown in Figure 12. Surprisingly, we find that the peer upload speed has not increased but decreased in some communities over these years, in particular, the average peer upload speed In tml-project (T6’05, ’09) has even decreased dramatically, as shown in Figure 13. Statistics of the peer upload speed in the traces analyzed in this section are shown in Table 18. Table 19 and Table 20 shows the significance values from GOF test and parameters of fitting distributions for upload speed, respectively.
5.4
Peer Sharing Behavior
Understanding the peer sharing behavior is key to obtain in-depth knowledge of the usage patterns and to model user behavior in P2P systems. We analyze the peer sharing behavior with three metrics. First, the download completion is the percentage of a file that is downloaded in a single session. Second, the seeding time is the amount of time a seeder (that is, a peer who entered the system with the complete copy of a file) stays in the system. And third, the seeding-after-leeching time is the amount of time a peer stays in the system after finishing its download. 22
Trace T1’03 T2’05 T3’05 T5’05 T5’05(s) T5’09 T6’05 T6’09 T7’05 T7’09 T8’05 T8’09 T9’05 T9’09 T10’05 T11’03 T14’07 T15’07
Exp(µ) 5214005443.99 102.37 421.00 6525.77 1268.09 1863.87 464.76 368.31 332.11 401.39 355.06 348.33 366.15 531.34 413.45 1550.52 87.86 976.15
Wbl(κ, λ) 612.27 0.34 30.96 0.48 295.93 0.66 5602.84 0.82 1062.80 0.78 1486.82 0.69 287.93 0.63 246.24 0.67 205.71 0.62 222.56 0.60 203.09 0.61 181.91 0.59 175.47 0.59 200.80 0.55 238.85 0.61 1249.08 0.75 53.89 0.60 651.81 0.64
Pareto 0.68 404.67 1.16 9.24 0.73 160.19 0.43 3636.19 0.47 701.28 0.44 1152.65 0.76 143.79 0.64 136.23 0.80 102.47 0.79 109.28 0.77 101.72 0.79 90.43 0.72 90.45 0.76 98.66 0.79 119.99 0.49 810.54 0.96 23.56 0.79 325.15
LogN(µ, σ) 5.72 1.71 2.52 1.62 4.90 1.60 8.07 1.01 6.32 1.29 6.45 1.82 4.91 1.47 4.80 1.36 4.52 1.61 4.61 1.56 4.53 1.56 4.39 1.61 4.40 1.49 4.50 1.55 4.67 1.61 6.46 1.33 3.12 1.74 5.69 1.57
Gam(κ, λ) 0.05 99619224948.77 0.32 317.12 0.55 766.84 0.83 7836.69 0.73 1746.03 0.57 3241.96 0.51 907.91 0.56 654.21 0.49 671.05 0.46 864.87 0.48 746.44 0.44 786.58 0.43 844.97 0.38 1416.36 0.47 874.30 0.68 2267.88 0.47 186.26 0.53 1847.40
Table 14: parameters of fitting distributions for session length. Trace T1’03 T3’05 T6’05 T6’09 T7’05 T7’09 T8’05 T8’09 T9’05 T9’09 T11’04
Max 6,019 24,851 9,490 8,484 23,115 102,621 19,091 116,042 7,062 18,002 61,608
Mean 103 317 189 343 333 1,231 515 1,313 366 1,015 131
StDev 127 493 379 758 585 3,149 783 2,396 521 1,911 271
Q1 28 68 23 29 50 119 86 158 48 113 23
Median 62 167 68 98 139 404 247 531 168 376 68
Q3 133 373 186 334 366 1,210 653 1,390 451 1,036 157
IQR 105 305 163 305 316 1,091 567 1,232 403 923 134
Table 15: Peer Download Speed Statistics (Kbps). Trace T1’03 T2’05 T3’05 T5’05 T5’05(s) T5’09 T6’05 T6’09 T7’05 T7’09 T8’05 T8’09 T9’05 T9’09 T10’05 T11’03
Exponential 0.473 0.582 0.042 0.109 0.361 0.484 0.180 0.296 0.442 0.546 0.275 0.419 0.117 0.215 0.038 0.103 0.184 0.310 0.074 0.157 0.271 0.406 0.149 0.256 0.212 0.347 0.113 0.212 0.205 0.336 0.299 0.428
Weibull 0.471 0.591 0.416 0.526 0.471 0.595 0.428 0.590 0.479 0.618 0.475 0.610 0.452 0.583 0.459 0.601 0.462 0.600 0.484 0.593 0.496 0.622 0.481 0.603 0.495 0.610 0.491 0.599 0.490 0.616 0.493 0.611
Pareto 0.000 0.000 0.000 0.002 0.000 0.000 0.000 0.003 0.000 0.000 0.000 0.000 0.000 0.001 0.000 0.003 0.000 0.001 0.000 0.003 0.000 0.001 0.000 0.002 0.000 0.001 0.000 0.002 0.000 0.001 0.000 0.001
Log-Normal 0.479 0.608 0.503 0.629 0.385 0.537 0.307 0.483 0.343 0.516 0.442 0.589 0.447 0.598 0.461 0.597 0.385 0.557 0.472 0.600 0.401 0.541 0.435 0.584 0.436 0.577 0.464 0.606 0.404 0.543 0.402 0.560
Gamma 0.468 0.579 0.295 0.403 0.445 0.568 0.463 0.605 0.461 0.593 0.440 0.572 0.397 0.519 0.344 0.494 0.401 0.544 0.394 0.516 0.465 0.591 0.448 0.567 0.486 0.604 0.400 0.522 0.466 0.586 0.461 0.584
Table 16: P-values from KS and AD test for download speed distributions.
23
1
0.8
CDF
0.6 IQR 0.4
0.2
T1’03 T3’05 T9’05 T11’04
0 1
10
100
1000
10000
Download Speed (kbps)
CDF
CDF
Figure 10: CDF of the peer download speed in 5 traces collected between 2003 and 2005. 1 0.8 0.6 0.4 T6’05 0.2 T6’09 0 100 101 102 103 104 1 T8’05 0.8 T8’09 0.6 0.4 0.2 0 100 101 102 103 104 Download Speed (kbps)
1 0.8 0.6 0.4 0.2 0 100 1 0.8 0.6 0.4 0.2 0 100
T7’05 T7’09
101
102
103
104
T9’05 T9’09
101 102 103 104 Download Speed (kbps)
Figure 11: CDF of the peer download speed in 4 communities measured in 2009. Trace T1’03 T2’05 T3’05 T5’05 T5’05(s) T5’09 T6’05 T6’09 T7’05 T7’09 T8’05 T8’09 T9’05 T9’09 T10’05 T11’03
Exp(µ) 102.88 0.82 317.03 18.66 168.79 253.28 188.69 342.76 333.38 1231.29 515.05 1313.12 365.97 1014.64 372.86 131.31
Wbl(κ, λ) 99.93 0.94 0.52 0.63 276.97 0.80 13.81 0.63 151.32 0.82 216.49 0.78 133.84 0.66 210.06 0.59 254.11 0.69 811.31 0.62 423.39 0.73 968.77 0.67 290.08 0.70 717.72 0.65 289.99 0.70 110.11 0.76
Pareto 0.15 87.55 0.75 0.27 0.32 216.79 0.62 9.33 0.24 127.84 0.39 160.76 0.67 77.31 0.92 98.33 0.56 165.16 0.79 426.68 0.42 314.70 0.64 585.86 0.53 196.62 0.71 405.07 0.52 197.79 0.38 83.57
LogN(µ, σ) 4.03 1.21 -1.45 1.61 4.93 1.58 1.67 2.16 4.33 1.58 4.66 1.57 4.08 1.75 4.43 1.99 4.72 1.85 5.83 1.91 5.27 1.79 6.05 1.80 4.85 1.81 5.74 1.78 4.86 1.81 3.96 1.65
Gam(κ, λ) 0.96 106.68 0.51 1.62 0.73 435.46 0.50 37.03 0.75 225.46 0.69 365.24 0.54 349.10 0.46 750.56 0.57 582.91 0.49 2490.25 0.63 820.32 0.55 2370.87 0.59 620.61 0.53 1902.28 0.59 636.32 0.66 197.54
Table 17: parameters of distributions for download speed in all traces. 24
1
0.8
CDF
0.6 IQR 0.4
0.2
T3’05 T6’09 T9’05 T11’04
0 0.1
1
10
100
1000
Upload Speed (kbps)
CDF
CDF
Figure 12: Comparison of the peer upload speed distributions in 4 traces collected in 2005 (horizontal axis in logarithmic scale). 1 0.8 0.6 0.4 0.2 0 100 1 0.8 0.6 0.4 0.2 0 100
T6’05 T6’09 101
102
103
1 0.8 0.6 0.4 0.2 0 100 1
T7’05 T7’09 101
102
103
0.8 0.6 T8’05 T8’09
0.4
101 102 103 Upload Speed (kbps)
0.2 100
T9’05 T9’09 101 102 103 Upload Speed (kbps)
Figure 13: Comparison of the peer upload speed distributions in 4 communities measured in 2009 (horizontal axis in logarithmic scale).
25
Trace T3’05 T6’05 T6’09 T7’05 T7’09 T8’05 T8’09 T9’05 T9’09 T11’04
Max 106,324 13,162 8,319 11,539 97,748 46,679 104,755 11,744 1,475 15,307
Mean 85 41 17 42 82 53 59 24 20 85
StDev 475 139 86 129 873 289 651 103 58 212
Q1 6 3 1 5 5 4 3 1 1 12
Median 22 14 3 18 18 18 12 7 5 38
Q3 70 40 10 46 64 54 42 24 18 92
IQR 65 37 10 40 59 50 39 23 17 80
Table 18: Peer Upload Speed Statistics (Kbps). Trace T3’05 T5’05 T5’05(s) T5’09 T6’05 T6’09 T7’05 T7’09 T8’05 T8’09 T9’05 T9’09 T10’05 T11’03 T12’04
Exponential 0.000 0.000 0.058 0.131 0.000 0.000 0.095 0.181 0.066 0.136 0.005 0.016 0.186 0.282 0.015 0.046 0.085 0.160 0.007 0.028 0.034 0.086 0.029 0.074 0.165 0.267 0.198 0.304 0.000 0.000
Weibull 0.085 0.159 0.479 0.610 0.127 0.216 0.488 0.607 0.492 0.603 0.474 0.579 0.486 0.592 0.490 0.601 0.507 0.608 0.478 0.592 0.502 0.620 0.490 0.608 0.507 0.617 0.475 0.604 0.006 0.107
Pareto 0.001 0.005 0.002 0.009 0.000 0.001 0.001 0.004 0.000 0.003 0.001 0.009 0.000 0.001 0.001 0.004 0.000 0.003 0.002 0.009 0.002 0.010 0.001 0.007 0.000 0.001 0.000 0.001 0.000 0.002
Log-Normal 0.448 0.587 0.380 0.533 0.338 0.493 0.417 0.577 0.431 0.578 0.483 0.614 0.432 0.568 0.435 0.582 0.397 0.555 0.457 0.606 0.403 0.571 0.441 0.592 0.406 0.555 0.377 0.535 0.055 0.464
Gamma 0.000 0.000 0.500 0.602 0.000 0.000 0.405 0.543 0.430 0.536 0.266 0.375 0.454 0.552 0.327 0.432 0.449 0.538 0.335 0.447 0.470 0.561 0.401 0.516 0.465 0.564 0.438 0.553 0.000 0.018
Table 19: P-values from KS and AD test for upload speed distributions. We find that the download completion distributions differ significantly in communities of different types, as shown in Figure 14. Merely 20% of the sessions in SuprNova (T1’03) download more than 50% of the file. In contrast, more than 40% of the sessions in Filelist, transamrit, id Software, and alluvion (T3’05, T7’05, T9’05, T11’04) download more than 50% percent of the file, and around 20% of the sessions complete the download. Although the reason for the low download completion in SuprNova is not clear, this result suggests the prevalence of the multi-session download behavior in this community. We also find that the download completion distributions in some communities change significantly over time, and the evolution trend is different among communities. In tlm-project and id Software (T6’05,’09, T9’05,’09) most of the sessions download much more of a file in 2009 than in 2005. In contrast, in transamrit (T7’05, ’09) most of the sessions download less in one session in 2009 than 2005. And the download completion distributions in unix-ag.uni-kl (T8’05, ’09) do not change very much between 2005 and 2009, as shown in Figure 15. Statistics of the download completion in the traces analyzed in this section are shown in Table 21. Table 22 and Table 23 shows the significance values from GOF test and parameters of fitting distributions for download completion, respectively. We find that the seeding time distributions are very different in communities of different types. Most of the seeders in alluvion (T11’04) seed for several hours, while most of the seeders in id Software (T9’05) seed around only one hour, as shown in Figure 16. We also find that the seeding time distributions in most communities do not change very much over years, except in id Software (T9’05, ’09), where the seeding time is considerably longer in 2009 than in 2005, as shown in Figure 17. Another noticeable finding is that the ratio of the number of seeding sessions to the total number of sessions is very different across communities. In Filelist (T3’05) and
26
Trace T3’05 T5’05 T5’05(s) T5’09 T6’05 T6’09 T7’05 T7’09 T8’05 T8’09 T9’05 T9’09 T10’05 T11’03 T12’04
Exp(µ) 1516386634.83 23.14 9306810.31 51.67 40.91 16.80 41.99 82.30 52.63 59.26 24.05 20.35 54.52 85.38 455.16
Wbl(κ, λ) 38.81 0.31 13.99 0.55 62.14 0.37 34.55 0.62 25.42 0.60 6.53 0.50 30.29 0.67 38.40 0.55 32.53 0.60 25.55 0.52 13.20 0.54 10.87 0.54 38.88 0.66 63.05 0.68 3.53 0.44
Pareto 0.94 20.61 1.16 5.69 0.48 50.58 0.79 18.59 0.82 13.36 1.34 2.03 0.53 20.26 1.02 16.76 0.78 17.99 1.23 9.07 1.24 4.80 1.16 4.14 0.56 25.61 0.51 43.33 0.73 1.52
LogN(µ, σ) 2.84 2.03 1.56 2.37 3.36 1.97 2.64 1.97 2.33 1.96 0.82 2.17 2.61 1.74 2.67 2.10 2.56 2.00 2.20 2.19 1.53 2.25 1.37 2.15 2.83 1.82 3.33 1.81 0.46 1.40
Gam(κ, λ) 0.05 31591083797.19 0.41 55.80 0.07 138803130.51 0.49 105.80 0.46 88.22 0.34 49.64 0.55 75.77 0.38 215.78 0.46 114.45 0.36 166.21 0.40 60.32 0.40 50.71 0.54 101.41 0.56 152.52 0.14 3312.31
Table 20: parameters of fitting distributions for upload speed. 1
0.8
CDF
0.6
0.4
T1’03 T3’05 T7’05 T9’05 T11’04
0.2
0 0
20
40
60
80
100
Download Completion (%)
CDF
1 0.8 0.6 0.4 0.2 0
CDF
Figure 14: CDF of the download completion of traces collected between 2003 and 2005.
1 0.8 0.6 0.4 0.2 0
1 0.8 0.6 0.4 0.2 0
T6’05 T6’09 0
25
50
75
100
25
25 1 0.8 0.6 0.4 0.2 0
T8’05 T8’09
50
75
100
Download Completion (%)
T7’05 T7’09 50
75
100
50
75
100
T9’05 T9’09
25
Download Completion (%)
Figure 15: CDF of the download completion in 4 communities measured in 2005 and 2009. 27
Trace T1’03 T3’05 T9’05 T9’09 T6’05 T6’09 T7’05 T7’09 T11’04 T8’04 T8’09
Mean 24 59 68 77 41 68 49 39 66 59 62
StDev 31 41 38 34 39 39 41 39 34 40 40
Q1 2 13 29 55 4 28 7 4 38 15 17
Median 10 69 91 100 25 98 39 20 79 68 82
Q3 34 100 100 100 87 100 100 82 97 100 100
IQR 32 87 71 45 83 72 93 78 59 85 83
Table 21: Download Completion Statistics (values represent download completion percentages).
Trace T1’03 T2’05 T3’05 T5’05 T5’05(s) T5’09 T6’05 T6’09 T7’05 T7’09 T8’05 T8’09 T9’05 T9’09 T10’05 T11’03
Exponential 0.098 0.207 0.022 0.067 0.069 0.323 0.285 0.460 0.094 0.244 0.151 0.286 0.103 0.225 0.023 0.269 0.113 0.272 0.095 0.230 0.077 0.278 0.048 0.230 0.025 0.219 0.004 0.127 0.120 0.289 0.034 0.185
Weibull 0.469 0.593 0.280 0.486 0.069 0.308 0.369 0.525 0.146 0.300 0.388 0.539 0.261 0.437 0.025 0.233 0.173 0.379 0.294 0.491 0.081 0.292 0.047 0.233 0.034 0.212 0.007 0.185 0.168 0.379 0.096 0.251
Pareto 0.000 0.003 0.002 0.004 0.000 0.000 0.000 0.000 0.000 0.000 0.000 0.000 0.000 0.000 0.000 0.000 0.000 0.000 0.000 0.000 0.000 0.000 0.000 0.000 0.000 0.000 0.000 0.000 0.000 0.000 0.000 0.000
Log-Normal 0.422 0.564 0.308 0.487 0.038 0.311 0.218 0.368 0.036 0.153 0.379 0.538 0.191 0.411 0.010 0.233 0.079 0.370 0.281 0.518 0.024 0.261 0.019 0.237 0.008 0.174 0.002 0.152 0.078 0.345 0.015 0.166
Gamma 0.432 0.569 0.274 0.490 0.070 0.346 0.401 0.560 0.122 0.262 0.389 0.546 0.277 0.457 0.024 0.263 0.194 0.418 0.310 0.511 0.074 0.299 0.048 0.254 0.029 0.220 0.005 0.169 0.176 0.408 0.059 0.227
Table 22: P-values from KS and AD test for download completion distributions.
Trace T1’03 T2’05 T3’05 T5’05 T5’05(s) T5’09 T6’05 T6’09 T7’05 T7’09 T8’05 T8’09 T9’05 T9’09 T10’05 T11’03
Exp(µ) 24.31 33.42 58.65 32.51 58.12 32.92 41.18 67.84 48.74 38.58 58.95 62.23 67.61 77.18 49.90 65.99
Wbl(κ, λ) 18.01 0.64 21.95 0.56 58.37 0.99 29.65 0.81 62.13 1.35 27.33 0.72 34.24 0.70 71.70 1.29 43.53 0.77 32.15 0.72 58.34 0.97 63.32 1.06 71.44 1.30 84.37 2.00 45.66 0.80 71.86 1.65
Pareto 0.83 9.59 1.55 6.07 -1.22 121.59 -0.29 42.85 -1.22 121.80 0.41 21.52 -1.16 115.88 -1.11 111.43 -1.25 124.92 0.20 31.56 -1.50 150.45 -1.32 132.35 -1.16 115.83 -2.16 215.73 -1.28 127.79 -1.48 148.24
LogN(µ, σ) 1.98 1.94 2.03 2.25 3.37 1.69 2.60 1.86 3.61 1.36 2.47 1.87 2.63 2.07 3.71 1.49 2.90 2.12 2.61 1.94 3.34 1.90 3.48 1.71 3.70 1.54 4.05 1.14 2.99 2.01 3.83 1.22
Gam(κ, λ) 0.52 46.52 0.44 76.28 0.84 69.68 0.69 47.38 1.24 46.93 0.60 54.63 0.57 72.22 1.12 60.58 0.63 77.91 0.59 64.92 0.80 73.51 0.90 68.84 1.12 60.55 1.84 41.89 0.66 75.31 1.55 42.60
Table 23: parameters of fitting distributions for download completion.
28
1
0.8
CDF
0.6 IQR 0.4
T1’03 T3’05 T7’05 T9’05 T11’04
0.2
0 10
100
1000
10000
Seeding Time (min)
CDF
CDF
Figure 16: CDF of the seeding time in 5 traces collected between 2003 and 2005 (horizontal axis in logarithmic scale). 1 0.8 0.6 0.4 0.2 0 101 1 0.8 0.6 0.4 0.2 0 101
T6’05 T6’09 102
103
104
105
T8’05 T8’09 102 103 104 105 Seeding Time (min)
1 0.8 0.6 0.4 0.2 0 101 1 0.8 0.6 0.4 0.2 0 101
T7’05 T7’09 102
103
104
105
T9’05 T9’09 102 103 104 105 Seeding Time (min)
Figure 17: CDF of the seeding time in 4 communities measured in 2009 (horizontal axis in logarithmic scale). alluvion (T11’04) more than 50% of all sessions are seeding sessions. In contrast, this percentage is less than 5 in other communities, as shown in the column Ratio in Table 24. Table 25 and Table 26 shows the significance values from GOF test and parameters of fitting distributions for seeding time, respectively. Similar to the seeding time, we find that the seeding-after-leeching time distributions differ significantly in communities of different types, as shown in Figure 18. Noticeably, the seeding-after-leeching time of around 10% of seeding-after-leeching sessions is shorter than one minute, which means that these peers leave the system almost immediately after finishing their downloads. We also find that there is no significant change of the seeding-after-leeching time distributions over time within the same communities, as shown in Figure 19. Furthermore, the difference of the ratio of the number of seeding-after-leeching sessions to the total number of sessions across P2P communities is not as significant as that of seeding sessions, and the ratio is below 20% in all measured communities, as shown in Table 27. Table 28 and Table 29 shows the significance values from GOF test and parameters of fitting distributions
29
Trace T1’03 T3’05 T6’05 T6’09 T7’05 T7’09 T8’09 T9’05 T9’09 T11’04
Ratio (%) 2.6 61.6 1.1 1.9 1.56 2.0 0.6 2.7 0.6 79.0
Mean 560 392 803 534 902 1,145 1,150 332 952 1,425
StDev 1,316 950 2,170 1,551 2,832 3,187 3,801 972 2,708 2,765
Q1 74 40 60 50 55 45 65 30 45 240
Median 251 113 180 110 175 120 150 70 135 600
Q3 659 400 580 380 675 714 585 191 495 1,380
IQR 584 360 520 330 620 669 520 161 450 1,140
Table 24: Seeding Time Statistics (minutes). Trace T1’03 T2’05 T3’05 T5’05 T5’05(s) T5’09 T6’05 T6’09 T7’05 T7’09 T8’05 T8’09 T9’05 T9’09 T10’05 T11’03 T12’04 T13’03 T13’04
Exponential 0.199 0.309 0.027 0.083 0.055 0.136 0.000 0.575 0.266 0.478 0.057 0.723 0.012 0.076 0.009 0.103 0.009 0.053 0.001 0.029 0.011 0.054 0.001 0.019 0.006 0.064 0.001 0.018 0.009 0.071 0.183 0.360 0.071 0.187 0.000 0.015 0.247 0.399
Weibull 0.489 0.596 0.436 0.555 0.451 0.560 0.002 0.708 0.423 0.589 0.097 0.726 0.369 0.528 0.277 0.503 0.401 0.546 0.184 0.439 0.350 0.502 0.214 0.411 0.249 0.480 0.312 0.506 0.405 0.589 0.398 0.571 0.306 0.480 0.455 0.625 0.369 0.485
Pareto 0.000 0.001 0.001 0.005 0.000 0.001 0.000 0.016 0.000 0.006 0.000 0.034 0.000 0.021 0.000 0.020 0.000 0.011 0.000 0.014 0.000 0.009 0.000 0.006 0.000 0.009 0.000 0.017 0.001 0.019 0.000 0.003 0.002 0.011 0.000 0.000 0.000 0.000
Log-Normal 0.428 0.577 0.437 0.589 0.483 0.617 0.001 0.770 0.443 0.665 0.030 0.569 0.448 0.633 0.421 0.637 0.486 0.651 0.299 0.559 0.462 0.622 0.362 0.582 0.391 0.625 0.450 0.629 0.448 0.647 0.441 0.644 0.182 0.330 0.069 0.135 0.367 0.517
Gamma 0.484 0.561 0.376 0.484 0.326 0.445 0.001 0.754 0.365 0.530 0.095 0.725 0.220 0.361 0.169 0.351 0.243 0.384 0.104 0.265 0.221 0.343 0.105 0.236 0.123 0.315 0.144 0.298 0.244 0.431 0.322 0.486 0.336 0.526 0.336 0.434 0.349 0.463
Table 25: P-values from KS and AD test for seeding time distributions. Trace T1’03 T2’05 T3’05 T5’05 T5’05(s) T5’09 T6’05 T6’09 T7’05 T7’09 T8’05 T8’09 T9’05 T9’09 T10’05 T11’03 T12’04 T13’03 T13’04
Exp(µ) 560.55 211.93 392.04 1964.15 1105.13 3205.32 802.84 533.60 902.27 1145.25 1333.92 1150.28 332.04 951.56 700.27 1426.24 3165.14 1619.29 17424.71
Wbl(κ, λ) 425.69 0.70 129.59 0.58 260.28 0.64 2234.00 2.06 969.84 0.82 3361.03 1.15 448.84 0.58 307.82 0.61 464.42 0.56 474.20 0.50 715.25 0.57 504.58 0.53 177.63 0.58 407.26 0.51 376.69 0.56 1164.35 0.76 2060.99 0.53 1774.43 3.67 16133.51 0.87
Pareto 0.50 292.02 1.16 47.40 0.81 130.34 -0.51 2841.21 0.38 689.37 -0.18 3769.78 1.00 181.03 0.88 137.00 1.06 179.49 1.37 128.58 1.05 275.66 1.12 173.99 0.89 77.99 1.26 127.29 1.15 135.35 0.47 770.72 1.06 1039.14 -1.24 3092.07 0.29 12720.26
LogN(µ, σ) 5.29 1.62 3.94 1.87 4.75 1.64 7.48 0.43 6.26 1.23 7.60 1.24 5.25 1.66 4.94 1.52 5.25 1.78 5.18 1.88 5.70 1.70 5.33 1.70 4.36 1.59 5.04 1.89 5.00 1.86 6.40 1.31 6.41 2.78 7.31 0.60 9.06 1.26
Gam(κ, λ) 0.59 945.20 0.46 465.51 0.52 757.69 4.85 405.15 0.79 1396.34 1.21 2651.78 0.45 1783.69 0.48 1120.17 0.42 2154.25 0.36 3182.83 0.43 3068.43 0.39 2985.44 0.45 743.47 0.37 2587.97 0.42 1663.78 0.70 2033.16 0.40 7931.95 6.16 262.72 0.84 20826.17
Table 26: parameters of fitting distributions for seeding time. 30
Trace T1’03 T3’05 T6’05 T6’09 T7’05 T7’09 T8’05 T8’09 T9’05 T9’09 T11’04
Ratio (%) 14.8 18.0 7.4 2.8 11.3 2.8 12.7 1.9 13.4 3.5 12.7
Mean 312 517 345 277 333 417 351 393 182 184 1,823
StDev 1,174 1,054 823 768 693 1,271 1,017 1,741 424 826 3,495
Q1 21 58 20 20 25 35 25 25 10 5 240
Median 103 219 100 60 120 110 100 70 55 40 660
Q3 296 568 360 210 380 380 360 245 165 100 1,800
IQR 275 510 340 190 355 345 335 220 155 95 1,560
Table 27: Seeding-after-Leeching Time Statistics (minutes). Trace T1’03 T2’05 T3’05 T5’05 T5’05(s) T5’09 T6’05 T6’09 T7’05 T7’09 T8’05 T8’09 T9’05 T9’09 T10’05 T11’03
Exponential 0.000 0.000 0.384 0.507 0.213 0.332 0.000 0.521 0.141 0.420 0.039 0.174 0.113 0.319 0.026 0.195 0.164 0.334 0.051 0.170 0.084 0.226 0.005 0.052 0.076 0.261 0.008 0.089 0.138 0.299 0.149 0.343
Weibull 0.059 0.101 0.498 0.614 0.493 0.590 0.002 0.660 0.369 0.602 0.344 0.547 0.447 0.589 0.263 0.534 0.485 0.621 0.412 0.553 0.454 0.587 0.330 0.509 0.416 0.600 0.269 0.507 0.470 0.605 0.397 0.565
Pareto 0.001 0.003 0.000 0.000 0.000 0.001 0.000 0.015 0.000 0.004 0.000 0.019 0.000 0.012 0.000 0.026 0.000 0.004 0.000 0.005 0.000 0.006 0.000 0.012 0.000 0.009 0.000 0.023 0.000 0.006 0.000 0.002
Log-Normal 0.420 0.577 0.412 0.579 0.456 0.602 0.001 0.732 0.443 0.664 0.349 0.608 0.458 0.654 0.400 0.648 0.438 0.627 0.487 0.651 0.471 0.649 0.449 0.632 0.425 0.646 0.426 0.645 0.466 0.636 0.476 0.655
Gamma 0.000 0.000 0.487 0.599 0.431 0.526 0.002 0.724 0.320 0.565 0.270 0.470 0.356 0.505 0.176 0.392 0.427 0.553 0.293 0.429 0.379 0.496 0.173 0.306 0.319 0.507 0.145 0.317 0.400 0.536 0.312 0.492
Table 28: P-values from KS and AD test for seeding-after-leeching time distributions. for seeding-after-leeching time, respectively.
6
Identifying Peers and Sessions
Identifying peers and sessions in P2P traces is an important analysis step. Until now, no empirical study has examined how different ways of identifying peers and sessions in BitTorrent traces could influence the analysis results. In this section, we will investigate the effects on the analysis results of two parametric methods for identifying respectively peers and sessions in BitTorrent traces. To this end, we will use a subset of trace T1’03 and compare the following analysis results: the peer arrival rate, the session length, and the peer download speed (service capacity).
6.1
Peer Identification
A recent study [18] of a residential broadband network shows that users’ IP addresses are re-assigned very frequently: 50% of the IP addresses are re-assigned at least twice, and some even more than 10 times, in 24 hours. This means that the same IP address can be assigned to multiple peers over time, and that using the IP address as a permanent identifier for peers in P2P systems may lead to inaccurate analysis results. To examine how IP reassignment may influence the analysis results, we adopt the following simple approach when
31
1
0.8
CDF
0.6 IQR 0.4
T1’03 T3’05 T7’05 T9’05 T11’04
0.2
0 1
10
100
1000
10000
Seeding-after-Leeching Time (min)
CDF
CDF
Figure 18: CDF of the seeding-after-leeching time in 5 traces collected between 2003 and 2005 (horizontal axis in logarithmic scale). 1 0.8 0.6 0.4 0.2 0 100 1 0.8 0.6 0.4 0.2 0 100
T6’05 T6’09 101
102
103
104
T8’05 T8’09 101
102
103
104
Seeding-after-Leeching Time (min)
1 0.8 0.6 0.4 0.2 0 100 1 0.8 0.6 0.4 0.2 0 100
T7’05 T7’09 101
102
103
104
103
104
T9’05 T9’09 101
102
Seeding-after-Leeching Time (min)
Figure 19: CDF of the seeding-after-leeching time in 4 communities measured in 2009 (horizontal axis in logarithmic scale).
32
Trace T1’03 T2’05 T3’05 T5’05 T5’05(s) T5’09 T6’05 T6’09 T7’05 T7’09 T8’05 T8’09 T9’05 T9’09 T10’05 T11’03
Exp(µ) 70042582.59 291.67 540.02 1940.11 1854.76 1338.23 396.60 314.89 370.61 449.40 392.58 439.08 218.09 222.11 408.48 2013.22
Wbl(κ, λ) 201.34 0.34 263.22 0.83 422.78 0.72 2205.87 2.07 1585.91 0.78 932.23 0.64 295.03 0.70 204.22 0.65 285.66 0.71 293.82 0.65 272.42 0.66 222.45 0.58 157.29 0.68 122.11 0.61 303.95 0.69 1629.00 0.75
Pareto 0.65 128.72 0.26 218.02 0.52 277.93 -0.49 2769.65 0.50 1043.46 0.99 397.30 0.61 175.60 0.76 101.67 0.55 183.02 0.72 156.08 0.70 151.07 0.93 95.05 0.69 86.97 0.76 60.69 0.60 184.53 0.51 1041.90
LogN(µ, σ) 4.58 1.65 4.90 1.44 5.31 1.51 7.47 0.43 6.68 1.40 6.00 1.67 4.96 1.45 4.58 1.42 4.90 1.55 4.91 1.54 4.82 1.60 4.57 1.62 4.30 1.52 4.04 1.48 4.96 1.55 6.72 1.36
Gam(κ, λ) 0.06 1103937114.54 0.77 379.15 0.63 860.04 5.00 388.18 0.71 2609.84 0.52 2549.41 0.60 657.33 0.54 588.02 0.61 607.57 0.53 852.78 0.54 721.13 0.43 1020.91 0.57 381.06 0.47 472.12 0.59 694.37 0.68 2958.60
Table 29: parameters of fitting distributions for seeding-after-leeching time. Interval 1 hour 5 hours 10 hours 1 day 1 week
Max 2,764 2,363 2,328 2,286 2,269
Mean 731 260 180 129 112
StDev 467 219 183 156 149
Q1 399 131 86 54 44
Median 648 200 130 88 70
Q3 906 307 203 140 116
IQR 507 176 117 86 72
Table 30: Hourly Peer Arrival Rate Statistics with Various Peer Identification Intervals (number of joining peers per hour). identifying peers by their IP addresses. If the time interval between two consecutive observations of the same IP address is longer than what we call the peer identification interval, we assume that these two observations correspond to different peers. We then analyze the peer arrival rate, the session length, and the download speed of this trace. We use different peer identification intervals ranging from one hour to a few weeks, and then compare the analysis results of traces derived with different intervals. Although this approach only considers the possible IP reassignment during long observation intervals but omit those that could happen at any time, we believe that it is enough to show the effects of IP reassignment to the analysis results. We find that the peer identification interval has a significant impact on the distributions of the peer arrival rate and the session length: a smaller peer identification interval leads to higher peer arrival rates and shorter session lengths, as shown in Figures 20 and 21, respectively. The reason for this is that with a small interval, a series of observations of the same IP address will be identified as corresponding to more peers than with a large interval. Obviously, the resulting sessions identified with a small interval are shorter than those identified with a large interval. In addition, we find that the peer identification interval can also affect the download speed in the derived trace. Using small peer identification intervals can lead to a higher download speed: The average peer download speed in the derived traces decreases from 108 Kbps to 71 Kbps as the peer identification interval is increased from 1 hour to 1 week, as shown in Figure 25. The reason for this is that when calculating the download speed with small intervals, the observation gaps are larger than with large peer identification intervals. Tables 30, 31, and 32 provide respectively the statistics of the peer arrival rate, session length, and download speed of traces derived with various peer identification intervals. Table 33, 34, 35 shows the significance values from GOF test and parameters for fitting distributions of peer arrival rate, session length resulting from different peer identification intervals, respectively.
33
1
0.8
CDF
0.6 IQR 0.4
1 hour 5 hour 10 hour 1 day 1 week
0.2
0 10
100
1000
10000
Peer Arrival Rate
Figure 20: CDF of peer arrival rate for various peer identification intervals (horizontal axis in logarithmic scale). 1
0.8
CDF
0.6 IQR 0.4
1 hour 5 hour 10 hour 1 day 1 week
0.2
0 1
10
100
1000
10000
Session Length
Figure 21: CDF of session length resulting for various peer identification intervals (horizontal axis in logarithmic scale). Interval 1 hour 5 hours 10 hours 1 day 1 week
Max 48,982 48,982 48,982 49,424 49,863
Mean 106 352 519 716 863
StDev 626 1028 1226 1475 1876
Q1 41 141 124 98 86
Median 56 276 441 426 378
Q3 59 298 595 1058 965
IQR 18 157 470 960 879
Table 31: Session Length Statistics with Various Peer Identification Intervals (minutes). Interval 1 hour 5 hours 10 hours 1 day 1 week
Max 3,717 3,664 3,664 3,664 3,664
Mean 108 90 82 74 71
StDev 119 106 101 96 96
Q1 34 27 25 23 22
Median 72 57 51 46 45
Q3 138 113 102 90 86
IQR 104 86 77 68 64
Table 32: Peer Download Speed Statistics with Various Peer Identification Intervals (minutes). 34
1
0.8
CDF
0.6 IQR 0.4
1 hour 5 hour 10 hour 1 day 1 week
0.2
0 1
10
100
1000
10000
Download Speed (kbps)
Figure 22: CDF of download speed for various peer identification intervals (horizontal axis in logarithmic scale). Interval 1h 5h 10h 24h 168h
Exponential 0.083 0.235 0.163 0.364 0.200 0.420 0.250 0.469 0.235 0.452
Weibull 0.357 0.566 0.333 0.537 0.298 0.503 0.284 0.491 0.249 0.462
Pareto 0.000 0.000 0.000 0.000 0.000 0.000 0.000 0.000 0.000 0.000
Log-Normal 0.294 0.526 0.361 0.573 0.349 0.571 0.355 0.580 0.385 0.594
Gamma 0.367 0.583 0.371 0.579 0.337 0.543 0.322 0.521 0.250 0.468
Table 33: p-values of KS and AD test for arrival rates with different peer identification intervals. Interval 1h 5h 10h 24h 168h
Exp(µ) 731.29 259.91 180.43 128.80 112.37
Wbl(κ, λ) 818.23 1.64 284.50 1.33 192.85 1.19 132.99 1.07 113.58 1.02
Pareto -0.33 948.04 -0.07 278.16 0.01 179.37 0.08 117.61 0.14 95.87
LogN(µ, σ) 6.37 0.76 5.26 0.84 4.84 0.90 4.42 0.98 4.26 0.96
Gam(κ, λ) 2.36 310.38 1.81 143.64 1.54 116.93 1.29 99.52 1.21 92.48
Table 34: parameters of distributions for arrival rates with different peer intervals. Interval 1h 5h 10h 24h 1w
Exponential 0.000 0.000 0.000 0.000 0.000 0.000 0.000 0.000 0.000 0.000
Weibull 0.000 0.008 0.009 0.042 0.043 0.095 0.118 0.201 0.181 0.283
Pareto 0.000 0.000 0.000 0.000 0.000 0.000 0.000 0.001 0.000 0.002
Log-Normal 0.003 0.097 0.033 0.217 0.119 0.343 0.293 0.479 0.391 0.557
Gamma 0.000 0.000 0.000 0.000 0.000 0.000 0.000 0.000 0.000 0.000
Table 35: p-values of KS and AD test for session length with different peer identification intervals. Interval 1h 5h 10h 24h 1w
Exp(µ) 1284223.71 3617197.83 5210676.38 7314544.64 8442285.33
Wbl(κ, λ) 70.22 0.48 292.36 0.47 423.30 0.45 532.07 0.44 553.43 0.43
Pareto 0.30 54.26 0.19 259.44 0.18 400.59 0.29 496.98 0.61 387.07
LogN(µ, σ) 3.88 0.85 5.25 1.13 5.53 1.37 5.65 1.61 5.62 1.70
Gam(κ, λ) 0.08 15712186.48 0.08 42969895.97 0.08 62362001.43 0.08 89305559.32 0.08 104620683.43
Table 36: parameters of distributions for session length with different peer intervals.
35
Interval 10 minutes 30 minutes 1 hour 10 hours 1 day
Max 3,583 3,524 3,565 2,188 2,189
Mean 446 251 163 106 102
StDev 405 317 256 169 164
Q1 135 33 30 24 24
Median 338 141 75 54 51
Q3 624 349 212 119 112
IQR 488 316 183 95 88
Table 37: Hourly Peer Arrival Rate Statistics with Various Session Identification Intervals (number of joining peers per hour). Interval 10 minutes 30 minutes 1 hour 10 hours 1 day
Max 4,144 6,962 10,995 11,430 23,757
Mean 70 157 277 563 637
StDev 153 270 387 736 866
Q1 7 22 44 81 87
Median 17 56 122 315 355
Q3 61 162 361 772 881
IQR 54 140 318 691 793
Table 38: Session Length Statistics with Various Session Identification Intervals (minutes).
6.2
Session Identification
Many previous empirical BitTorrent studies [14, 6, 23] use reliable session identifiers provided by trackers to identify BitTorrent sessions. Since many P2P traces are collected by deploying instrumented clients that contact peers in a P2P system, reliable session identifiers are not always available in those traces. Due to the dynamic nature of P2P systems and measurement failures, peers in a P2P system cannot always be contacted by instrumented clients. Without reliable tracker logs, it is difficult to judge whether a peer is in the same session if the time interval between two consecutive observations of that peer is very long. Simply ignoring these large observation gaps and considering all observations of that peer as a single session can overestimate a peer’s session length, and as a consequence, it can influence the analysis results. Here we use a similar approach as we use to examine the influence from different peer identification intervals: when identifying sessions, if the time interval between two consecutive observations is larger than the session identification interval, we consider them to belong to two different sessions. Again we analyze the peer arrival rate, the session length, and the download speed of the trace, this time for different session identification intervals. We find that the session identification interval can significantly influence the analysis results. Smaller intervals lead to higher arrival rates than larger intervals, and to shorter session lengths as well, as shown in Figures 23 and 24, respectively. The reason for this is that with a small session identification interval, a series of observations of a peer are likely to be identified as belonging to multiple sessions, and these sessions are shorter than a session that contains all the observations of that peer. Using small session identification intervals also leads to higher peer download speed, but the difference in the download speed is not significant, as shown in Figure 25. Tables 37, 38, and 39 provide respectively the statistics of the peer arrival rate, session length, and download speed of traces derived with various session identification intervals. Table 40, 41, 42 shows the significance values from GOF test and parameters for fitting distributions of peer arrival rate, session length resulting from different session identification intervals, respectively. Interval 10 minutes 30 minutes 1 hour 10 hours 1 day
Max 6,838 5,403 4,713 2,901 2,901
Mean 97 95 94 93 91
StDev 118 123 126 132 131
Q1 26 24 24 24 24
Median 60 56 55 53 52
Q3 130 126 122 116 112
IQR 104 102 99 92 88
Table 39: Peer Download Speed Statistics with Various Sessions Identification Intervals (minutes). 36
1
0.8
CDF
0.6 IQR 0.4
10 minutes 30 minutes 1 hour 10 hours 1 day
0.2
0 1
10
100
1000
10000
Peer Arrival Rate
Figure 23: CDF of peer arrival rate resulting from various session identification intervals (horizontal axis in logarithmic scale). 1
0.8
CDF
0.6 IQR 0.4
10 minutes 30 minutes 1 hour 10 hours 1 day
0.2
0 1
10
100
1000
10000
Session Length (min)
Figure 24: CDF of session length resulting from various session identification intervals (horizontal axis in logarithmic scale).
Interval 10m 30m 1h 10h 1d
Exponential 0.441 0.597 0.179 0.398 0.217 0.420 0.304 0.474 0.296 0.471
Weibull 0.451 0.604 0.354 0.574 0.407 0.561 0.410 0.563 0.416 0.560
Pareto 0.000 0.000 0.000 0.002 0.000 0.001 0.000 0.000 0.000 0.000
Log-Normal 0.302 0.468 0.324 0.568 0.472 0.635 0.494 0.654 0.486 0.640
Gamma 0.459 0.612 0.366 0.560 0.367 0.542 0.382 0.527 0.359 0.522
Table 40: p-values of KS and AD test for arrival rates with different session identification intervals.
37
1
0.8
CDF
0.6 IQR 0.4
10 minutes 30 minutes 1 hour 10 hours 1 day
0.2
0 1
10
100
1000
10000
Download Speed (kbps)
Figure 25: CDF of download speed resulting from various session identification intervals (horizontal axis in logarithmic scale).
Interval 10m 30m 1h 10h 1d
Exp(µ) 446.39 250.52 163.18 105.97 102.10
Wbl(κ, λ) 446.13 1.00 216.78 0.78 141.23 0.80 95.81 0.85 92.15 0.85
Pareto -0.08 481.75 0.38 165.11 0.41 100.83 0.31 72.42 0.32 69.57
LogN(µ, σ) 5.49 1.40 4.66 1.49 4.29 1.34 3.96 1.21 3.92 1.22
Gam(κ, λ) 0.95 471.38 0.70 358.38 0.74 219.24 0.84 125.77 0.84 121.76
Table 41: parameters of distributions for arrival rates with different session intervals.
Interval 10m 30m 1h 10h 1d
Exponential 0.022 0.084 0.114 0.235 0.196 0.357 0.296 0.436 0.271 0.419
Weibull 0.300 0.406 0.410 0.545 0.443 0.583 0.459 0.603 0.479 0.610
Pareto 0.000 0.001 0.000 0.001 0.000 0.001 0.000 0.001 0.000 0.001
Log-Normal 0.406 0.563 0.486 0.623 0.462 0.601 0.381 0.551 0.398 0.560
Gamma 0.198 0.298 0.324 0.461 0.394 0.547 0.493 0.605 0.497 0.617
Table 42: p-values of KS and AD test for session length with different session identification intervals.
38
7
Related Work
This work is motivated by a number of archival approaches from other computer science disciplines: for the cluster-based communities, the Parallel Workloads Archive (PWA) [2] has become the de-facto standard for the parallel production environments community. Similarly, the Grids Workloads Archive (GWA) [3] collects Grid traces. For the Internet community, the Internet Traffic Archive (ITA) [8] and CAIDA [7] collect a large number of Internet traces to study the characteristics and usage patterns of networks. For the wireless network community, the CRAWDAD [25] archives data of a wide range of protocols and imposes a structured metadata format. For the availability research community, the Repository of Availability Traces [10] and the Failure Trace Archive [9] collect availability traces from a wide range of distributed systems. For the P2P research community, there are few efforts [16] of sharing P2P traces. Compared with these efforts, the P2P Trace Archive is currently the largest archive for P2P traces and it is the only one that represents all traces in a unified format.
8
Conclusion and Ongoing Work
Peer-to-Peer systems have gained phenomenal popularity over the last decade, and they serve millions of users. However, publicly available traces collected from real P2P systems are rare, which hampers the in-depth study of these systems. To address this situation, in this work we introduce the Peer-to-Peer Trace Archive that facilitates the exchange of P2P traces. With a comparative traces analysis, we show that the characteristics and usage patterns differ significantly across P2P systems, and some characteristics evolve rapidly over the years. We also find that the way of identifying peers and sessions in BitTorrent traces can significantly influence the analysis results. Currently, the P2P Trace Archive mainly hosts traces collected from P2P file-sharing systems. In the future, we plan to collect traces from other types of P2P applications, such as P2P live streaming and Video-on-Demand systems, massively multi-player online games, etc. We would like to invite the research community to contribute with traces to extend this Archive.
9
Acknowledgements
The research leading to this contribution has received funding from the European Community’s Seventh Framework Programme in the P2P-Next project under grant no 216217.
39
References [1] [2] [3] [4]
[5] [6] [7] [8] [9] [10] [11] [12]
[13]
[14] [15]
[16] [17] [18]
[19] [20] [21] [22] [23] [24] [25] [26]
ipoque internet studies, 2006-2009. [Online] Available: www.ipoque.com/resources/internet-studies/. 5 The Parallel Workloads Archive. [Online] http://www. cs.huji.ac.il/labs/parallel/workload/., Jul 2007. 36 D. E. Alexandru Iosup. The grid workloads archive, Jul 2007. [Online]. Available: http://gwa.ewi.tudelft.nl/. 37 N. Andrade, M. Mowbray, A. Lima, G. Wagner, and M. Ripeanu. Influences on cooperation in bittorrent communities. In P2PECON ’05: Proceedings of the 2005 ACM SIGCOMM workshop on Economics of peer-to-peer systems, pages 111–115, New York, NY, USA, 2005. ACM. 8, 9, 10 M. Barbaro and T. Zeller. A face is exposed for AOL searcher no. 4417749. New York Times article, Aug 9 2006. [Online] Available: http://www.nytimes.com/2006/08/09/technology/09aol.html. 6 A. Bellissimo, B. N. Levine, and P. Shenoy. Exploring the use of bittorrent as the basis for a large trace repository. Technical report, 2004. 34 CAIDA Team. The Cooperative Association for Internet Data Analysis, Mar 2009. 37 P. Danzig, J. Mogul, V. Paxson, and M. Schwartz. The Internet Traffic Archive, Mar 2009. 37 e. a. Dick Epema, Alexandru Iosup. Failure trace archive(FTA), 2009. 38 B. Godfrey and I. Stoica. Repository of availability traces (RAT), Aug 2007. 37 S. Guha, N. Daswani, and R. Jain. An experimental study of the skype peer-to-peer voip system, 2006. 12 S. B. Handurukande, A.-M. Kermarrec, F. Le Fessant, L. Massouli´e, and S. Patarin. Peer sharing behaviour in the edonkey network, and implications for the design of server-less file sharing systems. In EuroSys, pages 359–371, 2006. 5, 8, 12 A. Iosup, P. Garbacki, J. A. Pouwelse, and D. H. J. Epema. Correlating topology and path characteristics of overlay networks and the internet. In IEEE/ACM Int’l. Symp. on Cluster Computing and the Grid (CCGrid) Workshops, GP2PC, page 10, 2006. 8 M. Izal, G. Urvoy-Keller, E. W. Biersack, P. A. Felber, Al, and L. Garc´es-Erice. Dissecting bittorrent: Five months in a torrent’s lifetime. pages 1–11. 2004. 34 A. Klemm, C. Lindemann, M. K. Vernon, and O. P. Waldhorst. Characterizing the query behavior in peer-to-peer file sharing systems. In IMC ’04: Proceedings of the 4th ACM SIGCOMM conference on Internet measurement, pages 55–67, New York, NY, USA, 2004. ACM. 5, 8, 12 Laboratory for Advanced System Software, University of Massachusetts Amherst. UMass Trace Repository, Mar 2009. 5, 8, 9, 12, 38 F. Le Fessant, S. B. Handurukande, A.-M. Kermarrec, and L. Massouli´e. Clustering in peer-to-peer file sharing workloads. In IPTPS, pages 217–226, 2004. 8, 12 G. Maier, A. Feldmann, V. Paxson, and M. Allman. On dominant characteristics of residential broadband internet traffic. In IMC ’09: Proceedings of the 9th ACM SIGCOMM conference on Internet measurement conference, pages 90–102, New York, NY, USA, 2009. ACM. 31 A. Narayanan and V. Shmatikov. How to break anonymity of the netflix prize dataset, 2006. 6 A. Parker. The true picture of peer-to-peer filesharing, 2004. [Online] Available: http://www.cachelogic.com/. 5 J. A. Pouwelse, P. Garbacki, D. H. J. Epema, and H. J. Sips. The bittorrent p2p file-sharing system: Measurements and analysis. In IPTPS, volume 3640 of LNCS, pages 205–216. Springer, 2005. 8 J. Roozenburg, J. Roozenburg, J. Roozenburg, M. Presentation, and D. I. J. A. Pouwelse. Title secure decentralized swarm discovery in tribler, 2006. 9 D. Stutzbach and R. Rejaie. Understanding churn in peer-to-peer networks. In IMC ’06: Proceedings of the 6th ACM SIGCOMM conference on Internet measurement, pages 189–202, New York, NY, USA, 2006. ACM. 34 L. Vu, I. Gupta, J. Liang, and K. Nahrstedt. Measurement and modeling a large-scale overlay for multimedia streaming. In in Proc. QShine, 2007. 12 J. Yeo, D. Kotz, and T. Henderson. CRAWDAD: a community resource for archiving wireless data at dartmouth. SIGCOMM Comput. Commun. Rev., 36(2):21–22, 2006. 37 B. Zhang, A. Iosup, P. Garbacki, and J. Pouwelse. A unified format for traces of peer-to-peer systems. In High Performance Distributed Computing, 2009. 6
40