case of reconfigurable architectures, the application development process ..... toolset on an Intel 32-bit Core2 Duo E8500 @3.16 GHz, running Linux kernel ...
The Q2 Profiling Framework: Driving Application Mapping for Heterogeneous Reconfigurable Platforms S. Arash Ostadzadeh, Roel Meeuws, Imran Ashraf, Carlo Galuzzi, and Koen Bertels� Computer Science and Engineering Department of Software and Computer Technology Delft University of Technology, Delft, The Netherlands �������� � � ���������� ���� ��� ������
� ����������������� �������
Abstract. Heterogeneous multicore architectures pose specific challenges regarding their programmability and they require smart mapping schemes to make efficient use of different processing elements. Various criteria can drive this mapping, such as computational intensity, memory requirements, and area consumption. In order to facilitate this complex mapping task, there is a clear need for tools that investigate the use of such critical resources, like memory and hardware area. For this purpose, we developed the Q2 profiling framework. It consists of two main parts: an advanced memory access profiling toolset, which provides detailed information on the runtime memory access patterns of an application and a statistical modeling component, which makes hardware area predictions early in the design phase based on software metrics. These tools are integrated using a partitioning methodology. We demonstrate the effectiveness of our framework using three applications in our experiments. One application is further detailed in a case study to illustrate the use of our methodology. Experimental results show application speedup of up to 2.92×.
1
Introduction
Multicore architectures, especially when containing heterogeneous processing elements, pose specific challenges regarding their programmability. Programming such platforms implies, among other things, determining what parts of the application should be mapped on what processing elements. Various criteria can drive this mapping, such as the nature of the computation or the number of cycles required by individual tasks. However, in multicore platforms, data communication is often the primary bottleneck in achieving the anticipated speedups. This is especially true for legacy applications, which have to be ported to such platforms. Furthermore, in the case of reconfigurable architectures, the application development process involves building and synthesizing hardware blocks, which is quite time-consuming. As a consequence, there is a need for fast and early predictions of the hardware costs of the different parts of an application. �
This research is partially supported by the Artemisia iFEST project (grant 100203), the Artemisia SMECY project (grant 100230), and the FP7 Reflect project (grant 248976).
O.C.S. Choy et al. (Eds.): ARC 2012, LNCS 7199, pp. 76–88, 2012. c Springer-Verlag Berlin Heidelberg 2012 �
The Q2 Profiling Framework: Driving Application Mapping
77
Efficient mapping of the application is the main concern of the Q2 profiling framework. Q2 is part of a semi-automatic tool platform for integrated HW/SW co-design, targeting heterogeneous computing systems containing reconfigurable components. The profiling framework focuses on the data communication that occurs inside the application and on the estimation of reconfigurable resource consumption expected for each part of the application. The ultimate goal is to efficiently partition the application into hardware and software. The profiling data is utilized to guide developers in reducing the data communication between the hardware and the software components so as to maximize the potential speedup, while satisfying resource constraints. HW/SW partitioning has been an active field of research in the last decade. Many approaches have been proposed, which address the problem in diverse ways. Generally, the process can be carried out based on various levels of granularity, ranging from fine-grained basic blocks or loops [11,2] to coarse-grained functions [15,8]. Apart from the traditional partitioning methods, different heuristic and evolutionary approaches have also been investigated to address this problem [16]. Our partitioning methodology is similar to the one presented in [8], which supports the partitioning of an application between several processing elements (SW/SW partitioning) at the function-level, as well as HW/SW partitioning utilizing some profiling information. However, in [8], as in most other approaches, partitioning is performed based on the call graph, whereas we utilize the Quantitative Data Usage (QDU) graph [14], annotated with Quipu area estimates [13] as the main reference. The data communication between functions in the application is extracted automatically by our advanced profiling toolset. In this way, complex data-flows between functions can be made clear, enabling developers to find better partitions compared to the ones obtained using only the call graph and general execution time profiling data. As the available area in contemporary FPGAs continues to increase, the size of the code segments that are mapped into the hardware is no longer a restriction. In fact, it is often more efficient to map larger sections of the code into the hardware. Consequently, the utilization of HW/SW partitioning at fine granularities will diminish in future reconfigurable systems, while coarser grained approaches will gain in relevance. As a result, we believe that mapping a rather large function or, in general, a combination of several coupled functions, will not be elusive anymore. To the best of our knowledge, the work presented in this paper is the only approach which proposes such merging of functions based on accurate profiling information. Merging tightly communicating functions not only presents a comprehensive view on the whole task, but also allows developers to perform optimizations, particularly for memory requirements, in a feasible and efficient way. In this paper, we show the need for and the usage of the proposed profiling framework by mapping three real applications onto the Molen reconfigurable architecture [5]. The main contributions of this paper can be summarized as follows: – the presentation of the Q2 profiling framework; – the introduction of a HW/SW partitioning methodology based on detailed dynamic and static profiling data; – the utilization of dynamic profiling information for reducing the data communication between hardware and software partitions; – the presentation of experimental results on three well-known applications.
78
S.A. Ostadzadeh et al.
The rest of this paper is structured as follows. Section 2 briefly describes the research context of the work presented in this paper. In Section 3, we describe the Q2 profiling framework. Subsequently, a detailed case study of an image processing application is presented in Section 4. After that, the experimental results on two other applications are presented in Section 5. Finally, Section 6 concludes the paper.
2
Research Context
The work presented in this paper, although not restricted to any specific platform, has been developed in the context of the Delft WorkBench (DWB). The DWB addresses the entire design cycle from profiling and partitioning to synthesis and compilation of an application. It focuses on four main steps within the entire heterogeneous system design. The first step is related to application profiling. In the second step, code partitioning is investigated along with possible code segments parallelization. Following the decision to map particular code segments onto the hardware, a retargetable compiler generates new object code, which contains calls to reconfigurable hardware blocks for selected segments of the code. Finally, in the last step, VHDL generation, the identified code segments are translated into HW blocks. The Molen polymorphic processor has been used for the experiments in the work presented in this paper. The Molen architecture is based on the co-processor architectural paradigm. It couples a General Purpose Processor (GPP) and a reconfigurable co-processor (RP). The GPP controls the execution and (re)configuration of the RP. An instruction fetched from memory goes to the arbiter, which partially decodes the instruction and issues the instruction to either processors. One of the advantages of the Molen paradigm is that it can be easily ported to various platforms. In our case, we have used the Xilinx XC5VFX200T Virtex5 FPGA as a platform. The PowerPC on this FPGA is used as the GPP and the rest of the 30K slices is available for (re)configuration. The advancement in technology will lead to FPGAs with even larger sizes. This, in turn, will increase the possibility of mapping larger code segments on hardware.
3
Q2 Profiling Framework
Fig. 1 depicts the two pillars of the Q2 profiling framework. The static profiling part extracts code characteristics from the application source code. These characteristics are used by a linear model to make fast and early predictions of hardware implementation details, such as FPGA area estimates. The dynamic profiling part focuses on extracting data communication information by examining the runtime behavior of the application and, therefore, is not as fast as the static part. 3.1 Quipu Modeling Approach With the growing adoption of heterogeneous and reconfigurable computing platforms, it has become important to have efficient prediction models to drive early HW/SW partitioning. Therefore, we incorporate the Quipu high level quantitative prediction modeling approach [13] in the Q2 framework. This approach accurately
The Q2 Profiling Framework: Driving Application Mapping
Code Revis
ion
Dynamic Profiling
Resource Usage
Kernel Library
Static Profiling
Profiling Data (XML)
79
Quantitative Data Usage Graph
Partitioning Framework
Fig. 1. The Q2 Profiling framework within the DWB
models the relation between hardware and source code related software metrics using several statistical techniques. The proposed approach generates models that predict hardware-related indicators for reconfigurable components, such as the number of slices, the number of flip-flops, and the number of wires. It employs automatic model selection, artificial neural networks, (logistic) regression, and data transformations. These models take a high-level language description as input, enabling hardware prediction in the early design stages. In this paper, we focus only on using Quipu area estimation models for the combination of the DWARV C-to-VHDL compiler and the Xilinx FPGA toolchain, although different combinations can be considered as well. The approach is generic and not limited to any particular platform or toolchain by allowing the generated models to be recalibrated for different tools and platforms, contrary to the majority of existing techniques. Furthermore, a major strength of Quipu models is their linear nature. Although the statistical techniques used to create the models may be very time-consuming, the resulting prediction models require only a few multiplications in addition to parsing the source code. This allows for the integration of Quipu models in highly iterative design processes, where new estimates are required many times in a short period of time. Additionally, as Quipu models are based on measurements from C code, very early predictions become possible, allowing designers to make important decisions on hardware mapping at an early stage. In order to characterize the software complexity as it relates to hardware, Quipu utilizes Software Complexity Metrics (SCMs) [12]. Currently, we use 92 SCMs as a base for our model. Most of these metrics are counts of different operators, but other metrics, such as the Cyclomatic complexity, the number of definition-use pairs, or more complex data-flow metrics, are also included. Quipu consists of a set of tools and a kernel library. In the modeling flow, Quipu extracts SCMs and hardware-related indicators from a kernel library. The library contains 235 kernels from a wide variety of application domains, contrary to many existing techniques, which use libraries of tens of kernels at most. This allows us to build models that are generally applicable. It is also possible to build domain-specific models by using, for example, only the 54 cryptography-related kernels out of the 235 kernels considered. An overview of the
80
S.A. Ostadzadeh et al.
Table 1. Overview of the kernel library, the number of kernels and their main algorithmic characteristics in each application domain Domain Bioinformatics Compression Cryptography DataProcessing DSP ECC Mathematics Multimedia Physics Total
Kernels Floating Point Bit-based Streaming Control 6 9 54 9 24 15 49 58 11
0 0 0 0 10 0 21 20 11
235
62
× ×
×
× ×
× ×
× × some × some ×
some
×
×
kernels in this library is provided in Table 1. The Quipu modeling approach consists of the following tools: – The Metrication tool - This tool extracts the software complexity metrics from C kernels in the library or from a different application. The tool is implemented in the CoSy compiler system [7] and, as such, can adopt some of the more high-level optimizations and transformations that are used in the modeled toolchain, such as common subexpression elimination or dead code elimination. – The Hardware Measurement tool - This tool processes the log files of the hardware toolchain and parses the netlists, in order to obtain hardware characteristics. These include, for example, the number of slices, the number of wires, and the clock period. – The Modeling Scripts and the Prediction tool - Quipu automatically evaluates different statistical modeling techniques and generates an optimized model instance for a particular toolchain. This model can later be used by the Prediction tool to make predictions for examined kernels. 3.2 QUAD Dynamic Memory Profiling Toolset Traditionally, a general profiler, such as gprof [9], is utilized to identify application hotspots at the function-level in terms of the execution time. gprof provides samplebased execution timing estimates, in addition to an accurate call graph. On the other hand, Maip, its counterpart in our Q2 profiling framework, provides accurate measurements for the contribution percentage of individual functions with respect to the whole execution time of an application. Furthermore, Maip distinguishes between memory access related and computation related operations. The Quad toolset1 consists of several tools developed to provide a comprehensive overview of the memory access behavior of an application, as well as, to extract fine-grained detailed memory access related statistics. The Quad [14] core module 1
The Quad toolset is available at http://sourceforge.net/projects/quadtoolset/
The Q2 Profiling Framework: Driving Application Mapping
81
primarily detects the actual data dependencies at the function-level. Quad measures data dependency as producer/consumer bindings. More precisely, actual data dependency arises when a function consumes data that was produced earlier by another function. It should be noted that the conventional argument passing by the caller function to the callee does not necessarily imply that the data will be used later by the called function. Furthermore, Quad does not rely on the common approach of data dependency detection based on hierarchies of function calls (conventionally depicted with a call graph), as it merely traces byte transfers between the functions via memory accesses without any connection to the control dependencies of functions. The exact amount of byte transfers and the number of Unique Memory Addresses (UnMAs) used in the transfer process are also measured. Based on the efficient Memory Access Tracing (MAT) module implemented in Quad, which tracks every single access (read/write) to a memory location, a variety of statistics related to the memory access behavior of an application can be calculated. This includes, for example, the ratio of local to global memory accesses in a particular function call. In addition to the Quad core module, there are several other tools available in the Quad toolset. Anyhow, they are not in the focus of this work. All the tools in the dynamic profiling part of Q2 are implemented utilizing the Pin [3] Dynamic Binary Instrumentation (DBI) platform. 3.3 Partitioning Methodology The outputs of both profiling parts are used to derive a suitable HW/SW partitioning of the application. For this purpose, we follow these steps: – Execution Time Profiling - MAIP determines the computational hotspots. – Hardware Estimation - All functions in the application are annotated with FPGA hardware area estimates, as predicted by the respective Quipu models. – Initial Partitioning - With the knowledge of the computational hotspots and the respective area predictions, an initial partitioning is determined. In this respect, as many computation-intensive kernels as possible are moved to the hardware, so as to speed up their execution, while satisfying the area constraints. – Data Communication Analysis - The data communication of the kernels in the initial partitioning set is then analyzed using Quad. Because the set of functions that is analyzed has been reduced, Quad can run much faster. Additionally, it helps the developer to focus on the main data communication bottlenecks. – Final Partitioning - Certain kernels in the initial partitioning can still heavily communicate with other functions in software, implying a heavy communication overhead. Therefore, an additional set of kernels may be moved to hardware, if possible, so as to reduce the amount of data communicated between hardware and software.
4
Case Study
In this section, we present a concise analysis of an image processing application, Canny Edge Detection (CED), to illustrate the Q2 methodology and the added value of the Q2 profiling framework. Canny [6] is a well-known edge detection algorithm,
82
S.A. Ostadzadeh et al.
which outperforms other edge detection methods. Given an image, the algorithm first eliminates any noise. It then finds the image gradient to highlight regions with high spatial derivatives. The next step is to track along these regions and suppress any pixel that is not at the maximum. The gradient array is further reduced by hysteresis. We have used the implementation provided by the CVL at the University of South Florida [1]. The performed procedure can be clearly divided into the following four main steps: 1) the use of a Gaussian filter to remove the noise, 2) the determination of the edge strength, 3) the application of Non-Maximal Suppression, and 4) the application of hysteresis. We examine the memory access behavior of the application to spot the main flow of the data along the top contributing kernels and further utilize the profiling data in HW/SW partitioning. The profiling data is also used to spot deficiencies related to the application memory usage, resulting in some code optimizations to improve the performance of the application mapped onto the Molen reconfigurable architecture. In this case study, we specifically show the following qualities related to the Q2 framework: – – – –
the analysis of the data communication between the kernels in the application; the prediction of hardware resource utilization for the different kernels; the detailed analysis of the application to decide on HW/SW partitioning; the introduction of some manual application source code optimizations derived by the inspection of the extracted profiling data; – the preparation of an executable version of the application that can run on the Molen machine respecting the restrictions previously mentioned. The CED implementation consists of three source files containing 12 functions. For the experiments, we used a sample grayscale PGM image with a resolution of 800×600 pixels and 8 bpp. The standard deviation of the Gaussian filter was set to 2.0. The values of low and high thresholds for hysteresis were both set to 0.5. All experiments were performed on two different platforms. We used the Quad toolset on an Intel 32-bit Core2 Duo E8500 @3.16 GHz, running Linux kernel v2.6.34. The source code was compiled with gcc v4.5.0 using level two optimizations and without function inlining. An embedded PPC 440 @400 MHz is integrated in a Xilinx Virtex5 FX 200T with 2.0 MB BRAM FPGA. The utilized Quipu prediction models were generated for the DWARV C-to-VHDL compiler and the Xilinx ISE 13.2 synthesis tools targeting the same Virtex5 FPGA containing a Molen machine implementation. The implementation requires 7283 slices, leaving 23437 slices available for accelerating application kernels. Simulations were performed using Modelsim 6.5f. Quipu Profiling. We modified the CED application, where necessary, so that the kernels could be mapped to hardware. The modification involves moving dynamic memory allocations and recursive function calls to function stubs, which call the actual kernels. Of course, these changes required new profiling results. In Table 2, the top five kernels with their associated new time contributions are listed. We also performed an investigation of the size of potential hardware designs. The results of the area predictions are also presented in Table 2. The table lists the predicted number of slices, as well as the percentage of that area with respect to the available area in
The Q2 Profiling Framework: Driving Application Mapping
83
Table 2. The Area predictions and theoretical speedups for the kernels in CED Areaa
Kernel
Slices
% of area
% Exec. speedupb time single kernel cum.
hw_gaussian_smooth 1951 8.3% 70.59% hw_derrivative_x_y 510 2.2% 2.49% hw_magnitude_x_y 1442 6.2% 5.14% non_max_supp 2132 9.1% 14.36% hw_apply_hysteresis 765209 3265% 2.68% a b
3.40× 3.40× 1.03× 3.71× 1.05× 4.59× 1.17× 13.48× 1.03× 21.10×
Area predicted by a Quipu prediction model for the Virtex 5 FX 200T. Theoretical application speedup, assuming 0s execution time for each kernel.
the Molen implementation. The kernels in the table are in the order of execution in the CED application. Note that the apply_hysteresis kernel is exceedingly resourceintensive, requiring 3265.0% of the target FPGA area. This big requirement can be traced back to a local array of 32K 32-bit integers. The used Quipu model was generated for DWARV, which generates registers for such local arrays, requiring 1024K flip-flops with additional logic and wiring. When we consider to merge several kernels together, the predictions suggest that the first four kernels will easily fit together on the target FPGA, requiring a total of 19.6% of the FPGA area. In addition to the area predictions, the theoretical application speedups are also reported in Table 2. These speedups are calculated using Amdahl’s law, assuming an unlimited speedup for the kernel(s) in question, as follows: lim
p→∞
1 1 p = = , 1 − f (p − 1) f 1−s
(1)
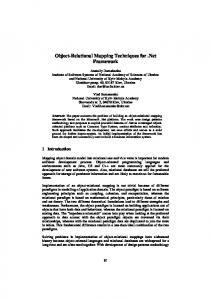
where p is the speedup factor of the accelerated part, f is the percentual contribution of the sequential part, and s is the original percentual contribution of the accelerated part. Note that these speedups are not predictions made by Quipu. Table 2 lists both the speedup, when one kernel is accelerated, and the cumulative speedup, where each kernel is accelerated together with the previous ones. Observe that, as large parts of the application are accelerated, the contributions of the remaining kernels become more significant. For example, apply_hysteresis has a contribution of 2.68%, but, with much of the application already accelerated, the difference in theoretical speedup is 56.8%. As mentioned earlier, merging the first four kernels in Table 2 would yield a hardware block that would fit on the target FPGA. The maximum speedup of the application using that block would be 13.48×. Of course, the efficiency of accelerating this block will never be 100% and the actual speedup will be lower. QUAD Profiling. We utilized Quad to reveal the data communication between different functions of the CED application. Due to space limitations, only a part of the resulting Quantitative Data Usage (QDU) graph is depicted in Fig. 2(a). It contains the functions in the critical data path of the application. The graph allows to trace, at runtime, what is happening to the input image. Furthermore, the extracted quantitative
84
S.A. Ostadzadeh et al.
values help to understand what are the memory requirements for each function to accomplish its task. Data Communication Bottlenecks. Modifying the CED application to comply with the hardware mapping restrictions, in turn, causes some changes in the data communication patterns of the application. As an obvious result, new data communication channels are formed between the introduced function stubs and the corresponding hardware-compliant kernels. However, this characteristic will not reinforce the data communication problem, as the connections between the stubs and their corresponding kernels are limited to providing the starting address of allocated memory blocks and some related basic data elements. There is only one exception in the case of apply_hysteresis, whose body can not be moved entirely to hardware, due to the invocation of a recursive function, follow_edges. Therefore, a considerable amount of data transfer is established between the extracted hw_apply_hysteresis and the corresponding function stub, apply_hysteresis (850kb using 425k UnMAs). The newly formed communication channel may be considered as a source of potential memory bottleneck and needs proper handling. Primarily, apply_hysteresis is dependent on the data that is provided by the nms and magnitude arrays. The data-flow originating from magnitude_x_y is now divided into separate flows for apply_hysteresis and hw_apply_hysteresis. From the total amount of 225k memory accesses, approximately 70% is accounted for hw_apply_hysteresis and the rest for apply_hysteresis. Nevertheless, both functions strictly access a whole part of the magnitude array. In essence, magnitude should be made available for both functions as a whole, regardless of the number of accesses carried out on the data residing in the array. Not every heavy data communication yields a potential memory bottleneck. A more detailed investigation is required to pinpoint problems related to memory accesses. Special attention has to be given to the size of the accessed memory blocks, the locality, the reusability and, most significantly, to the placement of the data (on/off-chip data allocation), where applicable. For our experiments, there was no offchip data allocation due to the Molen restrictions. However, this property must be considered in the general case. A review of the critical data path reveals several potential problematic memory access bottlenecks, which limit the performance of the application. Loading the image from an external source is the first obstacle. Beginning with hw_derrivative_x_y, there is a series of data communication via different memory blocks, which is responsible for the main performance bottleneck of the application. In each (sub)phase, one or more memory blocks are used as input to produce an output block. The data movement is performed through hw_magnitude_x_y, non_max_supp, hw_apply_hysteresis, apply_hysteresis, and follow_edges. Optimizing the CED application should be centered around the block processing. This, in a subsequent analysis, requires thorough examination of the exact life span of each block, the data dependencies between them, and the possible merging/reusing of the relevant data. Optimization. After a careful analysis of the results, we observed that all hardwarecompliant kernels up to hw_apply_hysteresis fit together on the reconfigurable fabric. Furthermore, together, they would exhibit a significant potential speedup of 13.46×.
The Q2 Profiling Framework: Driving Application Mapping
21024000 bytes (1920000 UnMA)
hw_gaussian_smooth 3840000 bytes (960000 UnMA)
Instance
hw_derrivative_x_y 1920000 bytes (1920000 UnMA) 2324712 bytes (1874256 UnMA)
simulation
Area Time (ms)
speedup
n/a 88.5
2.92×
71108 bytes (71108 UnMA) 480000 bytes (480000 UnMA)
94186 bytes (93922 UnMA)
read_pgm_image
hw_gaussian_nms
1433 bytes (1433 UnMA)
apply_hysteresis
638503 bytes 71108 bytes (638503 UnMA) (71108 UnMA)
90970 bytes 2870 bytes (46575 UnMA) (1319 UnMA)
follow_edges
78537 bytes (45049 UnMA)
make_gaussian_kernel 53324 bytes (4864 UnMA)
867597 bytes (435605 UnMA) 302657 bytes (156225 UnMA)
13.48× 13.48× 13.46×
(b) Area predictions and theoretical speedups for the kernels in CED
159898 bytes (159898 UnMA)
478605 bytes (478605 UnMA)
hw_apply_hysteresis
speedup
hw_magnitude_x_y
4758090 bytes (956810 UnMA)
non_max_supp
Area Maip %time
cumulative 7711 92.58% merged 5874 92.58% optimized 5808 92.57%
42072000 bytes (44 UnMA)
Theoretical
Instance
100 bytes (60 UnMA)
make_gaussian_kernel 7131876 bytes (480000 UnMA)
Real
Image
85
hw_apply_hysteresis
apply_hysteresis
42072000 bytes (44 UnMA) 33866802 bytes (5756810 UnMA) 94186 bytes (93922 UnMA)
follow_edges
(a) The Partial QDU graph for the hardware (c) Partial QDU graph for the hardware version version of CED of CED after merging Fig. 2. Merging identified kernels. (a) QDU before merging, (b) Area predictions and speedups, (c) QDU after merging.
Finally, the bulk of the communication occurred in this group of functions. In the following, we continue our evaluation by merging these kernels, providing additional profiling results, and implementing certain optimizations that the results suggest. The initial merging process consisted of the concatenation of the subsequent function calls. In the case of CED, this process was trivial. However, in case the to-bemerged functions have no direct connections in the call graph, the process may become more complex. In the table in Fig. 2(b), we observe that, prior to the merging, the predicted area consumption was 7711 slices with a theoretical speedup of 13.48×. After the merging, the potential speedup remains the same, but the predicted area decreases to 5874 slices. The reason for this behavior is very likely the increased reuse of calculations and variables. The used Quipu model was generated for the DWARV compiler and Xilinx ISE synthesizer, which use common compiler front-end optimizations and resource sharing, which can significantly reduce the required area. Now that we have a merged kernel, the Quad results also change accordingly. In Fig. 2(c), we see that most of the memory locations and accesses are now internal to the merged hw_gaussian_nms kernel. When we carefully investigate these new results, we see that the number of UnMAs is roughly 12 times as large as our input image (800×600×12×1 byte = 5760000 bytes). As subsequent phases of CED use different temporary data objects, we analyzed how the corresponding memory blocks might be reused. By determining the live ranges of different memory regions, we observed that the maximum amount of memory needed at the same time is 7 times the size of one image block. Therefore, we optimized the merged kernel to reuse memory blocks when they are no longer needed. The table in Fig. 2(b) indicates that this
86
S.A. Ostadzadeh et al.
optimization does not influence the potential speedup, but the required amount of memory is reduced significantly. Furthermore, the required area remains effectively the same at 5808 slices. In order to evaluate the proposed adjustments, VHDL code was generated for the merged hw_gaussian_nms kernel and simulated for the target platform using Modelsim 6.5f. Using exactly the same kernel input data as the one used on the PPC, the simulation took 177 million cycles. The synthesis of the kernel suggested a maximum clock speed of 235 MHz. Assuming a conservative 200 MHz results in an execution time of 88.5 ms. On the PPC, the execution took 292 ms, accounting for a kernel speedup of 3.44× and an application speedup of 2.92×. Because of the merging we performed, the kernel speedup has a big impact on the application speedup, as the merged kernel represents most of the computational work.
5
Experimental Results
Table 3 provides a summary of the results for three well-known applications. The first application is the MELP vocoder [4], used mainly for secure voice in radio devices. MELP uses extensive look-up tables and models of the human voice to extract and regenerate speech and, as such, it is a computation intensive application. CED has been discussed in detail in Section 4. N-Body [10] is a widely used technique to investigate the evolution of particles in various fields of science, such as physics or astronomy. The N-Body simulation proceeds over time steps, each time computing the net force on every body and thereby updating its position and other attributes. The system is then updated by moving each body to its new position. The simulation is performance hungry, because of the large number of particles involved in such application. Table 3 shows that four kernels for each application have been selected in the final partitioning as potential candidates to be mapped onto the hardware. For each application, the total execution time of the merged kernel containing the selected candidates is reported in Table 3. In case of MELP, Quipu predictions have an error of 8%, whereas in case of N-Body this error is about 30%. According to Quad, data communication between the HW and SW parts is reduced considerably as a result of the selected partitioning. The data reduction is measured by comparing two scenarios Table 3. Summary of the Q2 profiling results and the partitioning based on those results App.a
MELP Canny N-Body a b c
Number of kernels Tot.
Map.
59 12 10
4 4 4
Exec. timeb 51.8% 92.6% 99.7%
Area (slices)
Comm. Red.c
Pred.
Act. Err.(%)
6534 5381 11730
6043 7307 8209
8.1% 26.4% 30.0%
Speedup Theor.
Act.
57.1% 1.80× 22.7% 13.48× 42.9% 136.99×
1.30× 2.92× n/a
Application(App.), Execution(Exec.), Total(Tot.), Mapped(Map.), Predicted(Pred.), Actual(Act.), Error(Err.) Percentage contribution reported by the Maip profiler for all the mapped kernels together. The communication reduction as reported by Quad.
The Q2 Profiling Framework: Driving Application Mapping
87
where, in one, only the top contributing kernel is mapped to the hardware and, in the other, the merged kernel is mapped to the hardware. The overall theoretical speedup for MELP is 1.8×, although the actual speedup is 1.3×. For CED, the actual speedup is 2.92×. The actual speedup could not be reported for N-Body because the simulation scripts of our framework do not support the automatic generation of test benches for multidimensional arrays.
6
Conclusions
Efficient application partitioning for heterogeneous architectures is a difficult task. There are multiple factors to take into account, such as application speedup, area constraints, and memory bottlenecks. In this paper, we introduced the Q2 profiling framework that addresses this problem by providing a detailed insight into the mentioned aspects at early design stages. We have demonstrated how this profiling data can drive partitioning using three different applications, exhibiting speedups of up to 2.92×. In the future, we plan to investigate speedup estimation and power issues, as well as, to examine additional applications for mapping onto our target platform.
References 1. Canny Edge Detector, Image Analysis Research Lab., USF, �� !""#���� $��%��������� �"� &�"� &�' ���%��$�� �#� 2. Baleani, M., et al.: HW/SW partitioning and code generation of embedded control applications on a reconfigurable architecture platform. In: CODES 2002, pp. 151–156 (2002) 3. Luk, C., et al.: Pin: building customized program analysis tools with dynamic instrumentation. In: PLDI 2005, pp. 190–200 (2005) 4. Supplee, L.M., et al.: MELP: the new federal standard at 2400 bps. In: IEEE International Conference on Acoustics Speech and Signal Processing, pp. 1591–1594 (1997) 5. Vassiliadis, S., et al.: The Molen polymorphic processor. IEEE Transactions on Computers 53(11), 1363–1375 (2004) 6. Canny, J.: A computational approach to edge detection. IEEE Trans. Pattern Anal. Mach. Intell. 8, 679–698 (1986) 7. Experts, A.A.C.: Cosy: Compiler system, �� !""�����%����" 8. Gohringer, D., et al.: A design methodology for application partitioning and architecture development of reconfigurable multiprocessor systems-on-chip. In: FCCM 2010, pp. 259– 262 (2010) 9. Graham, S.L., Kessler, P.B., Mckusick, M.K.: Gprof: A call graph execution profiler. SIGPLAN Not. 17(6), 120–126 (1982) 10. Hut, P., Makino, J., McMillan, S.: Building a better leapfrog. The Astrophysical Journal 443(2), L93–L96 (1995) 11. Li, Y., Callahan, T., Darnell, E., Harr, R., Kurkure, U., Stockwood, J.: Hardwaresoftware co-design of embedded reconfigurable architectures. In: DAC 2000, pp. 507–512 (2000) 12. Meeuws, R.J.: A Quantitative Model for Hardware/Software Partitioning. Master’s thesis, Delft University of Technology, Delft, Netherlands (2007)
88
S.A. Ostadzadeh et al.
13. Meeuws, R.J., Galuzzi, C., Bertels, K.: High level quantitative hardware prediction modeling using statistical methods. In: SAMOS 2011, pp. 140–149 (2011) 14. Ostadzadeh, S.A., Meeuws, R.J., Galuzzi, C., Bertels, K.: QUAD – A Memory Access Pattern Analyser. In: Sirisuk, P., Morgan, F., El-Ghazawi, T., Amano, H. (eds.) ARC 2010. LNCS, vol. 5992, pp. 269–281. Springer, Heidelberg (2010) 15. Santambrogio, M., et al.: A novel SoC design methodology combining adaptive software and reconfigurable hardware. In: ICCAD 2007, pp. 303–308 (2007) 16. Wang, G., Gong, W., Kastner, R.: Application partitioning on programmable platforms using the ant colony optimization. Journal of Embedded Computing 2(1), 119–136 (2006)