the change proneness of code modeled using class diagrams is lower than that
of code that ... Firstly, our study looks at code churn (the total number of added
and ..... implementation classes that are part of the UML class dia- gram. We run
the ...
The Use of UML Class Diagrams and Its Effect on Code Change-proneness Rut Torres Vargas
Leiden Institute of Advanced Computer Science Leiden, The Netherlands
Ariadi Nugroho
Software Improvement Group Amsterdam, The Netherlands
[email protected]
[email protected]
Michel Chaudron
Leiden Institute of Advanced Computer Science Leiden, The Netherlands
[email protected]
⇤
Joost Visser
Software Improvement Group Amsterdam, The Netherlands
[email protected]
ABSTRACT The goal of this study is to investigate the use of UML and its impact on the change proneness of the implementation code. We look at whether the use of UML class diagrams, as opposed to using no modeling notation, influences code change proneness. Furthermore, using five design metrics we measure the quality of UML class diagrams and explore its correlation with code change proneness. Based on a UML model of an industrial system and multiple snapshots of the implementation code, we have found that at the system level the change proneness of code modeled using class diagrams is lower than that of code that is not modeled at all. However, we observe di↵erent results when performing the analysis at di↵erent system levels (e.g., subsystem and sub subsystem). Additionally, we have found significant correlations between class diagram size, complexity, and level of detail and the change proneness of the implementation code.
Modeling software systems is believed to give benefits in down stream software development in terms of higher software quality and development productivity. Previous works have attempted investigations to validate whether such benefits can be expected from modeling software systems—see for example in [10][3][5][12][11]. This study also aims to investigate the benefits of modeling, which is represented using the Unified Modeling Language (UML). Our study is based on empirical data from industrial software that is currently in its maintenance phase. In this study we focus on two research questions regarding the e↵ect of UML modeling on downstream software development: • RQ1: Does implementation code modeled in UML class diagrams have higher change proneness than not modeled code? • RQ2: How do UML class diagram metrics relate to change proneness of the implementation code?
Categories and Subject Descriptors D.2.8 [Software Engineering]: Metrics—Product Metrics; D.2.10 [Software Engineering]: Design—Methodologies, Representation
General Terms Design, Documentation, Measurement
Keywords Unified Modeling Language, Code Churn, Quality
1.
INTRODUCTION
⇤Joost Visser is also with the Radboud University Nijmegen, The Netherlands
Our study is di↵erent from the aforementioned previous works in two ways. Firstly, our study looks at code churn (the total number of added and changed lines of code in a particular system snapshot) in evaluating the e↵ect of UML modeling. Furthermore, the assessment of code churn is performed across multiple snapshots of a system. Secondly, we propose a di↵erent way of measuring the quality of a UML model, namely by looking at the quality at the diagram level. The rest of this paper is organized as follows. In Section 2, we discuss the goal and the design of the study. In Section 3, we present the results of the study, and in Section 4 we further discuss the results and their limitations. Section 5 discusses related work, and finally in Section 6 we outline conclusions and future work.
2.
DESIGN OF THE STUDY
In this section we discuss the goal and the setup of the study.
2.1
Goal and Research Questions
The goal of this study according to the GQM template [14] can be formulated as follows:
Analyze the use of UML class diagrams for the purpose of evaluating its e↵ect with respect to code change proneness from the point of view of the researcher in the context of an industrial software system Based on the above goal we formulate the following research questions: • RQ1: Does implementation code modeled in UML class diagrams have higher change proneness than not modeled code?
Diagram D1
Code Code_Churn
UML class x UML class y UML class z ....
Implemented class x Implemented class y Implemented class z ....
LOC
value_ccx value_ccy value_ccz ....
value_locx value_locy value_locz ....
Sum_value_cc
Sum_value_loc /
Aggregated Relative Code Churn
UML class diagram metric value
Average Aggregated Relative Code Churn
• RQ2: How do UML class diagram metrics relate to change proneness of the implementation code?
2.2
Measured Variables
In this section we explain the variables measured in our study. It is important to mention that in the measurement of class diagrams, the unit of analysis is diagrams. In the measurement of the code, the unit of analysis is classes (i.e., Java classes).
2.2.1
Measured Variables in RQ1
The design of study to answer RQ1 is a quasi experiment. Quasi experiment is designed to assess causal impact, but it lacks the random assignment to the treatment groups (i.e., in our study it is the assignment of classes to the modeled and not modeled groups). Independent Variable. The independent variable in RQ1 is the use of class diagram (UMLCD). UMLCD is a nominal variable that indicates whether a given class in the implementation code is modeled or not modeled in a class diagram. Hence the value of this variable is either ‘modeled’ or ‘not modeled’. Dependent Variable. The dependent variable is the average relative code churn of an implementation class (AvgRelChurn). Relative code churn of a class is the total number of added and changed lines in a particular class divided by the total lines of the whole system. Because there are multiple versions of the same class, we take the average of relative code churn across versions to represent change proneness in a class. A justification of using relative code churn is reported by Nagappan and Ball [9] who show the superiority of relative code churn metrics over absolute code churn metrics to predict defect density. Although the context of the study conducted by the authors was di↵erent from ours, the use of relative code churn is justifiable. Relative code churn takes into account the size of the code base, hence controlling the e↵ect of system size. This is particularly important because multiple system snapshots will be used in the analysis. Co-factor. Two confounding factors are considered in the analysis, namely code complexity and code coupling. The degree of complexity and coupling of software modules can indicate their change-proneness [2]. As such, we want to control for their e↵ects in order to observe a more pure contribution of using UML class diagrams on code changeproneness. In order to account for the complexity of the source code we take the average percentage of lines of code
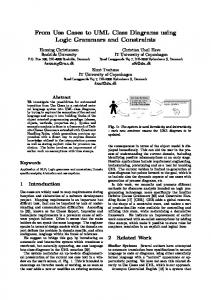
Figure 1: Mapping between class diagrams metrics and the code churn metrics with a McCabe [8] value above 10 as a confounding factor (RiskyMcCabe). In order to account for coupling in the code we take the percentage of lines of code with fan-in value above 16 (RiskyFanIn). Note that all code metrics are calculated automatically using the Software Analysis Toolkit (SAT) developed by the Software Improvement Group (SIG). These metrics are automatically calculated for every snapshot of a system and hence the di↵erences in the code metrics across snapshots can be obtained easily.
2.2.2
Measured Variables in RQ2
The design of study to answer RQ2 is a correlational study. Correlational studies do not aim to establish causal relationships. Therefore, in RQ2 there is no distinction in terms of independent and dependent variables. Based on previous work, we selected five metrics that represent the quality of UML class diagrams. These metrics are calculated automatically using SDMetrics [15]. • Diagram Size (CDSize). Defined as the total number of classes and interfaces in a class diagram. Ambler [1] suggests a rule of thumb that a diagram should contain 7 +/- 2 elements. • Internal Connectivity (CDIntConn). Defined as the percentage of elements that are relations (associations, generalization and dependencies). This metric measures the complexity of class diagrams and is adapted from metric definition of SDMetrics [15]. • Lonely Classes (CDLoneClass). Defined as the percentage of classes that are not connected with any other class/interface in the diagram. This metric measures cohesiveness of class diagrams and is adapted from metric definition of SDMetrics [15]. • Associations Without Role (CDAscNoRole). Defined as the percentage of associations without role name (adapted from [12]). This metric measures the level of detail in class diagrams. • Operations Without Parameters (CDAvgOpsNoPar). Defined as the average percentage of operations without parameters in the classes that are part of the dia-
gram (adapted from [12]). This metric also measures the level of detail in class diagrams. Another measured variable is the average relative code churn (CDAvgRelChurn). This variable measures the average of total code churn over time of a set of implementation classes that are modeled in a single class diagram.
A ~136 KLOC
B ~52 KLOC
C ~133 KLOC
A'
As mentioned previously, the measurement of the code churn is at the class level (Figure 1). Since the class diagram metrics are measured at the diagram level, we follow the next steps to determine CDAvgRelChurn: 1. Map each UML class into the corresponding implementation class.
Figure 3: Division of the system into subsystems
2. Calculate the total code churn and total lines of code of all implementation classes per diagram.
(the striped part) and not modeled classes. The rest of subsystem A, as well as the whole sub-system B and C consist of packages of not modeled classes.
3. Divide the total code churn by the total LOC, resulting in the relative code churn per diagram. 4. Calculate the average of relative code churn over time per diagram (CDAvgRelChurn).
2.3
Analysis Method
To answer RQ1, classes in the implementation code are divided into two groups: modeled and not modeled. Next we compare the AvgRelChurn between the two groups to check whether there is a di↵erence that is statistically significant. We use the Mann-Whitney test to determine the significance of the di↵erence in AvgRelChurn between the modeled and not modeled groups. In order to account for confounding factors, we perform an Analysis of Covariance (ANCOVA) with the complexity (RiskyMcCabe) and coupling (RiskyFanIn) metrics as co-factors. To answer RQ2, we perform a correlation analysis between each class diagram metric and code churn (CDAvgRelChurn). We use the Spearman correlation test because our data is not normally distributed. Finally, we perform a multiple regression to account for code complexity and coupling as co-factors.
2.4
Description of the Case Study
The case study is a system for registering business organizations in the Netherlands. The technical quality of the system started being monitored by SIG in May 2010. The development of the system started around July 2008 and the system went live in May 2010. The developed system is replacing an old system, which is still running in parallel. Currently the new system is in maintenance mode but new functionality is still being transferred from the old version. The system is divided in three sub-systems, which we will call A, B and C. The total LOC for the three sub-systems is around 321 KLOC. The programming language used is Java. In terms of modeling, not all implemented classes were previously modeled in UML. Only 23 class diagrams are available, and all of them correspond to a sub-part of sub-system A. Figure 3 shows the division of the system into three subsystems (A, B, C). Furthermore, sub-system A has a set of 22 packages, which we will call sub-A, consists of modeled
In total there are 100 snapshots of this system in the software repository. Among the code metrics being monitored are code churn, code complexity and coupling.
3. RESULTS 3.1 The Use of Class Diagram and Its Impact on Code Change-proneness The analysis to compare change proneness between the modeled and not modeled classes in the case study is performed at three levels: sub subsystem A’, subsystem A, and the whole system (Figure 3). Figure 2 show the boxplots of AvgRelChurn of the modeled and not modeled for each of the three areas of comparison (sub subsystem A’, subsystem A and system). Looking at the median in Figure 2 (bold horizontal lines), we can observe that in the first two cases (sub-system A’ and sub-system A), on average, modeled classes change more than not modeled classes, while in the third case (system), not modeled classes change more. In order to determine if the di↵erence in AvgRelChurn is significant between the modeled and not modeled classes, we perform the MannWhitney test. The results of Mann-Whitney test show that the di↵erence in AvgRelChurn in the three analyses is statistically significant (p 0.01). However, the fact that modeled implementation classes have higher or lower change-proneness might also be explained by other factors such as the complexity of the code. To account for such confounding factors we conduct an analysis of covariance (ANCOVA) considering the complexity and coupling of the code as co-factors. From the ANCOVA analysis the Modeled/Not Modeled variable is still significant for the sub-system A and system area, but not for the sub-system A’ area. Also, it is important to mention that the RiskyMcCabe metric is not significant in any case, and the RiskyFanIn metric is significant only in the sub-system A area. The di↵erent results about the e↵ect of the use of class diagrams on code change proneness presented above might indicate the influence of sampling. We believe the result
0.015
0.6 0.015
0.010
0.5 0.4
0.010
0.3 0.005
0.005
0.000
0.000
0.2 0.1
Modeled (N=135)
0.0
Modeled (N=140)
Not Modeled (N=520)
Sub subsystem A'
Not Modeled (N=3648)
Subsystem A
Modeled (N=140)
Not Modeled (N=8481)
System
Figure 2: Boxplots of AvgRelChurn comparing modeled and not modeled classes in sub subsystem A, subsystem A, and the whole system
Table 1: Results of the Spearman correlation analyses between class diagram metrics and code change proneness (CDAvgRelChurn) CDSize CDIntConn CDLoneClass CDAscNoRole CDAvgOpsNoPar
r
p-value
-0.476 -0.488 -0.085 0.494 0.241
0.039* 0.033* 0.727 0.031* 0.318
* indicates significance at 0.05 level
that take the whole system into consideration is more reliable because it is based on a larger data set and a more representative sample of implementation classes.
3.2
The Relations between UML Diagram Metrics and Code Change-proneness
We explore the relations between five UML class diagram metrics and change proneness of the respective code, i.e. the implementation classes that are part of the UML class diagram. We run the Spearman correlation test between each one of the selected class diagram metrics and CDAvgRelChurn. The results of the correlation test are shown in Table 1.
The previous correlation analyses do not take into account confounding factors that can influence the change proneness of the code. For this reason, we perform a linear regression analysis taking the code complexity and coupling as co-factors. As with the CDAvgRelChurn metric, we need to aggregate the RiskyMcCabe and RiskyFanIn metric at the diagram level—referred to as AvgRiskyMcCabe and AvgRiskyFanIn respectively. We perform three multiple regression analyses with each of the three UML metrics (CDSize, CDIntConn and CDAscNoRole) as a predictor, and take into account the complexity and coupling of the code in the respective analysis. The results show that only CDSize (p = 0.049) and CDAscNoRole (p = 0.026) remain significant predictors of code churn.
4. DISCUSSION 4.1 Interpretation of Results With respect to RQ1, we observe di↵erent outcomes as a consequence of taking di↵erent scopes of analysis. Going from smaller to larger system scope, we have compared modeled versus not modeled classes at the level of sub subsystem, subsystem, and system (see Figure 3).
At the level of sub subsystem, we have found that there is no significant di↵erence in the average relative code churn of modeled and not modeled classes. This result can be explained by the fact that classes that are part of the same The results of the correlation analyses in Table 1 show there package probably change together. Therefore, the fact that are three significant correlations: a class has been modeled or not will not make a di↵erence in the change proneness of the code. At the level of sub• CDSize correlates negatively with CDAvgRelChurn: system, we found that there is a significant di↵erence in the the bigger the size of a class diagram, the less change average relative code churn of modeled and not modeled prone the implementation classes that are part of that classes. However, modeled classes change more than not diagram. modeled ones. This result contradicts our assumption that • CDIntConn correlates negatively with CDAvgRelChurn: modeled classes will change less due to the positive impact the more complex a class diagram, the less change of modeling on understandability of the system. Higher unprone the implementation classes that are part of that derstandability will lead to a correct implementation from diagram. the beginning that leads to fewer rework. At the system • CDAscNoRole correlates positively with CDAvgRelChurn: level, we have found that there is a significant di↵erence in the more detailed a class diagram is modeled, the less the average relative code churn of modeled and not modeled change prone the implementation classes that are part classes, and not modeled classes change more than modeled of that diagram. ones. This result confirms our assumption that modeled
classes will change less than not modeled ones, but is not consistent with the result from the subsystem level. The di↵erences in the above results can be explained by the representativeness of the classes in the sample. The result of analysis at the same sub subsystem does not show a significant result because the classes are quite similar in type (e.g., data classes), complexity and importance. At the level of a sub system, there might be more diverse class types and hence modeled classes might be the classes that are significantly more important or critical to the system, therefore the higher code churn. At the system level, the diversity of classes is even higher and it is very likely that there are more critical and important classes that are not modeled. This might explain why in the analysis at the system level not modeled classes have significantly higher code churn. Including all classes of the system in the analysis increases the representativeness of the data set and therefore gives more reliable results. With respect to RQ2 our results show that three out of five UML class diagram metrics have significant correlations with the average code churn of the implementation classes. However, after accounting for the e↵ect of code complexity and coupling, only two of those metrics remained significant, namely CDSize and CDAscNoRole. The fact that CDSize metric has a negative correlation with code churn suggests that classes that are part of bigger class diagrams tend to change less often than classes that are part of smaller class diagrams. In the context of software maintenance, this result may not be very surprising. Big class diagrams indicate poor modularization, which typically leads to tightly coupled and incomprehensible classes. It is not uncommon that maintainers tend to avoid changing brittle parts of a system and thus changes are made around these parts instead. However, further validation of this finding is required. With respect to the CDascNoRole metric, the result shows a significant and positive correlation. This finding suggests that classes that are part of less detailed diagrams (in terms of detail in the associations) tend to change more than classes in more detailed diagrams. This finding supports the idea that level of detail in UML diagrams is beneficial to the understanding of the system to be implemented [10]. A higher understandability will lead to fewer changes since the system has been correctly implemented from the beginning.
4.2
Threats to Validity
Construct Validity. The threat to the construct validity in this study is mainly related to the variable chosen to measure change proneness of the code in RQ2. The average relative code churn (CDAvgRelChurn) is measured for a set of implementation classes that appear in a particular class diagram. In this case, we assume that the change proneness of classes modeled in a diagram is influenced by the quality of that diagram. We are aware that this assumption has some limitations, particularly if some classes appear in a class diagram for trivial reasons (they should have been modeled elsewhere). Further investigation is needed to find better ways to map UML diagram quality properties to code quality properties.
Internal Validity. Internal validity in this study comes from di↵erences in the nature of the implemented classes. Even when all classes are part of the same system, some of them can be considered more critical than others and prone to change more. We try to address this threat by taking into account confounding factors such as complexity and coupling of the code. However a future study can go further by asking the development team to classify each class according to its criticality following a predefined scale. Additionally, there are some cases where classes in the UML model can not be mapped to any of the implementation classes. However, in our study this issue does not occur very often and hence is not expected to introduce serious bias. External Validity. Threats to external validity come from the limitation to generalize the results because of the use of a single case study. Although based on a single case study, the use of a real industrial system as a case study increases our confidence about the generalizability of the results. Further replications of this study using more industrial systems will help validate the results. Conclusion Validity. Conclusion validity refers to the ability to draw correct conclusions from an experiment. We have addressed this threat by using carefully selected statistical tests to determine the significance of the results. We have also considered the applicability of each test in order to avoid violation of assumptions.
5.
RELATED WORK
Previous works that looked into the impact of UML documentation on software development have focused primarily on model comprehension and system comprehension—see for example in [4][6][7]. Because the focus of this study is on the e↵ect of UML modeling on software maintenance, in the following passages we focus on previous work that studied the e↵ect of UML modeling on software maintenance. The work by Tryggeseth [13] explored how the use of textual system documentation (requirements specification, design document, test report, user manual) a↵ects the time needed to understand how to perform maintenance tasks. The results show that the time needed is reduced by approximately 20 percent when documentation is available. The work by Arisholm et al. [3] investigated the impact of UML availability on the maintenance of source code. The authors performed two experiments using students with knowledge on UML and programming. The results show that UML has a significant, positive impact to increase the functional correctness of code changes. However in terms of time saving, there were no significant benefits when the time to modify the UML model is included. The work by Fernandez-Saez et al. [5] compared how UML diagrams with di↵erent level of detail influence the maintenance of the source code. The results of the experiment carried out with 11 students showed better results when using low level of detail UML models. The authors however did not consider the results significant due to the small size of the group of subjects and their lack of experience in using UML and Java code.
Another closely related work was performed by Nugroho and Chaudron [11]. The authors investigated the impact of using UML (class and sequence diagrams) on defect density of the implementation code. Based on an industrial case study, the authors found that classes modeled in either class or sequence diagrams have significantly lower defect density compared to classes that are not modeled at all. Another work by the authors defined level of detail metrics for UML class and sequence diagrams [12]. Based on data from an industrial software system, the authors found that higher level of detail in sequence diagrams corresponds to lower defect density in the implementation code. The current paper extends the above previous works by investigating the e↵ect of using UML on code change proneness in an industrial case study.
6.
CONCLUSION AND FUTURE WORK
In this paper we report our exploratory investigation into the impact of the use of UML on the change proneness of the implementation code. Our study aim to answer two research questions: • RQ1: Does implementation code modeled in UML class diagrams have higher change proneness than not modeled code? • RQ2: How do UML class diagram metrics relate to change proneness of the implementation code? To answer RQ1, we compare the average relative code churn of classes that have been previously modeled in class diagrams and those that have not been modeled. This comparison was made at three di↵erent levels: sub subsystem, subsystem and system. At the system level, we have found a significant di↵erence with not modeled classes changing more than modeled ones. However, the results vary according to the level of comparison, which we suspect is due the representativeness of the sample at the respective level. To answer RQ2, we use five UML class diagram metrics defined in previous works and explore their correlations with code change proneness. The five metrics are class diagram size (CDsize), class diagram internal connectivity (CDIntConn), class diagram lonely classes (CDLonClass), class diagram operations without role (CDAscNoRole) and class diagram operations without parameters (CDOpsNoPar). Three of these metrics show significant correlations with the change proneness of the code. After accounting for the e↵ects of code complexity and coupling, only two of the metrics remained significant, namely CDSize (positive correlation) and CDAscNoRole (negative correlation). We are aware that this study requires further validations in future research. An obvious future work is to replicate this study using more industrial systems. Further refinement of this study is to separate the analysis based on diagram types—that is, to evaluate the di↵erence in code churn or other code quality indicators based on the types of diagram used in modeling the system (e.g., class versus sequence diagrams). Finally, we also aim to investigate the e↵ect of UML diagram quality on the productivity in performing maintenance activities such as bug fixing.
7.
REFERENCES
[1] S. Ambler. The elements of UML 2.0 style. Cambridge Univ Pr, 2005. [2] E. Arisholm, L. Briand, and A. Foyen. Dynamic coupling measurement for object-oriented software. Software Engineering, IEEE Transactions on, 30(8):491–506, 2004. [3] E. Arisholm, L. Briand, S. Hove, and Y. Labiche. The impact of uml documentation on software maintenance: An experimental evaluation. Software Engineering, IEEE Transactions on, 32(6):365–381, 2006. [4] L. Briand, Y. Labiche, M. Di Penta, and H. Yan-Bondoc. An experimental investigation of formality in uml-based development. Software Engineering, IEEE Transactions on, 31(10):833–849, 2005. [5] A. Fern´ andez-S´ aez, M. Genero, and M. Chaudron. Does the level of detail of uml models a↵ect the maintainability of source code? In Proceedings of EESSMod 2011, 2011. [6] M. Genero, J. Cruz-Lemus, D. Caivano, S. Abrah˜ ao, E. Insfran, and J. Cars´ı. Assessing the influence of stereotypes on the comprehension of uml sequence diagrams: A controlled experiment. Model Driven Engineering Languages and Systems, pages 280–294, 2008. [7] L. Kuzniarz, M. Staron, and C. Wohlin. An empirical study on using stereotypes to improve understanding of uml models. In Program Comprehension, 2004. Proceedings. 12th IEEE International Workshop on, pages 14–23. IEEE, 2004. [8] T. J. McCabe. A complexity measure. In Proceedings of the 2nd international conference on Software engineering, ICSE ’76, pages 407–, Los Alamitos, CA, USA, 1976. IEEE Computer Society Press. [9] N. Nagappan and T. Ball. Use of relative code churn measures to predict system defect density. In Software Engineering, 2005. ICSE 2005. Proceedings. 27th International Conference on, pages 284–292. IEEE, 2005. [10] A. Nugroho. Level of detail in uml models and its impact on model comprehension: A controlled experiment. Information and Software Technology, 51(12):1670–1685, 2009. [11] A. Nugroho and M. Chaudron. Evaluating the impact of uml modeling on software quality: An industrial case study. Model Driven Engineering Languages and Systems, pages 181–195, 2009. [12] A. Nugroho, B. Flaton, and M. Chaudron. Empirical analysis of the relation between level of detail in uml models and defect density. Model Driven Engineering Languages and Systems, pages 600–614, 2008. [13] E. Tryggeseth. Report from an experiment: Impact of documentation on maintenance. Empirical Software Engineering, 2(2):201–207, 1997. [14] C. Wohlin, P. Runeson, M. Host, C. Ohlsson, B. Regnell, and A. Wessl´en. Experimentation in Software Engineering: an Introduction. Kluver Academic Publishers, 2000. [15] J. W¨ ust. SDMetrics: the Software Design Metrics tool for the UML, 2012.