sors are one of the cutting edge technologies that ... the low level nodes will be sent to the higher layers .... level will be an intermediate value between the ar-.
Threshold Based Data Aggregation Algorithm To Detect Rainfall Induced Landslides Maneesha V. Ramesh
P. V. Ushakumari
Department of Computer Science Amrita School of Engineering Amrita University Kerala, India 690525
Department of Mathematics Amrita School of Engineering Amrita University Kerala, India 690525
Abstract Landslides are one of the environmental disasters that cause massive destruction of human life and infrastructure. Real time monitoring of a landslide prone areas are necessary to issue fore warning. To accomplish real time monitoring, massive amount of data have to be collected and analyzed within a short span of time. This work has developed a method for effective data collection and aggregation by implementing threshold alert levels. The sampling rates of threshold alert levels will determine amount of data collected and aggregated which will reduce the power consumption by each wireless sensor nodes. This work also helps to determine the appropriate sampling rates for each threshold level, and the expected number of data packets in the queue. The time delay in receiving the data packet at the analysis station can be determined by using the value of expected number of data packets in the queue.
1
Introduction
Environmental disasters are largely unpredictable and occur within very short spans of time. Fore warning of environmental disasters is more challenging than other applications due to the fact that they occur within a very short span. Therefore
technology has to be developed to capture relevant signals in a very short span of time. Wireless sensors are one of the cutting edge technologies that can respond to rapid changes of data. The fore warning of an environmental risk can be done if and only if the relevant data within very short time spans are quickly captured with high time resolution, processed and transmitted to the analysis station. Wireless sensor network technology has all the above mentioned capabilities. However, it has its own limitations such as relatively low amounts of battery power and low memory availability compared to many existing technologies. It does, though, have the advantage of deploying sensors in hostile environments with a bare minimum of maintenance. This fulfills a very important need for any real time monitoring. The scenario under consideration for this work is landslides. We aim to deploy wireless sensor networks in a landslide prone area to detect landslides1 . One of the main concerns for the successful implementation of a landslide detection application is how to handle the data packets received from each of the wireless sensor nodes such that an accurate detection of the scenario or event is made 1 This work has been partially funded by the WINSOC project, a Specific Targeted Research Project (Contact Number 003914) co-funded by the INFSO DG of the European Commission within the RTD activities of the Thematic Priority Information Society Technologies.
possible. This paper provides information about a data aggregation technique that can be used for a wireless sensor network deployed to detect rainfall induced landslides. The data packets collected from the deployment site have to be efficiently transmitted and aggregated for good prediction results. This paper introduces one method for data aggregation which uses a threshold alert level to aggregate the data packets. For the case of a wireless sensor network implemented using threshold alert levels, it finds the probability of data packets being in the queue and also the expected number of data packets that will be in the queue at any random time.
2
Landslide Detection Using Wireless Sensor Network
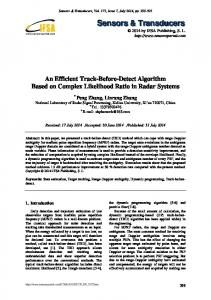
Landslide is a short lived and suddenly occurring phenomena that has catastrophic effects all around the world. India faces landslide every year with an annual loss of about US $400 million. Although there are different types of landslides, this work mainly concentrates on rainfall induced landslides which occur commonly in India. The wireless sensor nodes will be deployed in a landslide prone area. Each of the wireless sensor nodes will be connected to a sensor column (see Figure 1) containing various geophysical sensors. The data from the geophysical sensors will be sampled and collected by the wireless sensor nodes in the lowest layer of the wireless sensor network which has two layer hierarchy with low level nodes and high level nodes. The data packets collected by the low level nodes will be sent to the higher layers for further processing. Each data packet will consist of heterogeneous data received from different geophysical sensors connected to the low level nodes. The information received from basic data analysis of the geo physical sensors in the sensor column includes the time stamp, sequence number of the data packet, sensor data, sensor sensitivity and location. The network contains a two layer hierarchy consisting of a lowest layer which carries out the functions of data collection and transmission to the
Figure 1: Sensor Column
higher layers. The upper layer will aggregate the data and forward it to the sink node. Using a Wi-Fi connection the sink node will then transmit the data to a network server connected to a VSAT network near the deployment site at Idukki, Kerala, South India. The satellite network will transmit the data to a remote data analysis center for further processing. The remote analysis station will be situated at at AMRITA University.
3
Data Aggregation In A Landslide Scenario
Real time applications require continuous monitoring, which in turn generates large amount of data packets for analysis. The data packets generated from the low level nodes have to be efficiently aggregated and analyzed by higher layer nodes to detect or predict any emergence of a critical situation such as a landslide. Threshold alert levels have been used for efficient data aggregation with necessary data.
3.1
Threshold Alert Levels
Threshold based alert levels for the whole network have been devised for minimizing energy consumption and also for efficient data handling. In each of the threshold levels the data packets collected will be sampled at different rates. As the rate of data packet collection and transmission changes the amount of energy drain will change accordingly. Three threshold alert levels have been devised for landslide scenario. They are: • Low alert level: During the low alert level, the external perceived risk is very low. Each sensor node will transit between sleep and monitor states over a relatively longer time interval, Tlow . The rate of data packet transmission from the cluster head to the sink (the α% of total data received by the cluster head from the low level nodes) will be low (approximately 1 − 10%) in this alert level. • Medium alert level: During the medium alert level, the external perceived risk is average. Each sensor node will transit between sleep and monitor states over a medium time interval, Tmedium . The rate of data packet transmission from the cluster head to the sink (the α% of total data received by the cluster head from the low level nodes) will be medium (approximately 50 − 60%) in this alert level. • High alert level: During the high alert level, the external perceived risk is very high. Each sensor node will transit between sleep and monitor states over a shorter time interval, Thigh . The rate of data packet transmission from the cluster head to the sink (the α% of total data received by the cluster head from the low level nodes) will be high (approximately 90 − 100%) in this alert level.
will be converted as a data packet consisting of a maximum of eight heterogeneous data. The data in the data packet will be analyzed using multivariate analysis. The result of the analysis will be compared with a predetermined threshold of the network alert level which is apriori known to the wireless node (The predetermined threshold values will be found using our laboratory experiments and field data.). If the data analysis result provides parameter value more than the predetermined threshold value, then the node will change its state from monitor to active according to the state transition (as shown in Figure 2)developed by Maneesha et.al[1]. Otherwise it will drop the packet and return to sleep state for a period of time determined by the alert level (such as Tlow , Tmedium , orThigh ). The node which has changed its state to active will send a long pulse to wake up all its group members in the same cluster. The cluster members on receiving the wake up call will change their state to active and their data packet will be sent to the cluster head. So continuous sampling of geophysical sensors may not be followed by transmission of the data packets, if the parameter value does not cross the predetermined threshold value. The cluster head will wait to receive the data packets from its cluster members. The cluster head can process each packet arriving from the flow and aggregate them incrementally until they are all processed, as in [3]. However, this will consume more processing power. To avoid that situation and save power, we are employing bulk processing of data.
Data Aggregation Method
As the data packets from the cluster members are received, the cluster head will perform data aggregation algorithm based on multivariate analysis. The aggregated values along with an α% of data ( where α% is some fixed constant percentage for each alert level) received from the low level nodes will be forwarded by the cluster heads to the sink. The sink will not perform complicated data aggregation algorithms. However, the network alert level will determined by the sink node.
As the network initiates each low level wireless node will sample the geophysical sensors attached to the wireless sensor node. The collected data
The amount of data received at the sink will differ since the constant value of α% of data packet will differ with respect to the alert levels and also with respect to the number of child nodes attached
3.2
that landslides may occur in a short span. As a result, a minimum number of data packets will determine the transition from medium alert to high alert. The exact values of the ratio of data packets that recommend for an alert change from one alert level to another will be determined through simultion, laboratory experiments, and the collection of field data. The alert level of the network will change if the ratio of data packets recommending the change of alert level is greater than or equal to the pre determined ratio determined from continuous simulation and laboratory tests. Otherwise it will remain in the same alert level. The alert level change means all wireless sensor nodes in the whole wireless network will change their alert level. Due to an alert level transition, low level nodes have to change the sampling rate of the geophysical sensors and also the existing predetermined threshold value to the new alert level’s predetermined threshold value.
Figure 2: Low Level Node State Transition
to each cluster head. The sink node will determine the ratio of the data packets which is defined as the number of data packets recommending an alert change divided by the number of data packets total. If this ratio exceeds certain thresholds, the alert level can change. The state of the network will thereby alter according to the ratio of the data packets that have recommended an alert level change. The entire wireless network can therefore change its threshold alert level from one state to another. The alert level change of the whole network from high to low is a very rare change. As a result, the change from high to low alert level for the whole network will occur if and only if the maximum number of data packets show such a result is necessary. The alert level change from medium to high has to be decided very rapidly due to the fact
The frequency of data transmitted in each alert level is different. In the high alert level, the arrival rate at the cluster head and sink node will be a maximum while the arrival rate at the low alert level will be a minimum. That of the medium alert level will be an intermediate value between the arrival rates of the high and low alert levels. This makes the whole arrival pattern non-homogeneous and also these different rates of transmission of data packets will contribute towards minimizing the whole network’s energy consumption, which will in turn reduce the number of data packets to be processed by the whole network for a random amount of time. The data packets to be processed for a random amount of time will be determined mainly by the threshold levels. Therefore the energy used by the whole network will be much less compared to that used by a network that is active through out the deployment. The data aggregation for the whole network consists of a three level aggregation algorithm. The three levels has been discussed earlier are at low level nodes, cluster heads, and sink node. The three level data aggregation algorithm will reduce the amount of multivariate analysis to be performed for the whole network. Initially, in low level nodes, the multivariate analysis will be performed and the
data, along with the result will be saved in a buffer. The multivariate analysis will not be performed for the next data set. It only determines the difference with the previous data. As a result, at each point in time, the buffer will have one data packet (initial or fresh data from just after a whole network alert level transition), the node’s result of multivariate analysis and the latest data. Once the difference reaches the threshold, the node will wake up all its cluster members. All of the cluster members will then send the data packet to the cluster head and multivariate analysis will be performed for the group of data. Thus, it is not necessary to perform multivariate analysis for each and every data arrival at low level nodes. This will reduce the energy consumed for data processing which will in turn reduce the network level energy consumption.At the sink node, multivariate analysis is not performed. It determines the ratio of data packets that recommend transition to a new alert level. This is a simple operation that consumes very little processing power.
4
Data Aggregation in a Subtree
A subtree considered for our study consists of child nodes connected to a cluster head, i.e., the subtree will have only single hop data packet transmissions. The arrival pattern of data packets to the cluster head are different with respect to each alert level. The amount of data packets waiting for service will change according to the arrival rate transition. This will become a critical parameter for any real time application because if the queue size exceeds the buffer size then data loss will occur. The arrival rate which causes data loss is not an efficient one since the purpose of data aggregation is not attained and also energy is lost collecting and transmitting the data. Energy consumption minimization and efficient data aggregation can be performed if the monitoring application is aware of the optimal arrival rate, queue length, waiting time, etc. This will help to avoid data packet and energy loss. Data arrival to the cluster head can be modeled as a non-homogeneous Poisson process with arrival rate λ(t), at time t. The network of child nodes connected to a cluster head can be treated as
a M/M/1 queue with N-Policy. The service time needed by a cluster head is exponential with rate of service µ. The cluster head starts servicing whenever data from all or a percentage of the child nodes (Ng ) arrive at time t or whenever Ng (> 1) units accumulate in the queue. Otherwise the cluster head will be in a sleep state. (A cluster head uses only three state transitions. It does not use the monitor state). As soon as the service of one batch is over, the cluster head will continue the data aggregation if there exists Ng waiting data. Otherwise the cluster head will change its status to sleep state and starts the processing of data when Ng data accumulate in the queue. Any new arrival after Ng waiting data will be lost to the system with probability 1. Let X(t) denote the number of data packets in the queue at time t. Let Y (t) denote the state of the cluster head. Then X(t) has the state space {0, 1, 2, ..., Ng − 1, Ng } and Y (t) can be defined as ( 1, if theclusterheadisbusy Y (t) = 0, if theclusterheadisidleorsleep Then the process Z(t) = {(X(t), Y (t)) ; t ≥ 0}
(1)
is a non-homogeneous birth/death process over the state space E = {0, 1, 2, ..., Ng − 1} × {0, 1} ∪ (Ng , 1). To study the process Z(t), define Pij (t) = P r {(X(t), Y (t)) = (i, j)} , (i, j) ∈ E (2) The Forward Kolmogorov Differential Difference Equations associated with Z(t) are the following: d P00 (t) = −λ(t)P00 (t) + µP01 (t) dt
(3)
d Pi0 (t) = −λ(t)Pi0 (t)+λ(t)Pi−10 (t)+µPi1 (t) dt (4) where i = 1, 2, ..., Ng d P01 (t) = − (λ(t) + µ) P01 (t)+λ(t)PNg −10 (t)+µPNg 1 (t) dt (5)
d Pi1 (t) = − (λ(t) + µ) Pi1 (t) + λ(t)Pi−11 (t) dt (6) where i = 1, 2, ..., Ng − 1 d PN 1 (t) = −µPNg 1 (t) + λ(t)PNg −11 (t) (7) dt g
The solution to the equation 11 will provide the probability at a time t. Using the probability, the expected number of data packets in the queue can be found as follows: Expected number of data packets in queue when the cluster head is in the sleep state is given by:
In matrix notation, Equations 3 to 7 can be written as 0 P (t) = T P (t) (8)
Ng −1
E [x/Y (t) = 0] =
X
iPi0
(12)
i=1
with P (0) = P0 where The expected number of data packets in the queue � � P (t) = P00 (t) , · · · , PNg−1 0 (t) , P01 (t) , · · · , PNg 1 (t)when the server is busy is given by: is a matrix of order (2Ng + 1)×1 with its derivative � � 0 d d d P (t) = P00 (t) , P10 (t) , ....., PNg 1 (t) dt dt dt and P0 is a vector with initial condition P0 = (1, 0, 0, ..., 0), which means initially there are none in the system. T is a (2Ng + 1) × (2Ng + 1) rate matrix. The rate matrix T (5 x 5)is given by
−λ (t) 0 T = µ 0 0
λ (t) −λ (t) 0 µ 0
0 λ (t) −µ − λ (t) 0 µ
0 0 λ (t) −µ − λ (t) 0
0 0 0 λ (t) −µ (9)
0
P (t) = T P (t) has the unique solution.
Ng −1
E [x/Y (t) = 1] =
(10)
which can be computed as tT
P (t) = Ce C
−1
P0
(11)
where A = C −1 T C is the Jordan Canonical form of T. To find C −1 T C, the characteristics of T can be computed by diagonalizing the T matrix. Thus we get the characteristic roots as λ1 , λ2 , ..., λ2Ng and 0. Using these roots, compute the invertible matrix C such that C −1 T C is the Jordan Canonical form of T.
iPi0
(13)
i=1
Thus, the expected number of data packets in the queue at any random time is given by: E [x] =
1 X
E [x/Y (t) = j] P (Y (t) = j)
j=0
E [x] = E [x/Y (t) = 0] P.0 + E [x/Y (t) = 1] P.1 (14) where P.0 is the probability of the cluster head being in the sleep state,P.1 is the probability of the cluster head being in the busy state.From the above results, we will be able to find the different arrival rates, the waiting time distribution, etc.
5
P (t) = P0 etT
X
Data Aggregation from the Cluster heads to a Sink Node
Let the sink node be connected to Nc cluster heads. The data packets from the cluster heads have to be collected, analyzed and forwarded to the satellite network by the sink node. Each cluster head, after completing its multivariate analysis for a group of data at time t, will transmit an α% of data packets received from the low level nodes and the result of the analysis to the sink node. The number of data packets sent from each cluster head differs with respect to the alert level and also with respect to the number of child nodes attached to the
cluster head. Therefore, the number of data packets arriving at the sink node from each cluster head will differ. The sink will maintain one queue for each of the cluster heads since it has to handle more than one data packet from each of the queues at a time t. As a result, if you have Nc cluster heads, the sink will maintain the same number of queues. The sink has to receive and analyze the data in bulk, as a α% = n of the number of data packets, from each queue and then determine the ratio of data packets recommend for state transition. If the ratio of data packets recommended for the transition is greater than the ratio shown in Table ??, then the whole network will change the alert level, otherwise the alert level remains the same.
6
Conclusion and Future Work
This paper discusses data aggregation in a wireless sensor network, in particular the network used for the landslide scenario. It discusses the different steps needed for data aggregation, the expected number of data packets in the queue, and their arrival rates. The advantage of this algorithm is that it reduces the amount of energy consumed by the whole network as well as helps in finding the arrival rate of data packets. This work will be tested in our laboratory set up, through wireless network simulators, and through the study of field data. In the future, this work will be extended to predict the arrival rates to be adopted for a landslide scenario at the cluster head level and at the sink node level. This work can be extended to determine bounds on the number of intermediate nodes if the number of low level nodes is known. It can also be extended to study the delay incurred for data analysis with respect to each arrival rate, with respect to changes in the density of the network, and with respect to other factors that have a direct effect on predicting any real time scenario.
References [1] Ramesh. Maneesha., Raj. Rehna., Freeman. Joshua., Kumar. Sangeeth., Rangan.
Venkat.,Factors and Approaches for Energy Optimized Wireless Sensor Network to Detect Rainfall Induced Landslides, International Conference on Wireless Networks, WORLDCOM-07, Las Vegas, USA, Jun 2007. [2] Terzis. Andreas., Anandarajah. Annalingam., Moore. Kevin., Wang. I-Jeng.,Slip Surface Localization in Wireless Sensor Networks for Landslide Prediction, IPSN’06, USA, April 19-21, 2006. [3] Akkaya. Kemal., Younis. Mohamed., Youssef. Moustafa.,Efficient Aggregation of Delay-Constrained Data in Wireless Sensor Networks, Department of Computer Science and Electrical Engineering, University of Maryland. [4] Zhang. Honghai., Hou. C. Jennifer.,On the Upper Bound of α-Lifetime for Large Sensor Networks,ACM Transactions on Sensor Networks, Vol. 1, No. 2, Pages 272 - 300, November 2005. [5] Lindsey. Stephanie., Raghavendra. Cauligi.,Sivalingam. Krishna.,Data Gathering in Sensor Networks using the Energy∗Delay Metric,Proceedings of the 15th International Parallel and Distributed Processing Symposium, IEEE, 2001 [6] Medhi, J., Stochastic Models in Queuing Theory, Academic Press, An Imprint of Elsevier., 2nd edition, 2003.