Aug 29, 2007 - ABSTRACT. We analyze the effect of thermal constraints on the performance and power of multi-core processors. We propose system-level ...
Throughput of Multi-core Processors Under Thermal Constraints ∗
Ravishankar Rao, Sarma Vrudhula, and Chaitali Chakrabarti Consortium for Embedded Systems Arizona State University Tempe, AZ 85281, USA {ravirao,
vrudhula, chaitali}@asu.edu
ABSTRACT We analyze the effect of thermal constraints on the performance and power of multi-core processors. We propose system-level power and thermal models, and derive expressions for (a) the maximum number of cores that can be activated, with and without throttling, (b) the speedup (multi-core over single core), and the total power consumption, both as functions of the number of active cores. These expressions involve parameters like power per core, thermal resistance of hottest die block and package, and leakage dependence on temperature. We also computed the above metrics (a) and (b) numerically by solving the detailed Hotspot circuit of an multicore processor driven by a block-level exponential temperaturedependent leakage model. When compared to these numerical results, we found that the above expressions for (a) were at most 8% underpredicted, while those for (b) were accurately predicted. The proposed analytical approach is the first of its kind to relate metrics of interest in multi-core processors to high-level design parameters. Compared to numerical approaches, it provides much faster computation time, and valuable insight for processor designers.
Categories and Subject Descriptors B.8.2 [Performance and Reliability]: Performance Analysis and Design Aids; C.4 [Computer Systems Organization]: Performance of systems—Modeling Techniques
General Terms Design, Performance, Theory
Keywords multi-core processors, thermal management, speedup, throughput, power, leakage dependence on temperature
∗ This work was supported by the Consortium for Embedded Systems at Arizona State University and by National Science Foundation grants ITR-0205227 and CNS-0509540.
Permission to make digital or hard copies of all or part of this work for personal or classroom use is granted without fee provided that copies are not made or distributed for profit or commercial advantage and that copies bear this notice and the full citation on the first page. To copy otherwise, to republish, to post on servers or to redistribute to lists, requires prior specific permission and/or a fee. ISLPED’07, August 27–29, 2007, Portland, Oregon, USA. Copyright 2007 ACM 978-1-59593-709-4/07/0008 ...$5.00.
1.
INTRODUCTION
Multi-core processors and challenges. Technology scaling continues to make more transistors available within the same die area. Traditionally, these transistors made up a single processing unit. With each technology generation, the processor’s performance improved significantly as a result of scaling the clock frequency. However, the cubic power-speed relationship and the resulting thermal issues made this scaling strategy unsustainable. This led processor designers to pursue alternate ways to utilize the extra transistors to get more performance for the same power. They found that by dividing the available transistors into multiple processing cores, which were each clocked lower than a comparable single-core processor, the total power consumption could be kept roughly the same while allowing increased total performance, especially for multi-threaded workloads [1]. Today, increasing the number of cores per die has become the new “scaling” strategy, with quad-core processors already on the market and massively multi-core architectures expected in the near future [2]. Multi-core processors however, present significant new challenges to processor designers, especially in terms of performance-powerthermal tradeoffs. As cooling and packaging technology does not scale with device technology, they continue to limit the total power consumption of a multi-core processor. This restriction on the power per core could require the maximum clock frequency per core to be reduced, which is detrimental to the performance of single-threaded workloads. Existing multi-core processors use a fixed maximum clock speed per core regardless of the number of active cores. This strategy is unable to utilize the power slack when all cores are not active. One solution that could be adopted in future multi-core processors is to make the maximum clock frequency a function of the number of active cores. For workloads with one or only a few threads, a small number of cores could be turned on and operated at large speeds. For more parallel workloads with many threads, more cores would be active, but they would each have to run at smaller speeds to meet the thermal constraints. Amdahl’s law suggests that the performance speedup (multi-core over single-core) of multi-threaded workloads does not scale linearly due to sequential code sections. But, the above discussion suggests that even for totally parallel workloads, the speedup may still not scale because of thermal constraints.1 This then makes it very important to understand the relationship between metrics like speedup S, total power consumption P of a multi-core processor and the number of active cores Na . It is also useful to quantify the 1 We found that for sufficiently high power values, the speedup can actually decrease when many cores are activated.
effect of design parameters like package thermal resistance, floorplan, leakage power per core, etc. on this relationship. Knowledge of this relationship would allow making early design choices (e.g. cooling technology, placement of hot blocks) that achieve a target performance and power profile. It would be particularly insightful if these relations S(Na ) and P(Na ) could be expressed analytically.
Need for system-level models. The nature of this relationship is however, not well understood even for the dual and quadcore processors on the market today. Designers mostly rely on projections obtained from detailed cycle-accurate power-performancethermal simulation. This approach is very time consuming even for single-core processors, and is forbidding for multi-core processors. While it is indispensable for micro-architectural studies, it provides little analytical insight at the system level. Deriving closed form expressions like those mentioned above necessitates using simple power/performance/thermal models. Researchers have proposed high-level models and used them to obtain analytical results or heuristics for thermal management [3– 8]. However, most of these works did not address multi-core processors and they all use very simple power/thermal models which do not capture some or all of the following important effects: (a) the variations of power-density over different chip blocks, which leads to hotspots (see [9]), (b) leakage dependence on temperature (LDT), which is significant for 65 nm and beyond (see [5, 10]), and (c) the contrast in the thermal response times of the die and package. For example, [3–7] use a single thermal resistance and capacitance (which cannot model (c)), while [3, 4, 6, 7] modeled only the full-chip power (which ignores (a)), and [4, 6–8] neglect (b). Architectural-level power models like [5, 11] and thermal models like Hotspot [9] are able to accurately model these effects, but they are better suited for simulation than analysis. For an N-core processor, Hotspot presents a thermal RC circuit of order 20N+11. Further, the power consumption (input to the RC circuit system), is an exponential function of the die temperature (system state). To obtain the power and temperature of the die, one then needs to solve 20N+11 coupled non-linear differential equations, which cannot be done analytically even for N = 1. Hence, we need power/thermal models that account for effects (a)–(c) with reasonable accuracy, and scale easily for multi-core processors. Such models must also be technology-independent so they can be used, for example, to obtain performance projections for different processors in a technology roadmap. They must be simple enough to not need numerical methods. We propose models that meet these requirements.
Static and dynamic thermal management. Thermal management of processors has been studied mostly at the packaging and micro-architecture levels. With the former, the goal is to develop chip packages and cooling mechanisms that can safely dissipate a predefined power budget (called the thermal design power (TDP)) in the steady state. This design is inherently fixed; it is based on steady state analysis and does not adapt to run-time variations in processor power.2 If some (combinations of) workloads consume more power than the TDP, the processor is dynamically throttled to keep the chip temperature below a safe threshold. This mechanism is called dynamic thermal management (DTM). Micro-architectural studies like [9, 12, 13] have explored various DTM techniques like feedback control, local vs global voltage/frequency control, etc. They try to adapt the throttling to the time-varying processor workload to minimize the resulting perfor2 Even variable speed cooling fans will have to operate at full speed if power consumption reaches TDP.
mance loss. Our work forms a middle ground between these approaches and could be considered static thermal management. We examine the effect of design parameters like the package thermal resistance, leakage power per core, etc. on metrics of interest like the (steady state) speedup and power consumption as a function of number of active cores. In computing these metrics, we account for both, the fixed relationship between power and temperature determined by the packaging, and the control of power consumption through processor throttling and turning off cores.
Main contributions. We studied existing detailed power [5] and thermal [9] models, made many careful approximations, and then extended them to a multi-core framework. The resulting system level power and thermal models account for effects (a)–(c) mentioned before, and yet, are simple enough to be analytically tractable, even for large numbers of cores. Using these models, we first developed a method to remove the circular dependency between leakage power and temperature. This allowed us to derive closed form expressions for the steady state temperature of each chip block and the package. We then derive the following expressions: (1) the maximum number of cores that can be activated, both with, and without throttling, in the steady state, (2) the steady state speedup and total power as a function of the number of active cores. The above expressions contain several parameters of interest to a system designer like the static and dynamic power consumption (for hottest block and for full chip), the vertical thermal resistance of the hottest block, the leakage sensitivity to temperature, the chip threshold temperature and the ambient temperature. We setup a simulation framework to compute the steady-state speedup and power of a multi-core processor using the low-level power and thermal models from [5, 9]. We then compared the resulting metrics to that predicted by the proposed closed form expressions, and found good agreement (worst case error: 8%). The proposed model accurately accounts for the important power/thermal effects, but has the advantage of analytical insight and faster computation speed.
2.
SYSTEM MODEL
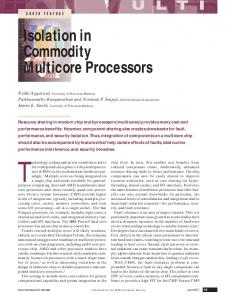
We model a multi-core processor as a set of N identical cores on a die, with each core having M functional unit blocks. Like Hotspot [9] we assume that each block has uniform power density over its die surface. Multi-core processors are often marketed as offering up to N times greater throughput for jobs that can be parallelized. However, we show that thermal limits can negatively affect speedup, and cause the maximum speedup to be less than N, even for completely parallel workloads. To demonstrate this behavior, we assume our workload consists of identical independent threads, with each active core of the processor executing one thread. For such a workload, we define the speedup S(Na ) as the ratio of the throughput (total retired instructions per second over all cores) achieved with Na active cores, to that with one active core. As our interest is in steady state performance and power, average values are assumed for the instructions per clock cycle (IPC) and power consumption of each job. Since the cores are identical and execute identical threads, their steady state power and thermal profiles would be approximately the same. Hence, we assume that each active core is throttled by the same amount (global throttling policy) to satisfy thermal constraints. We chose dynamic frequency scaling (DFS) as the throttling mechanism, for which, the steady state throughput and dynamic power per core are proportional to the normalized clock speed s. As this is also true for most other throttling mechanisms [13, 14] like clock duty ratio variation and
Core N Core 2 Core 1 Die
Block i
P1 T1
Pi
R1
Ri
PM TM
Ti
Package Cp
Rl
Tp Rp
Internal Ambient
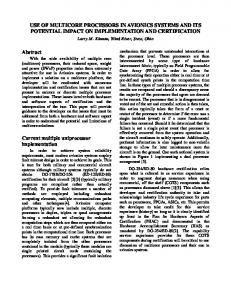
Figure 1: High-level thermal model of a multi-core processor. fetch throttling 3 , the assumption of DFS is quite general. The normalized clock speed s is assumed to be continuously variable from a specified minimum speed smin to 1. As the amount of throttling varies with the number of active cores, s is a function of Na . Finally, assuming that no throttling will be needed for Na = 1, the speedup S when Na cores are active is given by Na s(Na ).
Thermal model. We developed a high-level thermal model based on the Hotspot thermal RC circuit model [15]. Hotspot uses an analogy between electrical circuit phenomena and heat transfer phenomena. It divides the processor die and package into multiple blocks. The flow of heat between the blocks modeled through connecting thermal resistances, and the heat storage in the blocks by thermal capacitances. The power consumed by each chip block (which typically corresponds to a functional unit) is modeled by a current source. The chip bottom connects to the package (modeled with 10 blocks), which then connects to the convective cooling mechanism (a single block). For a processor with 20 functional blocks, the resulting thermal equivalent circuit is of order 20N + 11 (equals 171 for eight cores). We analyzed the parameters of the Hotspot equivalent circuit for the Alpha 21264 floorplan, and we found that: (1) The thermal resistance Rconv and capacitance Cconv of the cooling system are much larger than that of the other units in the package. Hence, we modeled the package and cooling system as a single lumped block. (2) The lateral resistances between chip units were at least four times larger than the vertical resistances that connected chip units to the package, i.e. most of the heat flows vertically in the silicon die. Hence, we neglect lateral resistances on chip. Note that this assumption does not eliminate the occurrence of hotspots/thermal gradients as they are mainly caused by differences in power density among chip blocks, and are affected to a lesser extent by lateral heat flow between them. (3) As our work focusses on steady state conditions, we ignore all thermal capacitances. However, we did use them to remove the circular dependency between leakage power and die temperature, which we discuss later. Figure 1 shows the resulting reduced-order thermal RC circuit. The package and cooling system (henceforth called the package) is modeled by a first order RC circuit, with the resistance and capacitance values R p and C p obtained by a model order reduction of the corresponding Hotspot blocks. Each chip block i is modeled 3 The exception is Dynamic voltage and frequency scaling (DVFS), which is often not preferred for DTM [14].
by a current source Pi (representing its power consumption) and a thermal resistance Ri (representing conduction vertically). The values for Ri were set to the vertical resistance connecting each chip block to the spreader top in the original Hotspot circuit. The voltage across the capacitance C p (Ci ) is the temperature (relative to the internal ambient) of the lumped package Tp (ith chip block Ti ).
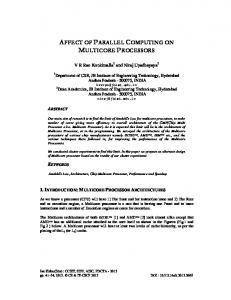
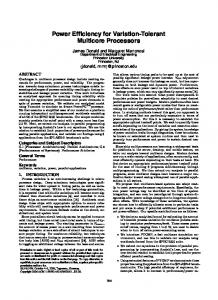
Power model. The power consumed Pi by block i of an active core has two parts, dynamic and static. The dynamic power at speed s is given by sPd,i , where Pd,i is the dynamic power at full speed s = 1. The static power Ps,i is, in general, an exponentially increasing function of the temperature of the block Ti [5, 11]. Thus, the block power is a function Pi (s, Ti ) of the core speed and block temperature. To simplify our analysis, we approximate the nonlinear relationship Ps,i (Ti ) with a 2-piece linear function: ( Ps,i,mid − ki,1 (Tmid − Ti ) , 0 ≤ Ti ≤ Tmid , Ps,i (Ti ) = (1) Ps,i,max − ki,2 (Tmax − Ti ) , Tmid < Ti ≤ Tmax . Here, the 0 temperature limit represents the internal ambient, and the Tmax limit, the maximum permissible die temperature. Tmid is a temperature lying between these extremes. Ps,i,mid and Ps,i,max are the static power values Ps,i (Ti ) at Tmid and Tmax , respectively. Figure 2 shows the total power consumption as a function of die temperature of a single core processor for 65 nm technology computed using the power models in [5]. For one of the profiles, the corresponding linear approximation is also shown for comparison. To determine which of the two regions to use in computing Ps,i , one must know the block temperature Ti , but this again depends on Ps,i . We show in Section 3 how this circular dependency can be removed to compute both Ps,i and Ti in terms of the coefficients ki . The resulting expressions are used to compute Ps,i and Ti by first assuming that Ti is in a particular region (say (Tmid , Tmax ]) and using the corresponding coefficients (ki,2 , Ps,i,max ). If the calculated value of Ti is in fact in the other region, Ti and Ps,i are recomputed using the coefficients of that region (ki,1 , Ps,mid ). In the interest of clarity and brevity, the rest of the analysis assumes that all die temperatures are in the range (Tmid , Tmax ]. It is to be understood that the procedure mentioned above is to be used to determine the correct set of coefficients in each of the resulting expressions.
3.
PRELIMINARY RESULTS
In this section, we obtain preliminary results, which we will then use to find the main results in Section 4. First, we remove the circular dependency between leakage power and temperature by expressing both of them in terms of the package temperature. We then redefine certain groups of parameters into “apparent” static and dynamic powers and use them to compute the steady state package temperature. Finally, we show how the hottest block in a chip can be computed statically for a given power profile.
Decoupling leakage and chip temperature. From the thermal RC circuit in Figure 1, Ci
˜ Ti (t) − Tp (t) ˆ dTi (t) =− + sPd,i + Ps,i,max − ki (Tmax − Ti ) . dt Ri
For the Alpha 21264 thermal circuit, the largest time constant for any chip block was 10 ms while that of the package was 57 s. This is true in general for most processors, because the small die volume is unable to store as much heat as the large package, and hence responds faster to changes in power. Due to this relatively large package time constant, Tp (t) changes much slower than Ti (t). So, we can assume Tp to be a constant parameter and solve the above
first order linear differential equation in closed form to get Ti (t) = Ti (0)e−βi t +(αi /βi )(1−e−βi t ), where αi = (1/Ci )(Ps,i,max −ki Tmax + sPd,i +Tp /Ri ) and βi = (1/Ci ) (1/Ri −ki ). If ki > 1/Ri for any chip block, that block will experience thermal runaway. Assuming the chip design ensures no thermal runaway for Ti ≤ Tmax , we proceed to rewrite the expression for Ti as follows 0 0 Ti = αi /βi = ζi Tp + (Ps,i + sPd,i )Ri ,
where
(2)
0 , ζ (P ζi , 1/(1−ki Ri ) (leakage power factor), Ps,i i s,i,max −ki Tmax ) 0 (apparent static power) and Pd,i , ζi Pd,i (apparent dynamic power). Substituting for Ti in the earlier expression for Ps,i , we now get the total power for block i independent of its temperature Ti : 0 0 Pi = Ps,i + sPd,i + (ζi − 1)Tp /Ri .
(3)
The die static power still depends on temperature, but of the common package instead of the respective block’s temperature.
Steady state package temperature. We are now ready to compute the package temperature Tp,ss in steady state assuming Na cores are operating at speed s. We first define the total apP 0 0 parent static and dynamic power per core as Ps0 , M i=1 Ps,i , Pd , PM PM 0 i=1 (ζi − 1)/Ri which has units i=1 Pd,i . Also, we define G , of thermal conductance. We then have from Figure 1 that Tp,ss = “ P ” ` 0 ´ 0 + GT Na M P R = N R P + sP p a p p,ss . Rearranging, we have i s i=1 d Tp,ss =
` 0 ´ Na Ps + sPd0 R p . 1 − GR p Na
obtain the steady state die temperature for block i as ` 0 ´ Na ζi P + sPd0 R p , 1 − GR p Na s
(5)
which is a function of the global core speed s. The hottest block h is defined as the one that maximizes Ti,ss over i = 1, . . . , M. In general, different blocks within a given core can become the hottest depending on the speed. However, we have found that the block that is hottest at s = 1 remains the hottest at all speeds, for the following reason. Typically, if block i has greater static power than block j, it also has greater dynamic power (at s = 1). This tends to maintain the same ordering among chip blocks in terms of total power (and hence temperature) even if the speed s is varied.
4.
MAIN RESULTS
In this section, we first obtain the maximum number of cores that can be activated, both with throttling Nm and without throttling Nc . For the case Na > Nc where throttling is required, we then compute the required speed s∗ required to run Na cores simultaneously within the thermal limit. This gives us the total speedup S = Na s∗ . Finally, we derive the total power P(Na ).
Maximum active cores without throttling. When Nc cores are running at full speed s = 1, we must still have the hottest chip block temperature lower than Tmax . Using (5), we have “ ” 0 0 Th,ss = Ps,h + Pd,h Rh +
` 0 ´ Nc ζh P + Pd0 R p ≤ Tmax . 1 − GR p Nc s
In the above equation, b c is the floor function. We will henceforth call Nc the critical number of active cores.
Maximum active cores with throttling. In a well-designed multi-core processor, all N cores can be activated if they are sufficiently throttled. For certain power/thermal parameters (e.g. high leakage), this may actually not be possible. We now obtain the maximum number of cores Nm that can be activated with throttling. When Nm cores are running at the least supported speed smin , we must have the hottest chip block temperature lower than Tmax : “ ” ` 0 ´ Nm ζh 0 0 P + smin Pd0 R p ≤ Tmax . Th,ss = Ps,h + smin Pd,h Rh + 1 − GR p Nm s We then solve the above inequality for Nm : “ ” 7 6 7 6 0 +s 0 Tmax − Ps,h min Pd,h Rh 7 6 5. ” i h “ Nm = 4 ` ´ 0 0 0 0 ζh R p Ps + smin Pd R p + Tmax − Ps,h + smin Pd,h Rh GR p Processor designers can use estimated power/thermal parameters to compute Nm and ensure that it is no smaller than N.
Speedup with Na active cores. For all Na > Nc , some throt(4)
Identifying the hottest chip block. Using (2) and (4), we 0 0 Ti,ss = (Ps,i + sPd,i )Ri +
We then solve the above inequality for Nc : “ ” 6 7 6 7 0 + P0 Tmax − Ps,h 6 7 d,h Rh 5 . (6) 4 “ ” i Nc = ` ´ h 0 0 0 0 ζh R p Ps + Pd + Tmax − Ps,h + Pd,h Rh GR p
tling will be required, and to maximize the throughput, the throttled speed s∗ should be chosen just small enough to keep the hottest block h of each core below Tmax . We then have Th,ss = Tmax , when s = f (say), or, using (5): “ ” ` 0 ´ Na ζh 0 0 Th,ss = Tmax = Ps,h + f Pd,h Rh + P + f Pd0 R p . 1 − GR p Na s We can then solve the above equation for f to get h “ ” i 0 R − N ζ R P0 + T 0 Tmax − Ps,h a h p s max − Ps,h Rh GR p h h i . f (Na ) , 0 R + N ζ R P0 − P0 R GR Pd,h a h p d p h d,h h (7) Combining this result with the no throttling case, we have ( 1, Na ≤ Nc , ∗ s (Na ) = (8) f (Na ), Na > Nc . The speedup is then simply S(Na ) = Na s∗ (Na ).
Total power with Na active cores. Suppose Na cores are operating at speeds s∗ (Na ). We use (3) and (4) to find the power consumed by block i in each core: " ` ´ # ζi − 1 Na Ps0 + s∗ (Na )Pd0 R p 0 ∗ 0 Pi (Na ) = Ps,i + s (Na )Pd,i + Ri 1 − GR p Na The total power consumed over all active cores and blocks is P(Na ) = P Na M i=1 Pi (Na ). After some algebra, P(Na ) reduces to » – Ps0 + s∗ (Na )Pd0 Tp,ss (s) P(Na ) = Na = . (9) 1 − GR p Na Rp s=s∗ (Na ) We note from (9) that for Na ≤ Nc , s∗ (Na ) = 1, and P(Na ) is proportional to Na /(1 − GR p Na ), which can be shown to be an increasing
Total power consumed (W)
ALPHA 21264
150
(1) High Pd, High Ps
140
(3) Low P , Low P
Single-core Floorplan
(2) Low Pd, High Ps d
130
Speed
Number of active cores
Dynamic power model
Static power model
s
PWL approx. for (1)
120
EXP LDT
Multi-core Floorplan
110
Nonlinear circuit solver
100 90
Thermal RC circuit
80
CAPS = 0
Steady state power and temperature of each block of each core
70 40
50
60 70 80 90 Die temperature (C)
100
110
Figure 3: Numerical computation of steady state power and temperature using detailed Hotspot and exp. LDT models. 9
Figure 2: Power profiles P1 (T ) of a single-core processor for different values of static and dynamic power.
8
convex function of Na (for Na < 1/(GR p )). This is unlike the total throughput S(Na ) which is linear in Na for Na ≤ Nc . This is because increasing the number of active cores results in a greater package temperature due to (4), which then causes each core’s leakage power to increase due to LDT according to (3).
Total speedup S
7 6
(1) Analytical (1) Numerical (2) Analytical (2) Numerical (3) Analytical (3) Numerical
5 4 3
5.
RESULTS
Model data. We took the single-core Alpha 21264 EV6 floorplan from [9], scaled its dimensions to create N copies that fit within the same area as the original single-core processor. For this N-core floorplan, Hotspot [9] computes the equivalent thermal RC network. We then applied the approximations mentioned in Section 2 to this Hotspot circuit and obtained our high-level thermal model. We set the convection thermal resistance in Hotspot to 0.3 W/◦ C to reflect the power-thermal characteristics of modern server-grade processors [16, 17]. This lower value represents improved packaging and cooling technology and was chosen to allow a chip maximum temperatures Tmax = 110◦ C, and a steady-state power consumption (with throttling) of about 130 W. Given a floorplan of a future multi-core processor, the formulas for computing thermal resistances are well-known because they depend on properties (like thermal conductivity) that do not change much with technology scaling. However, obtaining block-level power data (especially leakage) for future multi-core processors is much harder because it depends on many technology-dependent parameters (like subthreshold leakage per transistor). Hence, we use the following general approach. First, we obtain leakage and dynamic power data for different functional blocks using the temperatureaware models from [5]. We then scale the leakage power (function of temperature) and dynamic power (function of speed), keeping relative block numbers the same, to obtain power numbers P1 (T, s) representative of a modern single-core server processor. We then model the total power consumption of a “corresponding” N-core processor with all cores active to be PN (T, s) = k p P1 (T, s). The scaling factor k p is a simple and general way to model the changes in chip power consumption over different technologies. We then compute the per-core power consumption as PN (T, s)/N. Figure 2 shows a plot of the total power consumption of a singlecore processor P1 (T, 1), i.e. with all cores running at full speed. To study the effect of dynamic and static powers on multi-core speedup and power, we construct three profiles: (1) high dynamic and static power, (2) low dynamic, but high static power, and (3)
2 1 1
2
3
4 5 6 7 Number of active cores Na
8
9
Figure 4: Total throughput vs number of active cores. low dynamic and static power. We note here that we chose k p = 1.5, Tmid = 75◦ C (see Figure 2), smin = 0.1 for our setup.
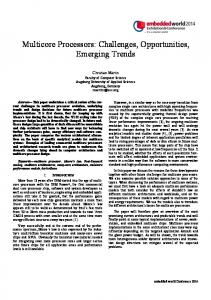
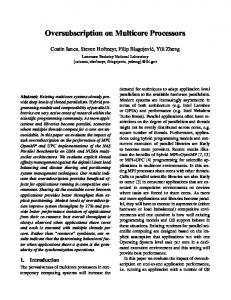
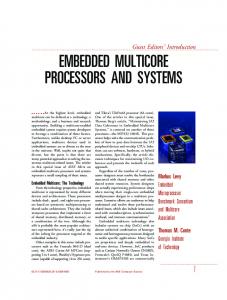
Total throughput and power. We now compute the throughput and power curves for a 9-core processor represented by the above power-thermal data. We do this first using the closed form expressions for S and P obtained in Section 5, and then verify these results numerically by using the detailed Hotspot and exponential LDT power models. Figure 3 describes the method used to obtain the steady state power and temperature of each block of each core numerically, for a given throttling speed s and number of active cores Na . The Hotspot thermal RC circuit of the multi-core processor is first pruned of all capacitances (as we are interested in steady state solution). This resistance network, when combined with the exponential LDT static power model and the (constant) dynamic power model constitutes a non-linear system because the current sources in each die block depend exponentially on the voltage of that block. To obtain the steady state values of these currents (power consumption) and voltages (temperature), we use a non-linear equation solver that solves the 191 KCL equations for each node in the circuit. To compute the throttling speed s∗ (Na ) numerically, we repeat the procedure described above for different speeds over the range [smin , 1] by performing a binary search, and select the speed that keeps the hottest block on the die just below Tmax in steady state. Once we find s∗ (Na ), the output of the solver gives us the power consumption of each block, which is summed to get P(Na ). Figure 4 shows the speedup of a 9-core processor as a function of the number of active cores, computed both analytically and nu-
Total power P (W)
120 100
in computing the throttling speed causes a corresponding underprediction (worst case 7%) in computing the dynamic power.
(1) Analytical (1) Numerical (2) Analytical (2) Numerical (3) Analytical (3) Numerical
6.
80 60 40 20 1
2
3
4 5 6 7 Number of active cores Na
8
9
Figure 5: Total power vs number of active cores.
merically for each of the profiles in Figure 2. For the profile (1), the speedup scales linearly until Nc = 4 cores, beginning to slow down slightly for Na = 5, reaching a maximum at Na = 7 and decreasing for Na = 8 and 9. As the static power is high, and because throttling the processor only reduces the dynamic power linearly, a lot of throttling is needed when the number of active cores (and hence total static power) grows. This speedup curve is unacceptable as using all cores results in less performance than using only seven cores, which defeats the purpose of deploying nine cores. If the dynamic power were to be reduced, as in profile (2), we see that the speedup now scales linearly up to Nc = 6 cores. Although it veers off the straight line for Na > 6, it continues to increase. This allows utilizing all N cores, with increasing speedup for increasing Na . The improvement over (1) is because the reduced dynamic power requires lower throttling to meet the power-thermal budget. If the static power were also reduced sufficiently, as in profile (3), the total power is within the thermal limit, the speedup curve becomes the ideal straight line, and all cores can be simultaneously run at full speed. We see that the analytical results for Nc match the numerical results exactly for all three profiles. The speedup numbers predicted analytically are slightly underpredicted for Na > Nc , with the worst case error being 8%. For profile (1), the analytical results took 71 ms to compute versus 96 s for the numerical. We believe that using the proposed approach provides a good tradeoff between analytical insight and numerical accuracy. For example, suppose a designer wanted to deploy better packaging or cooling to have the speedup curve for profile (2) look like that for profile (3). With the numerical approach, the designer would have to try different values of various package and cooling parameters in Hotspot, and redo the procedure described in Figure 3. With the analytical approach, the designer could simply set Nc = 9 in (6) and solve for R p . The expressions in Section 5 also allow one to easily compute the sensitivity of variables of interest to design parameters (like Tmax ) by simply taking the partial derivative, e.g. the speedup is a linear function of Tmax , while Nc is inversely proportional to the total (apparent) power consumption per core. Figure 5 shows the total power consumed by the same 9-core processor as the number of active cores is varied. As predicted in Section 5 all the power profiles have corresponding P(Na ) curves that are strictly convex and increasing for Na ≤ Nc . Also, for Na > Nc , they are concave and increasing. The prediction error w.r.t. the numerical results are small for Na ≤ Nc ; the error here is mainly due to the piecewise-linear approximation for LDT as both approaches predict the throttling speed correctly as 1. For Na > Nc , the error
CONCLUSION
The processor industry has plans to aggressively scale the number of cores on a die. There is a great need for tools and models at all design levels to understand the relationships between performance, power and heat for such processors. We propose high-level thermal and power models that incorporate important effects like leakage dependence on temperature (LDT), and die power density variations. Using a linear approximation for LDT, we removed the circular dependency between the power and temperature of a chip block. We developed simple closed form expressions for (a) the speedup and power of an N-core processor as a function of the number of active cores, (b) the maximum number of cores that can be activated, both, with and without throttling. These expressions contain parameters related to macro-level system power and thermal parameters which can be used for early design exploration. We validated these results by comparing them to the output of a nonlinear circuit solver, which computes the steady state of the Hotspot thermal circuit driven by an exponential LDT power model.
7.
REFERENCES
[1] D. Geer, “Chip makers turn to multicore processors,” IEEE Computer, vol. 38, no. 5, pp. 11–13, May 2005. [2] J. Held, J. Bautista, and S. Koehl. (2006) From a few cores to many: A tera-scale computing research overview. [3] S. Heo, K. Barr, and K. Asanovic, “Reducing power density through activity migration,” in Proc. Intl’ Symp. Low Power Electronics and Design (ISLPED), 2003, pp. 217–222. [4] A. Cohen, F. Finkelstein, A. Mendelson, R. Ronen, and D. Rudoy, “On estimating optimal performance of cpu dynamic thermal management,” IEEE Computer Architecture Letters, vol. 2, no. 1, pp. 6–6, 2003. [5] W. Liao, L. He, and K. M. Lepak, “Temperature and supply voltage aware performance and power modeling at microarchitecture level,” IEEE Trans. Computer-Aided Design, vol. 24, no. 7, pp. 1042–1053, July 2005. [6] W. Lee, K. Patel, and M. Pedram, “Dynamic thermal management for mpeg-2 decoding,” in Proc. Intl’ Symp. Low Power Electronics and Design (ISLPED), 2006, pp. 316–321. [7] R. Rao, S. Vrudhula, C. Chakrabarti, and N. Chang, “An optimal analytical solution for processor speed control with thermal constraints,” in Proc. Intl’ Symp. Low Power Electronics and Design (ISLPED), October 2006, pp. 292–297. [8] R. Mukherjee and S. O. Memik, “Physical aware frequency selection for dynamic thermal management in multi-core systems,” in Proc. Intl’ Conf. Computer Aided Design (ICCAD), 2006, pp. 547–552. [9] W. Huang, M. R. Stan, K. Skadron, K. Sankaranarayanan, and S. Ghosh, “Hotspot: A compact thermal modeling method for cmos vlsi systems,” IEEE Trans. VLSI Sys., vol. 14, no. 5, pp. 501–513, May 2006. [10] H. Su, F. Liu, A. Devgan, E. Acar, and S. Nassif, “Full chip leakage estimation considering power supply and temperature variations,” in Proc. Intl’ Symp. Low Power Electronics and Design (ISLPED), 2003, pp. 78–83. [11] Y. Li, D. Parikh, Y. Zhang, K. Sankaranarayanan, M. Stan, and K. Skadron, “State-preserving vs. non-state-preserving leakage control in caches,” in Proc. Design Automation and Test in Europe Conf. (DATE), 2004, pp. 22–27. [12] C. Isci, A. Buyuktosunoglu, C.-Y. Cher, P. Bose, and M. Martonosi, “An analysis of efficient multi-core global power management policies: Maximizing performance for a given power budget,” in Proc. Intl’ Symp. Microarch. (MICRO), 2006, pp. 347–358. [13] J. Donald and M. Martonosi, “Techniques for multicore thermal management: Classification and new exploration,” in Proc. Intl’ Symp. Comp. Arch. (ISCA), 2006. [14] D. Brooks and M. Martonosi, “Dynamic thermal management for high-performance microprocessors,” in Intl’ Symp. High Speed Computer Arch. (HPCA), 2001, pp. 171–182. [15] K. Skadron, T. Abdelzaher, and M. R. Stan, “Control-theoretic techniques and thermal-RC modeling for accurate and localized dynamic thermal management,” in Proc. Intl’ Symp. High Perf. Comp. Arch. (HPCA), 2002, pp. 17–28. [16] AMD Athlon 64 Processor Power and Thermal Data Sheet, Advanced Micro Devices, August 2004. [17] Intel Pentium 4 Processor 6x1 Sequence: Datasheet, Intel Corp., January 2006.