Time Evolution of Complex Networks: Commuting Systems in Insular Italy Andrea De Montis(1)∗, Simone Caschili(2) , Michele Campagna(2) , Alessandro Chessa(3)(4) , Giancarlo Deplano(2) Prepared for the 48th Congress of the European Regional Science Association 27-31 August 2008, Liverpool, UK (1)
Dipartimento di Ingegneria del Territorio, Sezione Costruzioni e Infrastrutture, Universit` a degli Studi di Sassari, via De Nicola, Sassari, 07100 - Italy (2)
Dipartimento di Ingegneria del Territorio, Universit`a degli Studi di Cagliari, Piazza d’Armi 16, Cagliari 09123 – Italy (3)
Dipartimento di Fisica, INFM, Universit`a degli Studi di Cagliari, Complesso Universitario di Monserrato, Monserrato 09042 - Italy (4)
Linkalab, Center for the Study of Complex Networks, Sardegna - Italy
Abstract The aim of this paper is to study the dynamics of commuting system of two insular regions of Italy, Sardinia and Sicily, inspected as complex networks. The authors refer to a thirty-year time period and take into account three census dataset about the work and study-driven intermunicipal origin-destination movements of residential inhabitants in 1981, 1991, and 2001. Since it is likely that the number of municipalities (in this case, the vertices of the system) do not display sharp variations, the authors direct the study to the variation of the properties emerging through both a topological and a weighted network representation of commuting in the time periods indicated.
Keywords: complex networks, commuters’ dynamics, comparative analysis, weighted networks ∗ Corresponding
author. E-mail address:
[email protected]
1
1
Introduction
The network paradigm and its main mathematical formalization through graph theory provides analysts with a powerful tool for approaching the study of large systems through the decomposition of their structure into simple elements, i.e. a set of entities (the vertices) and a set of relations among them (the edges). Recently, network analysis has been applied in a variety of realms to the characterization of a number of real systems: Internet, World Wide Web, neural activities, chemical reactions, acquaintances, co-authorship of scientific papers, food webs, transportation patterns, urban morphology, knowledge spreading, power grids, epidemics, gas pipelines, and many others. The main results of these studies consist of a better description of the actual behaviour of complex systems, the possibility to categorize those systems in clusters of networks with the same properties, and the chance to predict the behaviour and reactions of those systems to external perturbations. In the field of regional planning and infrastructure, a variety of scholars have studied the behaviour of transportation systems, such as railways, metropolitan train lines, and also commuting systems. The aim of this paper is to study the dynamics of commuting system of two insular regions of Italy, Sardinia and Sicily, inspected as complex networks. The authors have already developed a static comparative analysis of those systems and found that in many cases it is possible to affirm that similar statistical properties of the commuting phenomenon are supported by a similar geographical setting. In the present paper, they intend to study the time evolution of the commuting systems in a thirty-year time period by referring to three census dataset about the work and study-driven inter-municipal origin-destination movements of residential inhabitants in 1981, 1991, and 2001. Since it is likely that the number of municipalities (in this case, the vertices of the system) do not display sharp variations, the authors will direct the study to the variation of the properties emerging through both a topological and a weighted network representation of commuting in the time periods indicated. These issues are presented as follows. In Section 2, a brief state of the art on complex network theory and its applications is illustrated. In Section 3, complex network theory is applied to the characterization of dynamic topological and traffic properties of commuting in insular Italy in a twenty-year period of time. : Results, Section 4: interpretation, Section 5: Conclusion and outlook.
2
Commuting dynamics and modeling: a network approach
Given the peculiar nature of inter-municipal commuting, the network paradigm has often been adopted to study the patterns of habitual movements between origin-destination points. Following the dominant traditional approach to the study of commuting networks, many authors have applied spatial interaction 2
models, which are modifications of gravity models (Thorsen and Gitlesen, 1998; Johansson et al. 2003; Patuelli et al, 2007). Spatial interaction models have also been applied to the study of other evolving spatial phenomena (Sen and Smith, 1995). CNT has been applied to both simulated and real systems. Apart from computer simulations, CNT provides insights into a wide range of issues such as food webs, human interactions, the internet, the world wide web, the spread of diseases, population genetics, genomics and proteomics. In each of these cases one starts by inspecting recurrent structures embedded in complex systems characterized by non-identical elements (the nodes) connected through different kinds of interactions (the edges). For a review of these applications, see Albert and Barab´ asi (2002) and Newman (2003). Following the same approach, CNT has been recently used to study commuting. Patuelli et al (2007) characterize the topology of the German commuting network, while De Montis et al (2007) adopt a weighted network approach to inspect the inter-municipal commuting in the Italian region of Sardinia, Italy, and use the same outline to compare the Sardinian to the Sicilian commuting system in a static perspective referred to 1991 (De Montis et al, in press).
3
Applying network analysis to commuting in Sicily and Sardinia
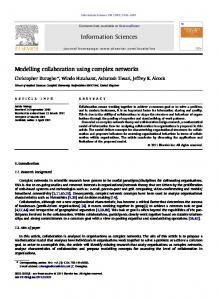
In this section, the results of the application of the complex network approach to the analysis of commuters’ dynamics in Sardinia and Sicily are presented. While De Montis et al (in press) have investigated on those insular commuting systems by taking into account just one time period (1991), in this paper the authors consider their dynamics and inspect the changes occurring from 1981 to 2001. A commuting system can be represented in general as an undirected weighted network, where nodes correspond to the towns and edges are attributed a weight measuring how many commuters flow from a town to another. In figure 1, a geographical representation of the Sardinian and the Sicilian inter-Municipal Commuting Networks (SMCN and SiMCN) is given. Commuters’ dynamics is described in the Census issued by the Italian National Institute of Statistics (Istat), which produces every decade the commuters’ origin-destination table (ODT). This data set is constructed about commuting behaviours of resident population and reports the daily movements from the habitual residence (the origin) to the most frequent place for work or study (destination): data comprise both the means used and the time usually spent for displacement. Hence, ODT data provides the analysts with information about the flows of commuters who regularly move among the Italian municipalities. In this case, three Census ODT are considered for the years 1981, 1991, and 2001. In the following sections, the topological and traffic properties of these systems are presented.
3
Figure 1: Geographical representation of the SMCN (on the left) and of the SiMCN (on the right) in 1991. The nodes represent the municipal centers and the edges correspond to commuting flows larger than 50 inhabitants.
3.1
Analysis of the topology
The fist investigation regards the evolution of the number of simple elements of these systems in the time series. As table 1 describes, in both the systems the size - i.e. the number of nodes NSM CN and NSiM CN - remains almost constant, apart from a slight increase from 1981 to 1991, while the number of edges (ESM CN and ESiM CN ) shows a relevant increase from 1981 to 1991 and reach a constant trend during the decade 1991-2001. The dynamics of the average path length -< l >SM CN and < l >SiM CN - a measure of the average number of edges needed to connect a pair whatsoever of nodes in the network reveals a tendency to float around a value equal to 2.0. The maximum value of the path max max length lSM CN and lSiM CN -i.e. the diameter of the networks- during the first decade 1981-1991 decreases from 4 to 3 for the SMCN while increases from 3 to 4 for the SiMCN and during the second decade 1991-2001 stay constant. The analysis of the size reveals that both the systems can be characterized as dense networks with a tendency to the small world structure, as l scales as the logarithm of N (table 2). The assessment of the topological properties of a network is developed by considering its standard mathematical representation: the adjacency matrix [A], where a generic element aij is equal to 1, if there is at least one inhabitant commuting between the town i and the town j, and is equal to 0 otherwise. The generic diagonal element aii is always null, as intra municipal commuting is not investigated in this paper. A very important topological network measure is degree k, which represents the number of first neighbors of a node and obeys to the following expression:
ki =
X
aij
j∈V(i)
where V (i) denotes the set of neighbors of i. 4
(1)
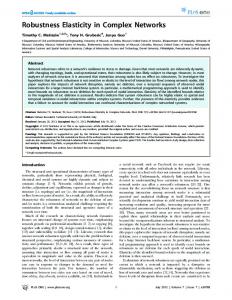
Figure 2: Plot of the probability distribution of the degree P (k) for the SMCN (on the left) and for the SiMCN (on the right) The analysis of the probability distribution of the degree P (k) offers a proxy for the centrality of the nodes, in terms of number connections of a given node. Figure 2 represents the analysis of the variation of the probability distribution of the degree P (k) for the SMCN and the SiMCN for the three years considered. In both the SMCN and SiMCN, this probability distribution has an exponential behaviour with a finite and characteristic mean value: in this respect, these systems belong to the class of random networks. As reported in table 3 the average degree < k > displays a relevant increase from 1981 to 1991, as well as its minimum and maximum values. The values of the average degree for the SiMCN are always higher than the ones of the SMCN, which is a signature that Sicilian towns have an higher propensity to exchange commuters with first neighbours than Sardinian ones. With respect to relations between topological patterns and socio-economic hierarchies, in table 4 we perform a ranking of municipalities with k degree: all socio-administrative centres of both regions show high-ranking with a stable position during the regarded time. Another quantity usually considered in network analysis is the clustering coefficient, a measure of the level of local cohesiveness of a node that obeys to the following relation: C(i) =
2E(i) ki (ki − 1)
(2)
where E(i) is the number of links between the neighbors of the node i and ki (ki − 1)/2 is the maximum number of possible interconnections among the neighbors of that node. The clustering coefficient ranges in the interval [0, 1]: values close to 1 are a signature of a very high local connectedness around a node, while the opposite is valid for values approaching to zero. It is often preferable to consider an averaged measure of the clustering coefficient C(i) for all nodes with a given k value, by managing the following spectrum of the clustering coefficient versus the degree:
5
Figure 3: Plot of the spectrum of the clustering coefficient averaged over the degree C(k) for the SMCN (on the left) and for the SiMCN (on the right): a downward sloping behaviour is evident
C(k) =
X 1 C(i) N P (k)
(3)
i/ki =k
where N P (k) is the total number of nodes of degree k. Figure 3 illustrates the dynamic spectrum of the clustering coefficient for the SMCN and the SiMCN, pointing the emergence of a downward sloping trend of C(k) over the whole range of degree values and the entire time span. This implies that, on average, “small” towns (with low k degree) have highly clustered first neighbours, while “large” towns are connected to neighbour centers that are weakly connected each other: a typical phenomenon in infrastructure systems, where inhabitants commute from small satellite towns to higher level cities, that usually offer a rich series of goods and services. Finally, we measure the clustering coefficient theoretically computed for the case of a generalized random graph, which is: (< k 2 > − < k >)2 (4) N < k >3 The analysis -reported in table 5- confirmes that both networks display random network features with clustering coefficients of the same order to the cases of generalized ramdom graphs. < C(k) >rd =
3.2
Analysis of the traffic
In this section, the results of the analysis of the commuter traffic for the SMCN and the SiMCN in the times series are reported. The Origin Destination Table (ODT) conveys information related to the number of commuters that preferentially move from residential origin municipal towns to habitual municipal destinations. According to the weighted network approach (De Montis at al, 2007), this information is processed to construct the weighted adjacency matrix [W ] of the SiMCN, where a generic element wij is equal to 6
Figure 4: Log-log plots of the complementary cumulative probability distribution of the weight w for the SMCN (on the left) and for the SiMCN (on the right) the sum of the number of commuters moving from the town i to the town j and vice versa, and a generic diagonal element wii is equal to zero. In this case, the symmetric weighted adjacency matrix [W ] is the standard mathematical representation of the commuting system here conceived of as an undirected weighted network. The analysis of the complementary cumulative probability distribution of the weights, pictured in figure 4, reveals a heterogeneity of values over the whole time span, as usually the maximum value of the weight wmax is much higher than its average value < w > (Table 6). In all cases, the curves display a power-law distributions (P (w) ≈ w−β ). The exponent of these curves can be confronted with the value calculated with reference to the year 1991 (β ≈ 1.8) for the SMCN by De Montis et al. (2007) and for the SiMCN (β ≈ 2.0) by De Montis et al (in press). The weighted network approach implies a generalization -among the other measures- of the degree by considering the strength s defined with the relation: X si = wij (5) j∈V(i)
The strength offers another proxy indication for the centrality of a node in a network. In this case, the strength concerns a measure of the capacity of a town to exchange commuters from first neighbour municipalities. In figure 5, a representation of the dynamics of this variable is given and its complementary cumulative probability distribution is pictured over the three years considered in this study. It is possible to observe that the curves display again a good fit to a power law line (P (s) ≈ s−γ ), while there is a non-negligible probability to encounter towns with a very high value of s (traffic hub towns). The exponent of these curves can be confronted with the value calculated with reference to the year 1991 (γ ≈ 2.0) for the SMCN by De Montis et al. (2007) and for the SiMCN (γ ≈ 2.0) by De Montis et al (in press). In this respect, the SMCN and the SiMCN in every year can be included in the class of weighted scale
7
Figure 5: Log-log plots of the complementary cumulative probability distribution of the strength s for the SMCN (on the left) and for the SiMCN (on the right)
Figure 6: Log-log plots of the spectrum of the strength s averaged over the degree for the SMCN (on the left) and for the SiMCN (on the right) free networks. In table 7 we report a ranking of first ten municipalities by their strength s: as general comment it is manifest for both regions that the topological poles (see table 4) behave also as attractors of traffic flows with a constant trend during the twenty-year period.
3.3
The analysis of the interplay traffic-topology
In this section a temporal analysis of the interplay between traffic and topological properties of the SiMCN is developed. A possible way to study this relation is to compare the measure of the strength s -describing the traffic centrality- and the degree k -describing the topological centrality- by picturing in figure 6 the spectrum of the average value of s for each degree k of the nodes. It is possible to observe in each year a positive correlation between these two quantities. Given the similarities of the three curves, it is possible to observe over the whole range of degree values a power law behaviour, whose regime (s(k) ≈ k δ ). The exponent of these curves can be confronted with the value
8
calculated with reference to the year 1991 (δ ≈ 1.9) for the SMCN by De Montis et al. (2007) and for the SiMCN (δ ≈ 1.80) by De Montis et al (in press). Despite of the usual variations, in the SMCN and the SiMCN during the twenty year period 1981-2001 the strength s of a given node, on average, scales with nearly the square of its degree k: the higher the degree of a node the higher the strength. In both the cases, the traffic per connection increases when the number of connections (degree k) increases: this super-linear behaviour may be a sign of the existence of some hidden economies of scale.
4
Conclusion: interpretation of the results
In this paper, the authors have studied the variation occurred in the time span 1981-2001 to the commuting system of the two main islands of Italy, Sicily and Sardinia, by conceiving them as networks constituted by nodes corresponding to towns and by edges to commuting relations between each pair of towns. In this section, the interpretation of the results illustrated above is reported, by listing the main issues described. • The size of the systems do no show relevant variations, as the number of their nodes fluctuates around values of order 400. By contrast, as regards to their relational properties, the number of links display a sharp increase in the first decade 1981-1991. This is the sign of an important development of commuting probably due to an increase in that period of time of the propensity of towns to exchange commuters with more and more other towns. • Both the networks are dense, as they have on average a number of edges per node E/N of order 20; in particular, the Sicilian network is denser than the Sardinian one in each time period. Again this density indicator shows a relevant variation for both the networks from 1981 to 1991. • The networks are quite robust, as far as their shortest averaged and maximum path length values fluctuate in all the time periods considered around 2 and 4, values much smaller than the number of edges. This is a signature that these networks can be included in the class of small world networks, while their diameter- measuring the maximum size- is constant. • Sardinian and Sicilian commuters’ systems display robustly a random graph structure, with respect to the probability distribution of the degree k, which is in all the three time periods bell-shaped around a characteristic mean value for Italian insular towns. • Both the systems have a local connectedness- measured by the clustering coefficient- that reveals a property common in many infrastructure networks, such as the world airline network (Barrat et al, 2004), the metropolitan train network (Latora and Marchiori, 2002), the Internet (Pastor-Satorras and Vespignani, 2004), where ”large” (k degree) nodes 9
link to disconnected regions, while ”small” nodes are connected to nodes highly connected each other. • The application of the weighted network analysis to the study of the dynamics of the systems has brought a novel series of results that yield completely different statistical properties with respect to the analysis of the topological properties. • These systems again are robust, as they display very similar characteristics detected by a constant behaviour of the complementary cumulative probability distribution of the weights. The curve of the distributions in all the time periods fit a power-law line with a nearly constant decay. The same holds for the complementary cumulative probability distribution of the strength s, which display constantly a power-law decay over a broad range of values. These results are a sign of the emergence of a common property in other transportation systems, where the average value of the strength s does not represent any characteristic value for the distribution. Thus, both systems can be included in the class of scale free weighted networks. • The analysis of the interplay between traffic and topological properties reveals that the networks are robust during the twenty year period 19812001: there is always a super-linear relation between the strength s averaged over the values of the degree k. During the last two decades in Italian insular inter-minucipal commuting the towns have exploited their connectivity so that they are able to handle many more commuters, as traffic centrality scales constantly with a pace equal nearly twice as much with respect to the topological centrality.
5
Acknowledgments
A.C. , A.D.M. , M.C. and G.D. acknowledge Cybersar Project managed by the Consorzio COSMOLAB, a project co-funded by the Italian Ministry of University and Research (MUR) within the Programma Operativo Nazionale 2000-2006 ”Ricerca Scientifica, Sviluppo Tecnologico, Alta Formazione” per le Regioni Italiane dell’Obiettivo 1 (Campania, Calabria, Puglia, Basilicata, Sicilia, Sardegna) – Asse II, Misura II.2 “Societ`a dell’Informazione”, Azione a “ Sistemi di calcolo e simulazione ad alte prestazioni”. More information is available at http://www.cybersar.it .
10
6
References 1. Albert R, Barab´ asi AL, 2002, ”Statistical mechanics of complex networks”, Rev. Mod. Phys. 74, 47-97. 2. Barrat A, Barth´elemy M, Pastor-Satorras R, Vespignani A, 2004, ”The architecture of complex weighted networks”, Proceedings of The National Academy of Sciences 11, 3747-3752. 3. De Montis A, Barth´elemy M, Chessa A, Vespignani A, 2007, ”The structure of interurban traffic: a weighted network analysis”, Environment and Planning B: Planning and Design 34(5), 905-924. 4. De Montis A, Campagna M, Caschili S, Chessa A, Deplano G, in press. ”Modelling commuting systems through a complex network analysis: a Study of the Italian islands of Sardinia and Sicily”, Journal of Transport and Land Use. 5. Johansson B, Klaesson J, Olsson M, 2003, ”Commuters’ Non-linear Response to Time Distances”, Journal of Geographical Systems 5(3), 315-329. 6. Latora V, Marchiori M, 2002, ”Is the Boston subway a small-world network?”, Physica A 314, 109-113. 7. Newman MEJ, 2003, ”Structure and function of complex networks”, SIAM review 45, 167-256. 8. Pastor-Satorras R, Vespignani A, 2004, Evolution and Structure of the Internet, Cambridge University Press, Cambridge, USA. 9. Patuelli R, A. Reggiani, Gorman SP, Nijkamp P and Bade FJ, 2007. ”Network Analysis of Commuting Flows: A Comparative Static Approach to German Data”, Networks and Spatial Economics 7 (4), 315-331.
10. Sen A, Smith TE, 1995, Gravity Models of Spatial Interaction Behavior, Springer Verlag, Heidelberg and New York. 11. Thorsen I, Gitlesen JP, 1998, ”Empirical evaluation of alternative model specifications to predict commuting flows”, Journal of Regional Science 38, 273-292.
7
Appendix
11
SMCN N E 369 5637 375 8124 377 8136
1981 1991 2001
SiMCN N E 388 7541 391 9993 390 9793
Table 1: The dynamics of the size for the SMCN and SiMCN
1981 1991 2001
SMCN < l > lmax 2.1 4 2.0 3 1.9 3
SiMCN < l > lmax 2.1 3 2.0 4 2.0 4
Table 2: The dynamics of the path length for the SMCN and the SiMCN
1981 1991 2001
kmin 1 8 7
SMCN kmax < k > 252 30.6 279 43.3 280 43.2
kmin 3 1 2
SiMCN kmax 271 280 270
38.9 51.1 50.2
Table 3: The dynamics of the degree k for the SMCN and SiMCN
1 2 3 4 5 6 7 8 9 10
1981 Cagliari Oristano Sassari Nuoro Villacidro Ottana Macomer Assemini Quartu SE Selargius
SMCN 1991 Cagliari Nuoro Oristano Macomer Sassari Quartu SE Assemini Selargius Villacidro Ottana
2001 Cagliari Nuoro Oristano Sassari Macomer Quartu SE Selargius Assemini Sestu Ottana
1981 Palermo Catania Messina Caltanis. Siracusa Agrigento Milazzo Enna Termini I. Siracusa
SiMCN 1991 Palermo Catania Messina Caltanis. Enna Termini I. Bagheria Siracusa Gela Milazzo
2001 Palermo Catania Messina Caltanis. Enna Termini I. Bagheria Gela Agrigento Siracusa
Table 4: Ranking of municipalities’ degree K for the SMCN and SiMCN
12
1981 1991 2001
SMCN < C(k) > < C(k) >rd 0.41 0.21 0.46 0.24 0.51 0.26
SiMCN < C(k) > < C(k) >rd 0.44 0.19 0.49 0.21 0.51 0.24
Table 5: Clustering spectrum for SMCN, SiMCN, and the case of the generalized random graphs
1981 1991 2001
wmin 1 8 2
SMCN wmax < w > 8673 21 13953 27 29022 55
wmin 1 1 1
SiMCN wmax < w > 6699 31 10233 38 10015 44
Table 6: The dynamics of the weight w for the SMCN and SiMCN
1 2 3 4 5 6 7 8 9 10
1981 Cagliari Nuoro Sassari Oristano Porto Torres Selargius Assemini Portoscuso Carbonia Iglesias
SMCN 1991 Cagliari Nuoro Sassari Oristano Selargius Assemini Porto Torres Nuoro Carbonia Iglesias
2001 Cagliari Nuoro Sassari Quartu SE Oristano Selargius Assemini Nuoro Iglesias Capoterra
1981 Catania Palermo Siracusa Trapani Priolo Messina Misterbianco Gravina Agrigento Erice
SiMCN 1991 Catania Palermo Siracusa Messina Trapani Misterbianco Agrigento Gravina Erice San Giovanni
Table 7: Ranking of municipalities’ strength s for the SMCN and SiMCN
13
2001 Catania Palermo Trapani Siracusa Messina Misterbianco Acireale Agrigento Erice Gravina