Tinkering and Gender in End-User Programmers’ Debugging Laura Beckwith1, Cory Kissinger1, Margaret Burnett1, Susan Wiedenbeck2, Joseph Lawrance1, Alan Blackwell3, and Curtis Cook1 3 1 2 Oregon State University Drexel University University of Cambridge Corvallis, Oregon, USA Philadelphia, Pennsylvania Cambridge, United Kingdom {beckwith, ckissin, burnett, lawrance, susan.wiedenbeck
[email protected] cook}@eecs.oregonstate.edu @ischool.drexel.edu ABSTRACT
Earlier research on gender effects with software features intended to help problem-solvers in end-user debugging environments has shown that females are less likely to use unfamiliar software features. This poses a serious problem because these features may be key to helping them with debugging problems. Contrasting this with research documenting males’ inclination for tinkering in unfamiliar environments, the question arises as to whether encouraging tinkering with new features would help females overcome the factors, such as low self-efficacy, that led to the earlier results. In this paper, we present an experiment with males and females in an end-user debugging setting, and investigate how tinkering behavior impacts several measures of their debugging success. Our results show that the factors of tinkering, reflection, and self-efficacy, can combine in multiple ways to impact debugging effectiveness differently for males than for females. Author Keywords
Gender, debugging, end-user programming, end-user software engineering, tinkering, self-efficacy, SurpriseExplain-Reward. ACM Classification Keywords
D.2.5 [Software Engineering]: Testing and Debugging; H.1.2 [Information Systems]: User/Machine Systems— Human factors; H.4.1 [Information Systems Applications]: Office Automation—Spreadsheets; H.5.2 [Information Systems]: Information Interfaces and Presentation—User Interfaces (D.2.2, H.1.2, I.3.6)
Permission to make digital or hard copies of all or part of this work for personal or classroom use is granted without fee provided that copies are not made or distributed for profit or commercial advantage and that copies bear this notice and the full citation on the first page. To copy otherwise, or republish, to post on servers or to redistribute to lists, requires prior specific permission and/or a fee. CHI 2006, April 22-28, 2006, Montréal, Québec, Canada. Copyright 2006 ACM 1-59593-178-3/06/0004...$5.00.
INTRODUCTION
In educational settings, tinkering, or playful experimentation, is often encouraged because of its expected educational benefits [19]. In our research into how to support end users who perform programming-like tasks, such as creating and debugging spreadsheet formulas, we began to suspect that tinkering may be a critical factor. For example, tinkering may yield positive benefits by making the user feel in control of the system. Also, users may incidentally gain knowledge of the system through tinkering, such as about what features are available, how to invoke them, and what kind of feedback is available after actions. However, education literature reports that tinkering is a strategy more often adopted by males than females [10, 16, 23], possibly leaving females without the advantages that can be gained from this strategy. If these same genderrelated findings apply to the end-user debugging domain (e.g., [2, 6, 13, 24]), they may interact with other factors e.g., self-efficacy. In a previous experiment, we found that females had lower self-efficacy, expressed as confidence in their ability to debug spreadsheets. They also showed lower acceptance of new features that assist in correcting spreadsheet errors [3]. These differences are troubling, because use of the new features was a significant predictor of debugging success. In order to investigate whether gender, tinkering, and selfefficacy interact to predict effective use and understanding in end-user debugging, we conducted an empirical investigation using two end-user debugging environments. One of the environments was optimized for low cost in terms of user effort and the other optimized for high user support in terms of both the features and explanations available to the users. Our overall research question for this investigation was: How do gender, tinkering, self-efficacy, and effectiveness interact in end-user debugging? BACKGROUND
Research over two decades indicates that a playful approach to learning increases motivation to learn and the corresponding ability to perform tasks effectively [17, 26].
Similarly, learning can be enhanced through arousing curiosity, by providing change, complexity, or attentionattracting features that motivate exploration of an environment [14, 15, 28]. Tinkering and curiosity are related because tinkering, as an informal, unguided exploration initiated by features visible in the environment, is one way to satisfy one’s curiosity. Curiosity-based exploration is a familiar phenomenon in science and technology education. Research emphasizes the potential value of open-ended exploration in learning [19]. Other educational research has identified gender differences in exploratory behaviors. Among primary school students, studies in mathematics, geography, and gaming indicate that boys tend to tinker and to use tools in exploratory, innovative ways. Girls are less likely to tinker, preferring to follow instructions step-by-step [10, 16, 23]. Similar tinkering findings are also true of males majoring in computer science [8, 21], but not of the female computer science majors. The consistency of these reports led us to believe that the propensity to tinker might play an important role in end-user debugging effectiveness. To investigate whether there were any indications of tinkering in our environment, we began with a qualitative follow-up analysis of data from our previous study [3]. A clear pattern was found in the use of a debugging feature. In the environment, users were able to place an X-mark in a cell if they thought that the value might be wrong, and we noticed some participants placing an X-mark and then removing it again before taking any other action. Occasionally this corrected a slip, but usually there was no obvious goal-oriented explanation for placing and removing the X-mark. Having discovered this seemingly non-goaloriented behavior, we further observed that the participants who did this tinkering were consistently males. A quantitative analysis of these data confirmed that males did significantly more X-mark tinkering than females. Given this evidence of tinkering behaviors in our previous study’s data, along with that study’s results tying low selfefficacy in females to their lack of acceptance of important debugging features, we began to wonder whether there is a tie between tinkering and self-efficacy in the sort of problem-solving software environment used by end-user programmers. Bandura [1] defines self-efficacy as a taskspecific assessment of one’s belief in their own ability to accomplish a particular task. Self-efficacy is important to learning and effective performance because an individual with high self-efficacy will be more willing to take on hard tasks, expend significant effort, develop coping strategies, and persist in the face of obstacles [1]. Numerous studies show that high self-efficacy before carrying out a task is predictive of effective task performance, e.g. [1]. Our own research has shown that in the domain of end-user debugging, self-efficacy is a key predictor of females’ effectiveness: females have lower self-efficacy than males and their lower self-efficacy is related to less effective performance.
The combined evidence on both tinkering and self-efficacy in our own research and in the literature, led to the empirical study we report in this paper, investigating the effect of tinkering and its relationship to gender, selfefficacy and debugging effectiveness. EXPERIMENT
Our experiment was designed to consider the effects of two treatments, Low-Cost and High-Support, on males’ and females’ tinkering, self-efficacy, and debugging in a spreadsheet environment. In the Low-Cost treatment, tinkering was easy to do, since the cost in terms of user action was low. The High-Support treatment, as first suggested in [4], was designed to provide greater support for the debugging features, but had the side effect of increased tinkering cost. The underlying spreadsheet environment for the two treatments was the same; this is presented first, followed by the specific interaction devices for each treatment. Environment
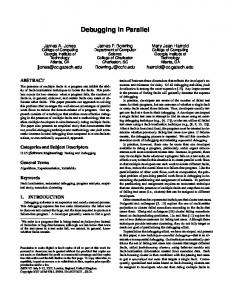
The debugging features that were present in this experiment are part of WYSIWYT (“What You See Is What You Test”). WYSIWYT is a collection of testing and debugging features that allow users to incrementally “check off” or “X out” values that are correct or incorrect, respectively [6]. In addition, arrows that allow users to see the dataflow relationships between cells also reflect WYSIWYT “testedness” status at a finer level of detail. Using WYSIWYT, once a user makes a decision about a cell’s value the system provides visual feedback reflecting the updated “testedness” status. For example, if a user places a checkmark (√) – as can be seen in Figure 1 on the Exam_Avg cell – the system updates the progress bar at the top of the spreadsheet, the cell border colors, and the color of any visible dataflow arrow(s) to reflect the new testedness. Untested elements are colored red (light gray in this paper), partially tested elements are a shade of purple (intermediate shades of gray), and fully tested elements are blue (black). The optional dataflow arrows (seen in Figure 2) are colored to reflect testedness of specific relationships between cells and sub-expressions. Feedback of the kind seen on the interior of some cells in Figure 2 is provided when a user decides a cell’s value is wrong and places an X-mark (cell Course_Avg in Figure 2)
Figure 1. An example of WYSIWYT.
Figure 2. The user notices an incorrect value in Course_Avg—the value is obviously too low—and places an X-mark in the cell. As a result of this X and the checkmark in Exam_Avg, eight cells are highlighted as being possible sources of the incorrect value, with some deemed more likely than others.
instead of a checkmark. Behind the scenes, X-marks trigger fault likelihood calculations, which cause cells suspected of containing faults to be highlighted in shades along a yellow-orange continuum (shades of gray in this paper), with darker orange shades given to cells with increased fault likelihood [6]. Each of these features is supported through the mechanisms of the Surprise-Explain-Reward strategy. This strategy relies on a user’s curiosity about features in the environment. The user can then seek out explanations (Figure 2) of the features via tool tips [28]. The aim of the strategy is that, if the user follows up as advised in the explanation, rewards will ensue [20]. Two Treatments
The Low-Cost and High-Support treatments varied in three ways: WYSIWYT input devices, explanation content and interaction, and the number of task-supporting features available within the environment. Low-Cost
In the Low-Cost treatment, WYSIWYT interaction required one click for placing or removing a testing decision (leftclick for checkmark, right-click for X-mark). Explanations, provided through tool tips, were as short as possible, to keep their reading cost low [28].
clicks, reading, and choice of features to use. This higher cost applied to tinkering as well as to other actions. In the High-Support treatment, along with the checkmark meaning that a value is correct and X-mark meaning that it is incorrect, the users also could make decisions for values that “seem right maybe,” or “seem wrong maybe.” The purpose of this mechanism was to encourage low selfefficacy users by reassuring them that confident decisions were not a prerequisite in using the devices. The colors reflecting these more tentative “seems” decisions were the same hues but less saturated than those of the other decisions [4]. The system’s inferences about which cells were tested or faulty was the same as for the Low-Cost treatment, but the system also propagated the amount of tentativeness, allowing the user to discern which statuses were based on the “seems” decisions. The input device required a user first to click on the “?” in the decision box (see Figure 2), which brings up the four choices shown in Figure 3, and then to click on their choice. (In contrast, recall that placing a checkmark or X-mark in the Low-Cost treatment required only one click.) In addition, the explanations were expanded to support users who wanted more guidance than the explanations given in the Low-Cost treatment. The mechanism was as
High-Support
The aim of the High-Support treatment was two-fold, first to encourage low self-efficacy users to take advantage of the features that can help users debug, and secondly to provide an environment in which learning was supported through fuller explanation content. A side effect of the additions was a higher user-action cost, requiring more
Figure 3. Clicking on the decision box turns it into the four choices. Each choice has a tool tip, starting with the left-most X these are “it’s wrong,” “seems wrong maybe,” “seems right maybe,” “it’s right.”
follows. In addition to the tool tip content of the Low-Cost treatment, additional information was available via a “Tips” expander (Figure 4), which could be expanded and dismissed on user demand. The expanded “Tips” included further information on why the object was in its current state and possible actions to take next. Once expanded, the tip would stay visible until the user dismissed it, supporting non-linear problem solving and requiring less memorization by the user. The “Help Me Test” feature [28] was provided to the HighSupport group (but not to the Low-Cost group) to help users overcome difficulties in finding additional test cases. Sometimes it can be difficult to find test values that will cover the untested logic in a collection of related formulas, and Help Me Test tries to find inputs that will lead to coverage of untested logic in the spreadsheet, about which users can then make testing decisions. Help Me Test is not automated testing but rather scaffolding: it provides new test inputs, but does not make decisions about the outputs that result, so does not actually “test” the spreadsheet. Procedures
The participants were randomly divided into two groups: a group of 37 participants (20 males and 17 females) received the Low-Cost treatment, and a group of 39 participants (16 males and 23 females) received the High-Support treatment. We recruited participants from the university and community; we required all participants to have some spreadsheet experience, but only limited programming experience. Statistical tests on questionnaire data showed no significant differences between the groups in grade point average, spreadsheet experience, or programming experience. A pre-experiment questionnaire collected participant background data and also contained 10 self-efficacy questions based on Compeau and Higgins’ validated scale [7]. This pre-self-efficacy questionnaire was modified with task-specific end-user debugging questions (on a five-point Likert scale) such as “I could find and fix errors if there was no one around to tell me what to do as I go.” We administered a 35-minute “hands-on” tutorial to familiarize participants with their treatment. The participants were then given two tasks. We captured their
actions in electronic transcripts, as well as their final spreadsheets. At the conclusion of each task, we administered questionnaires which included questions regarding how users perceived their performance on that task. The final questionnaire included a follow-up post-self-efficacy questionnaire identical to the pre-self-efficacy questionnaire, as well as questions assessing participants’ comprehension of the X-mark feature and their attitudes toward the features they had used. Taking two measures of self-efficacy (one prior to the experiment and another following the final task) is valuable information because according to self-efficacy theory people working in a new and unfamiliar environment have malleable self-efficacy much of which is based on their first experiences, and in particular early perceived failures can have especially pronounced effects on self-efficacy. Tutorial
In the tutorial, participants performed actions on their own machines with guidance at each step. Although the LowCost and the High-Support tutorials both described the checkmark feature (including its associated testednesscolored arrows feature), neither tutorial included any debugging or testing strategy instruction. Furthermore, neither tutorial explained the X-mark feature beyond showing that it was possible to place X-marks (with time to explore any aspects of the feedback – through explanations – that they found interesting). At the end of the tutorial, we gave both groups time to explore the features they had just learned by working on the tutorial spreadsheet debugging task. The High-Support tutorial explained the additional features of the treatment, allowing ample time to explore the choices in check and X-marks (Figure 3), the Help Me Test feature, and the expanded tool tips. To compensate for the extra time it took to explain the additional features in the HighSupport treatment, the Low-Cost group had several extra minutes at the end of the tutorial to explore and/or work further with tutorial spreadsheet debugging task. Half of the tutorial sessions were presented by a male and half by a female, balanced so that 50% of participants were instructed by a same-gender instructor and 50% by the opposite gender [27]. Tasks
Figure 4. From the non-expanded tool tip (the first line) a user can click on the Tips expander to get the rest of the tool tip – which remains on the screen until dismissed.
We asked participants to test two spreadsheets, Gradebook (Figure 2) and Payroll (screenshot available in [3]). We replicated the spreadsheets and the seeded faults of [3]. (The spreadsheets were originally derived from real end-user spreadsheets and seeded with faults from end users. Each spreadsheet contained five faults representative of the fault categories in Panko’s classification system [18].)
Participants had time limits of 22 and 35 minutes for Gradebook and Payroll respectively. These simulated the sort of time constraints that often govern real world computing tasks and prevented potential confounds, such as participants spending too much time on the first task or not enough time on the second task, participants leaving early, and so on. The use of two spreadsheets reduced the chance of the results being due to any one spreadsheet’s particular characteristics. The experiment was counterbalanced with respect to task order in order to distribute learning effects evenly. The participants were instructed, “Test the … spreadsheet to see if it works correctly and correct any errors you find.” RESULTS
We have already pointed out that ties have been found between tinkering and educational goals, and within that context tinkering seems to be a male characteristic. However, in the domain of end-user debugging, the goal is not education per se, but rather productivity or effectiveness in fixing the bugs. Still, educating oneself about features that seem useful to the task could be a necessary subgoal. Thus, we consider whether there were gender differences in tinkering as a way to master new features, and how such differences might tie to debugging effectiveness. Tinkering by Gender: How Much
Our measures were tinkering frequency, tinkering episodes, and tinkering rate within episodes (a measure of commitment to tinkering within an episode). We operationally define a tinkering instance as turning a feature “on” immediately followed by turning the feature “off,” such as placing a checkmark or turning on an arrow and then removing it as the next action. Although a tinkering instance is simple to perform in this environment, the complex feedback users receive when tinkering is where the constructive experience begins to occur: through users’ tinkering actions they can construct concrete, visual paths backwards (“breadcrumbs” of where they’ve been) and forwards (where they need to go to achieve 100% testedness). Tinkering frequency is simply a count of the number of tinkering instances. A tinkering episode is defined to be a sequence of one or more tinkering instances,
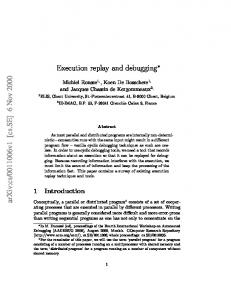
Tinkering Frequency
Low-Cost
High-Support
Female
Male
Figure 5. This interaction plot of 4 means depicts the gender x treatment interaction in tinkering frequency.
terminated by a cell edit or the end of the task. The episode count for each participant serves as a measure of consistent use of tinkering. Finally, tinkering rate, computed as tinkering frequency per episode, measures “vestedness” in tinkering within an episode: once a participant starts to tinker, how committed does he or she stay to tinkering before moving on (indicated by editing a cell)? Our expectations, given previous literature, were that males would make greater use of tinkering than females by all of these measures, regardless of treatment. Our expectations were wrong. The analysis of the tinkering frequency measure (illustrated in Figure 5) revealed that the Low-Cost males stood apart from the others. A 2 (gender) by 2 (treatment) ANOVA revealed a significant main effect of treatment (p