Future Generation Computer Systems (
)
–
Contents lists available at ScienceDirect
Future Generation Computer Systems journal homepage: www.elsevier.com/locate/fgcs
Towards adaptive synchronization measurement of large-scale non-stationary non-linear data Chang Cai a , Ke Zeng b , Lin Tang a , Dan Chen d,f,∗ , Weizhou Peng a , Jiaqing Yan e , Xiaoli Li b,c a
School of Computer Science, China University of Geosciences, Wuhan, 430074, China
b
State Key Laboratory of Cognitive Neuroscience and Learning & IDG/McGovern Institute for Brain Research, Beijing Normal University, Beijing 100875, China c Center for Collaboration and Innovation in Brain and Learning Sciences, Beijing Normal University, Beijing 100875, China d
Collaborative and Innovative Center for Educational Technology, China
e
Institute of Electrical Engineering, Yanshan University, Qinhuangdao, 066004, China
f
School of Computer, Wuhan University, Wuhan, 430072, China
highlights • We designed an approach to measure the synchronization strength of non-stationary nonlinear data against phase differences. • We demonstrated that the synchronization analysis was an effective indicator of an epileptic focus location. • We developed a parallelized approach with general-purpose computing on the graphics processing unit (GPGPU), and it largely improved the scalability of data processing.
article
info
Article history: Received 4 February 2014 Received in revised form 1 May 2014 Accepted 1 June 2014 Available online xxxx Keywords: Non-stationary nonlinear data Synchronization Adaptive analysis EEG Epilepsy
abstract Synchronization measurement of non-stationary nonlinear data is an ongoing problem in the study of complex systems, e.g., neuroscience. Existing methods are largely based on Fourier transform and wavelet transform, and there is a lack of methods capable of (1) measuring the synchronization strength of multivariate data by adapting to non-stationary, non-linear dynamics, and (2) meeting the needs of sophisticated scientific or engineering applications. This study proposes an approach that measures the synchronization strength of bivariate non-stationary nonlinear data against phase differences. The approach (briefed as AD-PDSA) relies on adaptive algorithms for data decomposition. A parallelized approach was also developed with general-purpose computing on the graphics processing unit (GPGPU), which largely improved the scalability of data processing, namely, GAD-PDSA. We developed a model on the basis of GAD-PDSA to verify its effectiveness in analyzing multi-channel, event-related potential (ERP) recordings against Daubechies (DB) wavelet with reference to the Morlet wavelet transform (MWT). GADPDSA was applied to an EEG dataset obtained from epilepsy patients, and the synchronization analysis manifested an effective indicator of epileptic focus localization. © 2014 Elsevier B.V. All rights reserved.
1. Introduction Synchronization measurement plays an important role in the study of the interacting dynamics of complex systems [1]. The recordings of the activities of such systems are generally non-
∗ Corresponding author at: School of Computer, Wuhan University, Wuhan, 430072, China. E-mail addresses:
[email protected] (D. Chen),
[email protected] (X. Li). http://dx.doi.org/10.1016/j.future.2014.06.003 0167-739X/© 2014 Elsevier B.V. All rights reserved.
stationary and non-linear. Typical examples include electroencephalogram (EEG) and magnetoencephalogram (MEG), which normally consist of simultaneous recordings of tens to hundreds of data channels. Synchronization measurements of such nonstationary, non-linear data remain a challenging issue. A number of methods have been developed to measure the synchronization of a bivariate signal, e.g., a cross-correlation function, advanced in the 1950s; the use of linear synchronization [2] to analyze time delay and synchronization; the coherence [3] quantities of the synchronization of a bivariate signal in the frequency do-
2
C. Cai et al. / Future Generation Computer Systems (
main; phase synchronization, including the phase lock, the Hilbert transform, and the wavelet transform, and the phase synchronization references [4,5]. Since the synchronization occurring at different frequencies between two or more signals indicates the interacting dynamics of a complex system [6], signals need to be decomposed into several components consisting of basic functions to obtain the frequencies in order to estimate the synchronization. Fourier analysis has been widely used in the decomposition of interesting signals [7–9] and provides accurate estimates of their spectra with the assumption that these signals are stationary. However, Fourier analysis is not well-suited for non-stationary data since the spectra of non-stationary data change with time. Fortunately, wavelet-based methods have been proposed as powerful alternatives to Fourierbased methods for the synchronization estimates of non-stationary signals. Time-course synchronization, based on wavelet, enables the extraction of the temporal variation in the synchronization among non-stationary signals and is thus a better candidate for the measurement of non-stationary dynamic signal interaction. However, wavelet-based synchronization methods generally suffer from a lack of energy–time–frequency correlation due to the limited length of the basic wavelet function. This inherent problem inevitably misleads the calculation of time-course synchronization. Furthermore, the selection of the center frequency of wavelet transform relies on a priori knowledge of the frequency characteristics of the target components. A blind full spectrum scan (if at all possible) will only result in very difficult interpretations [10]. Moreover, some wavelet transforms aided by Fourier transform, taking the most commonly used Morlet wavelet as an example, cannot make a physically meaningful interpretation of the nonlinear signal because of the spurious harmonic components that cause energy spreading induced by the linear Fourier transform. Apparently, the wavelet analysis is not adaptive in nature [11]. There is a pressing need for an approach that adapts to the dynamics of non-stationary non-linear data. We consider that the key to solving this problem lies with the decomposition of the data. The premise to achieve adaptability, in contrast to using these linear methods, is the viability of automatically exploring the structure of non-stationary, non-linear data and generating the necessary adaptive bases from the data. Ensemble empirical mode decomposition (EEMD) and local mean decomposition (LMD) are two prevalent methods in this direction. EEMD can break down complicated data without a basic function into a series of embedded oscillatory intrinsic mode functions (IMFs), which is particularly suited to noisy data. Similarly, LMD decomposes amplitude and frequency modulated signals into a small set of product functions (PFs), each of which is the product of an envelope signal and a frequency modulated signal from which a time-varying instantaneous phase and instantaneous frequency can be derived. In this study, we propose an adaptive decomposition based phase difference synchronization analysis (AD-PDSA) method. The decomposed components with EEMD or LMD are further processed via the Hilbert transform [12] to obtain the instantaneous phase of each component. The synchronization strength of bivariate data series, i.e., two IMFs/PFs of the same original data segment or two different ones, is measured by the statistical analysis of the ratio between the phase differences of each series at the same time point based on Cauchy–Schwarz inequality [13]. The value of the strength ranges from 0 to 1, where 0 denotes no synchrony and 1 denotes perfect synchrony. The synchronization measurement can eventually be extended to quantify the global synchronization of multiple components from the same data segment or multivariate data. Another challenge is to bridge the gap between the proposed method and sophisticated scientific or engineering applications. Both EEMD and LMD algorithms must repetitively process iterative computations. The precision of outputs heavily depends on the
)
–
number of iterations, which should be large enough to eliminate the iterative error. The number of simultaneously recorded neurons has approximately doubled every seven years over the last five decades [14]. Analysis of neural data in tens or hundreds of channels has become common within the neuroscience community. Due to the rapidly growing scales and sizes of neural data and the high complexity of decomposition algorithms, how to ensure the scalability of the proposed method is an important issue. Modern cyber infrastructures have played an important role in solving compute-intensive [15–18] and data-intensive scientific problems [19–22]. In this study, this goal was achieved by gearing contemporary computing technologies rather than altering the fundamental theory of data decomposition. A parallelized method of successfully adapting the technology of general-purpose computation on graphics processing units (GPGPU) was developed to significantly enhance the scalability of the original sequential version. The GPGPU-enabled AD-PDSA (GAD-PDSA) explores the very fine-grained parallelism of LMD with original parallel algorithms. It can operate on neural data streams with a large (up to one thousand) number of channels. The scalability of the approach adapts well to the advances in recording technologies of neural activities. Compared to the AD-PDSA, the execution time of the new approach is a polynomial function of the data size while that for conventional CPU-based platforms conforms to an exponential function. This will result insignificant differences when handling very large data. We developed a model on the basis of GAD-PDSA to verify its effectiveness in analyzing multi-channel, event-related potential (ERP) recordings against Daubechies (DB) wavelet with the Morlet wavelet transform (MWT) reference. AD-PDSA was then applied to experimental datasets to analyze the potential synchronization of EEG data obtained from epilepsy patients. Epilepsy is defined as spontaneous clinical seizures caused by paroxysmal, abnormally synchronous neuronal activity. The electrical symptoms of this abnormal activity are believed to uniquely define and reveal the mechanisms of an underlying abnormal neural function and structure. The localization of the initial seizure discharge is an attempt to find the region that generates the abnormal neural activity. Therefore, the analysis of ictal EEG (scalp or intracranial) is an effective standard for the identification of the epileptic focus localization. The results indicated that (1) the new method is adaptively suitable for the synchronization analysis of non-stationary and non-linear series, (2) it can detect a reliable global phase correlation amongst series components. GAD-PDSA has also improved scalability compared to the original serial AD-PDSA method. The remainder of this paper is organized as follows. In Section 2, we propose a new method, AD-PDSA, which is based on the PDSA and EEMD or LMD. Section 3 details the design of the GPGPUenabled AD-PDSA. Experiments and results are presented in Section 4. We conclude the paper with a summary in Section 5. 2. Methods This section first introduces the algorithm of the phase difference synchronization analysis (PDSA) and the adaptive decomposition-based PDSA (AD-PDSA). Following this, an extended AD-PDSA for global analysis is introduced. Then, the GPGPU is briefly described, and the levels of the AD-PDSA as well as the parallelization of the AD-PDSA are discussed in the next part. 2.1. Adaptive decomposition-based phase difference synchronization analysis (AD-PDSA) Let X = (x1 , x2 , . . . , xT ), Y = (y1 , y2 , . . . , yT ) denote the bivariate data (e.g., activities of two brain regions), T is the number of data channels. The flow of the PDSA is presented in Fig. 1.
C. Cai et al. / Future Generation Computer Systems (
)
–
3
position using adaptive methods (EEMD, LMD), and the decomposition based PDSA was defined as AD-PDSA. EEMD can decompose a signal into a series of intrinsic mode functions (IMFs), imf i (i = 1, 2, . . . , N ) where N is the number of IMFs. The IMFs need to meet the following two requirements: (1) in the whole dataset, the number of extrema and zero crossings must either equal or differ, at most, by one; and (2) at any point, the mean value of the envelope defined by the local maxima and the envelope defined by the local minima must be zero. After being processed by the EEMD algorithm, the signal x(t ) can be written as x(t ) =
N
imf i (t ) + r (t )
(1)
i=1
where N is the number of IMFs, r (t ) is the rest of the signal. Local mean decomposition (LMD) is a new iterative approach to demodulating amplitude and frequency modulated signals. It was developed recently to decompose amplitude and frequency modulated signals into a small set of product functions (PFs), each of which is the product of an envelope signal and a frequency modulated signal from which a time-varying instantaneous phase and instantaneous frequency can be derived. After being processed by the LMD algorithm, a signal x(t ) can be written as x(t ) =
N
PF i (t ) + u(t )
(2)
i=1
Fig. 1. Illustration of the PDSA algorithm.
Step 1: After initialization, Hilbert transform was used to extract the instantaneous phase information of series. The results of Hilbert transform were Hil_X and Hil_Y , and series X (t ) and Y (t ) can be written as X (t ) = X (t ) + i ∗ Hil_X (t ) and Y (t ) = Y (t ) + i ∗ Hil_Y (t ). Step 2: The instantaneous phase information of X (t ) and Y (t ) was obtained in this step. In order to make them more reasonable, we unwrapped the angle phase from the routine ‘‘angle()’’ using function ‘‘unwrap()’’. Then, the correct and reasonable instantaneous phase (Unph_X , Unph_Y ) of X (t ) and Y (t ) were constructed. Step 3: The phase difference between two delay points in X (and Y ) was computed. Let us define p_dxj = Unph_Xj+1 − Unph_Xj and p_dyj = Unph_Yj+1 − Unph_Yj , where j = 1, . . . , N. Eventually, we obtained P_dx = (p_dx1 , p_dx2 , . . . , p_dxN −1 ) and P_dy = (p_dy1 , p_dy2 , . . . , p_dyN −1 ). Step 4: This was the final step in the phase difference synchronization using Cauchy–Schwarz inequality. Based on the phase difference of X and Y , to quantify the synchronization strength, we defined the synchronization strength of X and Y as: S_strn(xi , xj ) =
(
)
2 k=1 ph_dxi,k (t )∗ph_dxj,k (t ) n 2 (t )∗ n 2 (t ) ph_dx ph_dx k=1 k=1 i,k j,k
n
.
The value of S_strn between any two time series ranges from 0 to 1, where 0 denotes no synchrony and 1 denotes perfect synchrony. Since the PDSA algorithm can analyze the coarse-grain synchronization of two series, we cannot obtain further synchronization details between two series. While EEMD or LMD can adaptively decompose a complicated multi-component signal into a set of pure signals from which a well-defined instantaneous frequency could be directly calculated, these decomposed signals can be used to calculate fine synchronization. First, we conducted a signal decom-
where N is the number of PFs, u(t ) is the rest of the signal. The product functions should perhaps be regarded as being ‘best fit’ functions; they are the best match of the product of a frequency modulated signal and an envelope of the data. The aim of the decomposition was to produce a continuous positive time-varying frequency. After applying EEMD or LMD, non-linear and non-stationary signals can be decomposed into several meaningful components of IMFs or PFs. In order to describe them uniformly, CPs will be short for IMFs and PFs during the following analysis; these meaningful components will be the input of the PDSA algorithm for the fine synchronization analysis of two series. The flow chart of the ADPDSA is presented in Fig. 2. Step 1: Initialization and signal decomposition. This step sets the number of components, i.e., NI, and performs adaptive decomposition algorithms on EEG series. Following this, we can obtain NI −1 the CPs of x(t ) = m=1 cpm (t ) + rNI (t ). This step is repeated until the whole EEG series is completed. Step 2: Calculation of synchronization analysis for any pair of components from two series. This step involves performing PSY for the phase difference synchronization analysis (see Fig. 1 for more details). Step 3: Statistical analysis for more information about the synchronization of two series. 2.2. Extending AD-PDSA to global synchronization measurement In order to measure global synchronization between data components, this study extends the AD-PDSA algorithm. The extended AD-PDSA measures the synchronization between data components from one series or multiple series. Given M component series, for the ith component series X (t ), we defined a global AD-PDSA measure based on the concept of the PDSA measure (i.e., S_strn(xi , xj )) to quantify the synchronization effect of xi with xj . To quantify the global synchronization strength, we constructed an S-estimator, which is a simple measure based on the PCA embedding technique. We first calculated the phase difference
4
C. Cai et al. / Future Generation Computer Systems (
)
–
2.3. General-purpose computing on graphics processing units (GPGPU) Modern graphics processing units (GPU) have evolved as exemplars of throughput-oriented processor architecture [23], which can divide complex problem solving tasks into thousands of concurrently executable fine-grained tasks. High level software environments for programming GPUs are widely available and easily programmable, and NVIDIA’s compute unified device architecture (CUDA) is a notable example [24]. This powerful platform is particularly suited for exploring scalable algorithms. It enables a much more cost-effective and easier-to-deploy approach to future neural signal analysis in contrast to using traditional high performance techniques. 3. Parallelization of AD-PDSA Parallel and distributed technologies exhibit tremendous merits in scientific computing. However, designing the right parallel/ distributed application is not trivial. The process of developing a parallelized version of the AD-PDSA application follows these steps: (1) identifying the form of parallelisms; (2) plotting and assessing the strategy to partition the sequential executions and dataset; (3) defining the parallel tasks and reengineering the existing program into a parallel application; and (4) testing the new parallelized application and repeating Step 3 when necessary. 3.1. The AD-PDSA application and levels of parallelism
Fig. 2. The flow of the AD-PDSA algorithm.
synchronization value between any pair of multiple data channels:
n
k=1
S_strn(xi , xj ) =
n k=1
2 ph_dxi,k (t ) ∗ ph_dxj,k (t )
ph_dx2i,k (t ) ∗
n k=1
.
(3)
ph_dx2j,k (t )
Here, i and j are the ith and jth components from the signal decomposition. Following this, the correlation matrix C was constructed as 1
XX T (4) T where the superscripted T denotes transposition. We constructed a synchronization matrix C with DPSY measures. Taking S_strn, for example, C =
Ci,j = S_strn(xi , xj ).
(5)
The eigenvalue decomposition of C was given by C vi = λi vi , where eigenvalues λ1 6 λ2 6 · · · 6 λM and vi (i = 1, 2, . . . , M ) were the corresponding eigenvectors. The quantity of the Sestimator was then computed by M
S_est = 1 +
λ′i log(λ′i )
i=1
(6)
log(M )
λ where the eigenvalues λ′i were normalized as: λ′i = M i
i=1
λi
. The
value of S_est ranged from 0 to 1, where 0 denoted no synchrony and 1 denoted perfect synchrony among the series channels.
In this study, we developed a phase difference synchronization application for analyzing EEG to measure the synchronization of epilepsy. The EEG data (multiple time series) used for processing was collected from epilepsy patients with a sampling rate of 256/s. The application’s execution flow chart is presented in Fig. 3, and it can be viewed as three major steps: Step 1: Initialization and parameter setting. This step sets the size of the time windows and the overlap of two consecutive windows, i.e., the Epoch and Overlap. They both define the boundaries of the EEG series to be processed in each inner loop (an epoch) of Step 2; thus, we can obtain the total number of time windows required to cover the whole EEG data, NW . The number of series in the ensemble (NS) was set, which is the number of out loops of Step 2. Step 2: Performing adaptive signal decomposition algorithms on NS EEG series. Each segment of each series was decomposed into several epochs according to its length. Starting from the first time window, the epoch of the EEG series intercepted by the window, x(t ), NC was fed into the algorithm for decomposition (see Section 2.1 for details). After that, we obtained the CPs of xi (t ) = NI m=1 cpm (t ) + r (t ). Step 3: Calculation of the phase difference synchronization and global analysis. An instantaneous phase of each CPs was computed with the execution of Hilbert transform; the phase difference was then obtained. Statistical analysis based on Cauchy–Schwarz inequality was used for the synchronization in the following step. Based on the execution of the extended DPSY, the global synchronization information of EEG series was obtained. The overhead distribution of the program was examined prior to a thorough parallelism analysis. As depicted in Table 1, given two EEG series of size 153,600 (Epoch = 1024, Overlap = 512), LMD for the signal decomposition and PSY for the synchronization calculation on a single computer node reported about 5891.2 s. The elapsed times in the above three steps were about, (1) negligible, (2) 4764.4903 s, and (3) 6.1599 s, respectively. Clearly, the performance bottleneck of the program lay in Step 2, i.e., computations centering on the signal decomposition. Hence
C. Cai et al. / Future Generation Computer Systems (
)
–
5
Table 1 Execution times of different parts with AD-PDSA using EEMD, LMD. Method for decomposition
EEMD (50 trials) LMD
Execution times (s) Total
Initialization
Decomposition
PDSA
2852.3107 4764.4903
Negligible Negligible
2830.8004 4758.3304
21.5103 6.1599
Fig. 4. Parallelization of the AD-PDSA at the segmentation level; an EEG series can be segmented into several simultaneously processed epoch series.
Fig. 5. Parallelization of the AD-PDSA at the calculation level; one task per point of an epoch series on an individual processor.
Fig. 3. A typical application upon the AD-PDSA algorithm.
this study only considers the parallelization of Step 2. The remainder of the paper analyzes the code that implements the two circulations in Step 2. The parallelism of AD-PDSA can be characterized on at least three levels, namely (1) series, (2) segmentation, and (3) calculation levels: Series level: Data parallelism is with the original EEG data. Since the decomposition of each time series is independent, they can all be conducted at the same time without message exchanges. The degree of data parallelism at this level equals the number of channels used for global synchronization analysis. Segmentation level: The segmentation procedure is treated as a whole at this level. Data parallelism is with epochs generated from the original time series. In the example indicated in Fig. 4, the 58,617 data points are covered by 231 epochs of the EEG series. Apparently, the degree of data parallelism at this level equals
the number of epochs from the original EEG data’s perspective, i.e., 231. Calculation level: The decomposition of each epoch requires many computations; parallelism in the calculation level has to do with the amount of computation for the decomposition of components. We can parallelize some small tasks in the decomposition of each epoch, i.e., envelope spectrum extraction, moving average, linear interpolation, and so on. Here, we chose moving average, for example, as depicted in Fig. 5, as each result point in the moving average can be treated as a small task and processed by one thread on one processor; hence, we can process large point calculations at the same time, and the degree of data parallelism at this level equals the number of points from each epoch. We can parallelize the decomposition based phase difference synchronization analysis (AD-PDSA) application by naturally adapting to its parallelism at the series, segmentation, and calculation levels. As indicated in Fig. 6, at the series level, each series of the AD-PDSA decomposition procedure may be mapped onto an individual task. Such tasks are potentially suitable for execution over networked computer nodes. Each individual task can be divided into small segments, which process one epoch of a data series with the embedded decomposition procedure. The tasks per epoch with a major computation workload, such as moving averages, are more suitable for a platform with fine-grain parallelisms such as GPUs or other many-core platforms. The design of a parallelized AD-PDSA application relies primarily on the supporting technique. Taking a traditional distributed computing technique and the GPU as examples, we can anticipate that:
6
C. Cai et al. / Future Generation Computer Systems (
Fig. 6. Parallelization of the DPDSA at the decomposition level; one task per epoch of an epoch series on an individual node.
(1) The capacity of performance improvement using distributed computing is subject to the number of worker nodes, which can be costly. This also means that when the number of worker nodes is limited, using distributed computing may not fully exploit the parallelism of a problem even if the problem’s degree of parallelism is very high. (2) Synchronization and communication between parallel tasks executed over networked computers make distributed computing unsuitable for very fine-grained tasks. 3.2. GPGPU-aided AD-PDSA This study focused on a GPGPU-aided implementation of the AD-PDSA method, referred to as GAD-PDSA. GAD-PDSA has been designed to operate at segmentation and calculation levels to exploit a very fine-grained parallelism.
)
–
As depicted in Fig. 7, our study pays close attention to a GPGPUaided implementation of the LMD method, referred to as G-LMD, as we have previously analyzed G-EEMD; see [25] for further details. G-LMD has been designed to deal with multi-channel data, which intends to exploit very fine-grained parallelism. In our study, the G-LMD algorithm maps the processing procedure with the multichannel data of the LMD algorithm as a large number of parallel tasks. Apart from this, the current implementation of G-LMD is certainly feasible to further parallelize the processing in one trial. For example, we can parallelize the processing of computing the mean of the maximum and minimum points of each half-wave oscillation of the signal; and the procedure to reconstruct the original signal and calculate the frequency modulated signal can be processed in parallel. These procedures can also be mapped into finer parallel sub-tasks. The routine ‘‘Thread_Decomp’’ denotes a CUDA thread corresponding to a decomposition in an ensemble. The routine has a definition in the form: __global__void Thread_Decomp (Epochs[N ], CpSeries[N ][M ]), in which Epochs maintain the epochs of all series to be processed by the routine, and CpSeries store the extracted CPs of each piece of epoch series. Block 1: After initialization, this step prepared the data units to be decomposed. Each original series (NS) was segmented into a number of epochs (NW ). A large number (N = NS × NW ) of EEG data epochs were created and maintained by: Epochs[N ]. A matrix for storing intermediate results was initialized: CpSeries[N ][M ], M was the number of components of an epoch series decomposed by EEMD or LMD. A two-dimensional thread block was defined to identify the CUDA threads. Following this, the algorithm passed control over to the device through the routine Thread_Decomp. In total, N parallel threads were created on the device with each thread executing the extraction of the CPs of an epoch (an element of Epochs); threads were arranged as a two-dimensional block defined by dimBlock. On completion of each thread, each set of CPs was stored in the corresponding slot in CpSeries according to the thread’s ID.
Fig. 7. The execution flow of the GAD-PDSA.
C. Cai et al. / Future Generation Computer Systems (
)
–
7
Table 2 Configuration of the execution environment. Specifications of CPU platforms
Desktop computer
Specifications of NVIDIA GPUs
GeForce GTX 680
Operating system CPU RAM Compilation
Windows 7 Ultimate 64 Intel(R) Core(TM) i7 2600 @ 3.40 GHz 16 G (DDR3 1333 MHz) MS studio 2008, full optimization (/Ox)
CUDA cores Base clock Standard memory Memory bandwidth
1536 1006 MHz 2 GB 192.2 GB/s
5000 4500 4000 3500 3000 2500 2000 1500 1000 500 0
Fig. 8. The runtime performance times with SC-LMD and G-LMD.
Block 2: When all the N threads were finished, the control returned to the host end. The host then divided the CPseries into NP (NS × NC × (NS × NC − 1) × NW ) pairs for the phase synchronization analysis between any two EEG series: NS is the number of EEG series, NW is the number of epochs for each series, and NW is the number of components for each epoch. Another matrix for storing intermediate results was initialized: syn_Results[NR] (NR equals [NS ][NS ][NW ][NC ]). Block 3: The host end got control following all NP synchronization calculations. The initial results stored in syn_Results were processed to obtain the synchronization value from each thread result. The syn_Results of the whole original EEG data were used for any two series or global synchronization analyses. Although the current content of the GAD-PDSA in this paper only concerns the parallelism at the decomposition, segmentation, and calculation levels, it certainly has further parallelized the execution of the decomposition. For example, we completed the parallelization of the procedure by adding white noise to the EEG series for de-noising in EEMD algorithm [25]. We also parallelized the calculation of the matrix multiplication and arrived at further details in LMD and EEMD algorithms on GPGPU. As this paper emphasizes the demonstration of the feasibility and efficiency of the GPGPU compared to the traditional CPU-based high-performance computing techniques in the context of processing non-stationary and non-linear signals, the discussion of parallelism at the decomposition, segmentation, and calculation levels suffices for this purpose although there does exist parallelism below these levels. 4. Evaluation of the runtime performance A performance evaluation was carried out to compare two alternative implementations of the AD-PDSA application. These included two serial implementations, i.e., (1) the original serial ADPDSA method implemented in C, written as ‘‘SC-AD-PDSA’’, and
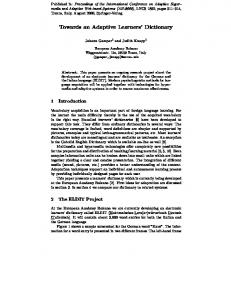
one parallelized implementation, i.e., (2) the one developed using CUDA (‘‘GAD-PDSA’’). Experiments were conducted on a powerful PC equipped with a NVIDIA GeForce GTX 680 video card (Kepler Architecture). The configurations of the execution environment are listed in Table 2. The serial AD-PDSA, i.e., SC-AD-PDSA, was executed on the host (CPU). Almost all the workload of the GAD-PDSA based application was handled by the device (GPU). Two EEG series were analyzed by the computer systems. Each of the EEG series was divided into 198 time windows, i.e., 2 ∗ 198 epochs of series. With varying epoch lengths, the efficiency of SCLMD and G-LMD was analyzed. Since the efficiency of parallelized EEMD has already been presented in our previous study [25], here, we briefly present the LMD decomposition derived from the test in which 2 ∗ 198 epochs were decomposed. The analysis of execution times on the two computer system is presented as follows: First, we analyzed the results of the two methods. The total execution time of SC-LMD was ∼14.155 s to ∼4595.188 when handling the smallest and largest epochs, respectively. The time values became ∼61.987 to ∼1693.905 using G-LMD (on GTX 680) when handling the same data series with SC-LMD. From all the execution times of SC-LMD and G-LMD, we conclude that SC-LMD was very sensitive to the data scale, which was not the case in G-LMD. The scalability of both SC-LMD and G-LMD will then be presented. The ratio of the execution time of SC-LMD versus the length of the epochs ranged between (1024/14.155) the effiand (32768/4595.188 ≈ 7.1309) for the shortest and longest lengths. For G-LMD (on GTX 680), the two figures became (1024/61.987 ≈ 16.5200) and (32768/1693.905 ≈ 19.3447). The results indicate a significant improvement of LMDs scalability in G-LMD compared with SC-LMD, especially dealing with longer series data. As depicted in Fig. 8, we then compared the trend graph of SCLMD and G-LMD when dealing with different data sizes and found that the execution time of SC-LMD was the exponential function of the data size, which is quite unacceptable when the size of
8
C. Cai et al. / Future Generation Computer Systems (
)
–
(a) MWT.
(b) EEMD.
(c) DB.
Fig. 9. Comparison between EEMD and DB in the effect of analyzing ERP data. MWT is the correct reference with a scale of 99.
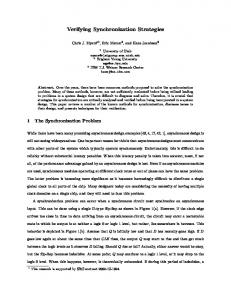
the data increases. However, the execution time of G-LMD was the polynomial function of the data size, which is acceptable even though the size of the data increases. Since most of the operations in the G-LMD program represented data exchanged from CPU to GPU or GPU back to CPU and logical operations, as we all know, memory copies or logical operations are quite time consuming when using GPU for computing. 5. EEG analysis with AD-PDSA The effectiveness of using AD-PDSA in analysis of the synchronization of series is examined upon the EEG data collected from a ten-year-old Chinese. We designed two cases for analysis. The first one is testing the advantages of the adaptive decomposition algorithm in the process of signal decomposition compared to the wavelet decomposition. The other one is applying AD-PDSA to the analysis of epileptic seizure data. 5.1. Advantages of adaptive decomposition algorithm Neural data was recorded from a ten-year-old Chinese. EEG data was sampled at 250 Hz. In the experiment, the subject was shown a picture for 1500 ms, followed by a sound. The sound resulted in two cases: a match with the picture and a mismatch with the picture. Each trial lasted 4000 ms. The interval between two continuous tasks was 1000 ms. The number of trials here was 30. Compared with the DB wavelet decomposition, the AD-PDSA used EEMD as a basic algorithm. In addition, MWT was referenced as the correct result. The signals were decomposed into seven layers by two means: DB4 and EEMD, respectively, and the scale of MWT was set to 99. We then decomposed two-series ERP data, selected from the collected signals above, with DB wavelet and EEMD, respectively, and used MWT to compute the synchronization of mismatched and matched data. The coherence difference was obtained by subtracting the value from the matched task from that of the unmatched task, as shown in Fig. 9:
In Fig. 9, the MWT shows apparent synchronization at low frequency in the 400th second since the θ band plays an important role in coordinating sensory and motor brain activity in various brain regions to facilitate exploratory learning and navigational planning [26]. This proves that EEMD performs better than the DB wavelet. There are two aspects to further illustrate the advantages of EEMD. First, EEMD occupies less memory, which helps to generate more ideal results; secondly, EEMD is self-adaptive, which extracts the basic functions of signals according to their inherent features instead of introducing basic functions to describe primary signals. For example, wavelet needs to introduce basic wavelet functions and account for frequency. 5.2. Synchronization of epilepsy EEG data using GAD-PDSA The effectiveness of using AD-PDSA in analyses of the synchronization between signals was examined from the EEG data collected from patients suffering epileptic seizures. The extended AD-PDSA applies to the global synchronization of components that are decomposed from one series. The synchronization of components from one series of different times can reveal global changes during epilepsy. We divided epilepsy EEG data into three categories: pre-epilepsy seizure, inepilepsy seizure, post-epilepsy seizure. Each category contained similar points of 19,200 with the sampling rate of 256/s. The EEG data was decomposed into nine components using the EEMD method; the synchronization was then calculated between any two components; ensemble synchronization was eventually obtained. As revealed Fig. 10(a) is a complete record of epileptic seizures, including pre-morbid pathogenesis and after the onset of disease information. We applied AD-PDSA to the three stages above, obtained nine components containing various signal information, respectively, and performed a synchronization analysis of the constituents in three stages. Fig. 10(b) shows the synchronization matrix of different constituents in three stages. As shown in
C. Cai et al. / Future Generation Computer Systems (
)
–
9
(a) EEG series.
(b) DPSA.
(c) Ensemble synchronization. Fig. 10. One series epilepsy seizure dataset and its ensemble synchronization; (a) original three states: pre-epilepsy seizure, in-epilepsy seizure, and post-epilepsy seizure; (b) synchronization between any two components in different states; (c) ensemble synchronization of different states.
Fig. 10(b-1), in the pre-morbid stage of epileptic seizure, synchronization between the nine constituents are almost identical, in that, each constituent performs steadily in the brain. In Fig. 10(b-2), with the pathogenesis of the disease, constituents become shaky and unstable, and the synchronization tends to be unevenly distributed. As shown in Fig. 10(b-3), following the onset of the disease, the synchronization between the constituents comes to be gradually steady. 6. Conclusions In order to cater for the requirements of analyzing large-scale, non-stationary, and non-linear data, this study explored an approach to (1) adaptively measure the global synchronization of multiple components from the same data segment or multivariate data, and (2) enable efficient and scalable synchronization analysis for potential real-time application in practice. The first issue was addressed by the adaptive decomposition (i.e., EEMD or LMD) based phase difference synchronization analysis (AD-PDSA) method. EEMD and LMD were salient in adaptively exploring the structure of non-stationary, non-linear data as well as the merit of resistance to noises. This approach proposed a suite of DPSA measures, which reflects the synchronization strength of bivariate data series, i.e., two IMFs/PFs of the same original data segment or two different segments. An S-estimator was defined to quantify the global synchronization strength by constructing a correlation matrix using DPSA measures. The scalability issue was tackled by massively paralleling the global synchronization measurement application via the design and development of a GAD-DPSA approach developed from a GPGPU. A thorough analysis of the DPSA-based application was conducted and revealed a built-in fine-grained parallelism. The performance of the proposed approach is inspiring as the execution time of GAD-DPSA was the polynomial function of the data size while the execution time of a sequential counterpart (CPU-based) was the exponential function of the data size.
We utilized the GAD-DPSA to examine its effectiveness in analyzing a multi-channel, event-related potential (ERP) recording against the DB wavelet with the reference of the MWT. The result of the DPSA clearly showed apparent synchronization at low frequency, at a time point that matched the results of the MWT, while the results of the DB wavelet failed to identify this phenomenon. The GAD-DPSA was then applied to experimental datasets to analyze the potential synchronization of EEG data obtained from an epilepsy patient. The results indicate that the new method does not only detect a reliable phase correlation between the components of one series but also between multiple EEG data series. The GAD-DPSA provides an ideal tool for the real-time global synchronization analysis of multivariate non-stationary, non-linear neural signals. Acknowledgments This research was supported in part by the National Natural Science Foundation of China (Nos. 61272314, and 61271409), the Program for New Century Excellent Talents in University (NCET11-0722), the Excellent Youth Foundation of Hubei Scientific Committee (No. 2012FFA025), the Natural Science Foundation of Hubei Province (No. 2011CDB159), and the Specialized Research Fund for the Doctoral Program of Higher Education (20110145110010). References [1] X. Li, D. Cui, P. Jiruska, J.E. Fox, X. Yao, J.G. Jefferys, Synchronization measurement of multiple neuronal populations, J. Neurophysiol. 98 (2007) 3341–3348. [2] A. Scrinzi, M. Geissler, T. Brabec, Attosecond cross correlation technique, Phys. Rev. Lett. 86 (2001) 412–415. [3] C. Carmeli, M.G. Knyazeva, G.M. Innocenti, O. De Feo, Assessment of EEG synchronization based on state-space analysis, Neuroimage 25 (2005) 339–354. [4] A. Kraskov, Synchronization and interdependence measures and their applications to the electroencephalogram of epilepsy patients and clustering of data, NIC-Directors. Ph.D., Jülich, Germany, 2004. [5] F. Mormanna, K. Lehnertza, P. Davidb, C.E. Elgera, Mean phase coherence as a measure for phase synchronization and its application to the EEG of epilepsy patients, Physica D 144 (2000) 358–369.
10
C. Cai et al. / Future Generation Computer Systems (
[6] B. Jérémie, L. Marieke, D.M. Fabien, A. David, A new statistical test based on the wavelet cross-spectrum to detect time–frequency dependence between non-stationary signals: application to the analysis of cortico–muscular interactions, NeuroImage 55 (2011) 1504–1518. [7] P. Grosse, M.J. Cassidy, P. Brown, EEG-EMG, MEG-EMG and EMG-EMG frequency analysis: physiological principles and clinical applications, Clin. Neurophysiol. 113 (2002) 1523–1531. [8] D.M. Hallidaya, B.A. Conwayb, S.F. Farmerc, J.R. Rosenberga, Using electroencephalography to study functional coupling between cortical activity and electromyograms during voluntary contractions in humans, Neurosci. Lett. 241 (1998) 5–8. [9] T. Mima, M. Hallett, Corticomuscular coherence: a review, J. Clin. Neurophysiol. 16 (1999) 501–511. [10] N.E. Huang, Z. Shen, S.R. Long, The mechanism for frequency downshift in nonlinear wave evolution, Adv. Apl. Mech. 32 (1996) 59–117. [11] N.E. Huang, Z. Shen, S.R. Long, M.C. Wu, H.H. Shih, Q. Zheng, N. Yen, C.C. Tung, H.H. Liu, The empirical mode decomposition and the Hilbert spectrum for nonlinear and non-stationary time series analysis, Proc. R. Soc. Lond. Ser. A Math. Phys. Eng. Sci. 1971 (1998) 903–995. [12] A.D. McAulay, Hilbert transform and mirror-image optical correlators, Appl. Opt. 39 (2000) 2300–2309. [13] J.M. Steele, The Cauchy–Schwarz Master Class: An Introduction to the Art of Mathematical Inequalities, Cambridge University Press, Cambridge, 2004. [14] I.H. Stevenson, K.P. Kording, How advances in neural recording affect data analysis, Nat. Neurosci. 14 (2011) 139–142. [15] L.Z. Wang, G.V. Laszewski, A.J. Younge, X. He, M. Kunze, J. Tao, C. Fu, Cloud computing: a perspective study, New Gener. Comput. 28 (2010) 137–146. [16] L.Z. Wang, M. Kunze, J. Tao, G.V. Laszewski, Towards building a cloud for scientific applications, Adv. Eng. Softw. 42 (2011) 714–722. [17] L.Z. Wang, Implementation and performance evaluation of the parallel corba application on computational grids, Adv. Eng. Softw. 39 (2008) 211–218. [18] L.Z. Wang, M. Kunze, J. Tao, Performance evaluation of virtual machinebased grid workflow system, Concurr. Comput.: Pract. Exper. 20 (2008) 1759–1771. [19] L.Z. Wang, G.V. Laszewski, F. Huang, J. Dayal, T. Frulani, G. Fox, Task scheduling with ann-based temperature prediction in a data center: a simulation-based study, Eng. Comput. 27 (2011) 381–391. [20] L.Z. Wang, S.U. Khan, Review of performance metrics for green data centers: a taxonomy study, J. Supercomput. 63 (2013) 639–656. [21] W.F. Zhang, L.Z. Wang, W.J. Song, Y. Ma, D.S. Liu, P. Liu, D. Chen, Towards building a multi-datacenter infrastructure for massive remote sensing image processing, Concurr. Comput.: Pract. Exper. 25 (2013) 1798–1812. [22] Y. Ma, L.Z. Wang, D.S. Liu, T. Yuan, P. Liu, W.F. Zhang, Distributed data structure templates for data-intensive remote sensing applications, Concurr. Comput.: Pract. Exper. 25 (2013) 1784–1797. [23] O. Schenk, M. Christena, H. Burkharta, Algorithmic performance studies on graphics processing units, J. Parallel Distrib. Comput. 68 (2008) 1360–1369. [24] NVIDIA, NVIDIA CUDA programming guide, 2008. http://www.nvidia.com/ object/cuda_develop.html. [25] D. Chen, D. Li, M.Z. Xiong, H. Bao, X.L. Li, GPGPU-aided ensemble empiricalmode decomposition for EEG analysis during anesthesia, IEEE Trans. Inf. Technol. Biomed. 14 (2010) 14–17. [26] J.B. Caplan, J.R. Madsen, A. Schulze-Bonhage, R. Aschenbrenner-scheibe, E.L. Newman, M.J. Kahana, Human θ oscillations related to sensorimotor integration and spatial learning, J. Neurosci. 23 (2003) 4726–4736.
Chang Cai received the B.Sc. degree in computer science from the China University of Geosciences, China. He is currently working towards the Ph.D. degree from the School of Computer Science, China University of Geosciences. His research interests include neuroinformatics and high performance computing.
)
– Ke Zeng received the B.Sc. degree and the M.Eng. degree in computer science from the China University of Geosciences, China. He is currently working towards the Ph.D. degree from the National Key Laboratory of Cognitive Neuroscience and Learning, Beijing Normal University, Beijing, China. His research interests include neuroinformatics and signal processing.
Lin Tang received the B.Sc. degree in computer science from the China University of Geosciences, China. He is currently working towards the master degree from King Abdullah University of Science and Technology. His research interests include computer modeling and simulation and signal processing.
Dan Chen received the B.Sc. degree in applied physics from Wuhan University, China and the M.Eng. degree in computer science from the Huazhong University of Science and Technology, China. He received another M.Eng. and the Ph.D. degrees in computer engineering from Nanyang Technological University, Singapore. He was an HEFCE research fellow with the University of Birmingham, United Kingdom. His research interests include computer modeling and simulation, high performance computing, and neuroinformatics.
Weizhou Peng received the B.Sc. degree and the M.Eng. degree in computer science from the China University of Geosciences, China. His research interests include neuroinformatics and signal processing.
Jiaqing Yan received the B.Sc. degree and the M.Eng. degree in automation from Yanshan University, Qinhuangdao, China. He is currently working towards the Ph.D. degree at the School of Electrical Engineering, Yanshan University. His research interests include neural engineering and signal processing.
Xiaoli Li received the B.Eng. degree and the M.Eng. degree from the Kunming University of Science and Technology, and the Ph.D. degree from the Harbin Institute of Technology, China, all in mechanical engineering. He is currently a professor and vice director with the National Key Laboratory of Cognitive Neuroscience and Learning, Beijing Normal University, China. He had worked with the City University of Hong Kong, Hannover University, Germany, Chinese University of Hong Kong, University of Birmingham, and Yanshan University. China. His research interests include neural engineering, computational intelligence, signal processing and data analysis, monitoring system, manufacturing system.