Nov 16, 2007 - and illuminate the nation's scientific frontiers, the lab develops complex ... Linux/Unix library and system call tracing utility ltrace, or optionally ...
Towards an I/O Tracing Framework Taxonomy Andy Konwinski, John Bent, James Nunez, and Meghan Quist Los Alamos National Laboratory
{konwinski, johnbent, jnunez, meghan}@lanl.gov ABSTRACT There is high demand for I/O tracing in High Performance Computing (HPC). It enables in-depth analysis of distributed applications and file system performance tuning. It also aids distributed application debugging. Finally, it facilitates collaboration within and between government, industrial, and academic institutions by enabling the generation of replayable I/O traces, which can be easily distributed and anonymized as necessary to protect confidential or sensitive information. As a response to this demand for tracing tools, various means of I/O trace generation exist. We first survey the I/O Tracing Framework landscape, exploring three popular such frameworks: LANLTrace [3], Tracefs [1], and //TRACE1 [2]. We next develop an I/O Tracing Framework taxonomy. The purpose of this taxonomy is to assist I/O Tracing Framework users in formalizing their tracing requirements, and to provide the developers of I/O Tracing Frameworks a language to categorize the functionality and performance of them. The taxonomy categorizes I/O Tracing Framework features such as the type of data captured, trace replayability, and anonymization. The taxonomy also considers elapsed-time overhead and performance overhead. Finally, we provide a case study in the use of our new taxonomy, revisiting all three I/O Tracing Frameworks explored in our survey, to formally classify the features of each.
Categories and Subject Descriptors D.4.8 Performance – Measurements. D.2.5 Debugging – Distributed Debugging.
General Terms Measurement, Performance. Standardization.
Keywords Tracing, parallel, file systems.
1. INTRODUCTION As part of the overall objective of Los Alamos National Laboratory (LANL) to maintain national defense and to explore and illuminate the nation’s scientific frontiers, the lab develops
complex data intensive scientific applications. To run these "killer apps", the lab deploys and maintains cutting-edge supercomputer clusters. Recently, in collaboration with IBM, LANL is constructing Roadrunner, a peta-scale computer cluster characterized by its heterogeneous architecture including both traditional general purpose processors and cell processors. There is high demand for I/O tracing application data collection in HPC environments such as Roadrunner for several reasons. Parallel scientific applications are inherently complex. Many use an MPI-IO library for accessing data stored in a parallel file system. During the development of such applications, when unexpected I/O behavior is observed, traditional debugging tools alone are often inadequate for identifying bugs related to the complexity rooted in the parallel nature of the applications and the highly distributed software and hardware platforms on which they are run. I/O tracing and trace data analysis tools provide a natural solution to I/O debugging problems and performance tuning in distributed applications. Many I/O tracing tools have been built [1],[2],[3],[6]. However, each tool is designed to collect slightly different information about the I/O being done. In addition each approach to collecting I/O data has both advantages and disadvantages. To allow for comparison of various I/O Tracing Frameworks, a set of commonly used features is identified. We accomplish this by surveying several I/O Tracing Frameworks and building a taxonomy that can be used for characterizing and quantifying the features and performance of any I/O Tracing Framework. This paper is organized as follows. Section 2 surveys three I/O data collection mechanisms, i.e. I/O Tracing Frameworks. Section 3 defines a simple I/O Tracing Framework taxonomy motivated by the survey findings. Section 4 provides a case study in the use of our taxonomy to classify the three I/O Tracing Frameworks selected. Sections 5 and 6 conclude and describe future work.
2. I/O TRACING FRAMEWORK SURVEY We survey three I/O Tracing Frameworks: LANL-Trace [3], Tracefs [1], and //TRACE1 [2]. There are significant differences between these and we focus on identifying the strengths and weaknesses of each.
2.1 LANL-Trace © 2007 Association for Computing Machinery. ACM acknowledges that this contribution was authored or co-authored by a contractor or affiliate of the U.S. Government. As such, the Government retains a nonexclusive, royalty-free right to publish or reproduce this article, or to allow others to do so, for Government purposes only.
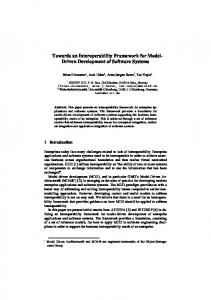
LANL-Trace is a tracing framework that wraps the standard Linux/Unix library and system call tracing utility ltrace, or optionally, its system call only variant, strace. LANL-Trace generates three types of human readable output. (see Figure 1)
LA-UR-07-7660 Supercomputing'07, Nov. 10-16, 2007, Reno, NV. Copyright 2007 ACM ISBN 978-1-59593-899-2/07/11...$5.00
1.
For this paper, a pre-release version of //TRACE was used. Development since that release may affect the accuracy of our conclusions about it.
Raw Trace Data 10:59:47.092996 MPI_File_open(92,
0x80675c0,
37,
0x80675a8,
0xbfdfe5e4
10:59:47.093718 SYS_statfs64(0x80675c0, 84, 0xbfdfe410, 0xbfdfe410, 0xbd3ff4) = 0 10:59:47.105818 SYS_open("/etc/hosts", 0, 0666)
= 3
10:59:47.105913 SYS_fcntl64(3, 1, 0, 0, 0xbd3ff4) = 0 < 0.000017> ...
2.3 //TRACE
Aggregate Timing Information # Barrier before /mpi_io_test.exe "-type" "1" "-strided" "1" "-size" "32768" "-nobj" "1" 7: host13.lanl.gov (10378) Entered barrier at 1159808385.170918 7: host13.lanl.gov (10378) Exited barrier at 1159808385.173167 3: host17.lanl.gov (11335) Entered barrier at 1159808385.166396 3: host17.lanl.gov (11335) Exited barrier at 1159808385.168893 # Barrier after /mpi_io_test.exe "-type" "1" "-strided" "1" "-size" "32768" "-nobj" "1" ...
Call Summary # #
SUMMARY COUNT OF TRACED CALL(S) Function Name
Number of Calls
Total time (s)
============================================================================= MPIO_Wait MPI_Barrier MPI_Comm_rank
One very important factor for use was that Tracefs was not designed to trace parallel workloads such as those written at LANL. While we were able to collect traces using Tracefs on local file systems (ext3) and Network File System (NFS), we discovered that it is not compatible “out of the box” with our parallel file system.
2
0.000118
29
2.156431
2
0.000120
SYS_open
39
0.004612
SYS_read
565
0.022137
Figure 1. Sample output from LANL-Trace. This figure shows a sample of the three types of output generated by LANL-Trace, including the raw trace data collected from each node, as well as aggregate timing and function call information. The aggregate timing information is designed to allow analysis and replay tools to account for time drift and skew amongst the distributed clocks. One advantage of LANL-Trace is that it is simple to understand and use. Because of its simple nature, it is also easy to modify. However, LANL-Trace’s simplicity is a trade-off, as LANL-Trace incurs higher overhead.
2.2 Tracefs We next turn to Tracefs, a stackable file system [7]. Using the stackable file system framework, Tracefs can be mounted on top of a variety of file systems of your choice (e.g. NFS, ext3, etc.). Once mounted, any I/O written to Tracefs can be traced at varying degrees of granularity. It offers a comprehensive suite of tracing functionality, including trace data anonymization, aggregation (via event counters), and more. Performance overhead varies greatly depending on which functionality is employed. In experiments by its developers [1], Tracefs manifests up to 12.4% elapsed time overhead for tracing all file system operations on an I/O intensive workload, and additional overhead for advanced features such as encryption and checksum calculation. Also, to achieve such functionality, Tracefs is implemented as a kernel module. We find that it requires a significant amount of installation and configuration effort, such as dealing with root permissions on compute nodes in a cluster.
//TRACE focuses on generating accurate replayable I/O traces of parallel applications that use MPI. To accomplish this they determine inter-node data dependencies by using I/O throttling [9]. This technique involves a time consuming process of manually slowing the response time of a single node to I/O requests associated with a particular parallel application and observing the behavior of other nodes looking for causal dependencies between nodes used in a parallel application. Unlike Tracefs, //TRACE was developed specifically for use in tracing distributed applications. Because //TRACE focuses on high replay accuracy, it pays the trade-off of significant beginning to end time overhead. That is, the generation of a replayable trace is a time consuming process. While this is sometimes acceptable, in many HPC environments, such as LANL, computing cycles are highly valuable. Thus, there is a very real cost for using //TRACE.
3. THE TAXONOMY Our aim is to construct a simple taxonomy that captures important features of I/O Tracing Frameworks, which can then be used by potential users to formalize their tracing requirements, and by I/O Tracing Framework developers as a language to categorize the functionality and performance of their tool. This taxonomy consists of two elements: feature classification and overhead measurement. The feature classification is done by inspection of the I/O Tracing Framework and identifies distinguishing characteristics. The overhead measurement is based upon empirical measurements of the performance and end-to-end timing overheads using a synthetic application benchmark. Together, these elements form a picture of the advantages and disadvantages for the potential user of an I/O Tracing Framework.
3.1 Feature Classification Feature classification provides a means of quickly comparing the features of various I/O Tracing Frameworks, enabling better tool selection by users in need of trace data. Eventually, classification data will be valuable for the design of a single comprehensive trace data aggregation framework and API as described in the the future work section. In order to classify an I/O Tracing Framework we install and use the framework, investigate documentation and published results of the use of the tool. By means of this process, we identify the following qualitative features: Parallel file system compatibility. We have not restricted ourselves to the analysis of strictly parallel I/O Tracing Frameworks. We believe that many tools used in non-parallel architectures can be augmented, sometimes quite easily, to add parallel functionality. In addition, the techniques employed by the non-parallel I/O Tracing Framework may be valuable in the construction of a new parallel I/O Tracing Framework. We therefore use this classification feature to distinguish between I/O
Tracing Frameworks that worked on our parallel file system “out of the box” (i.e. with little or no modification for parallelization). Ease of installation and use. Depending on the use of trace data, it may be better to trade more complex functionality for quick and painless installation, collection and use of simple trace data. The use of some interpreted languages or binary formats not supported by vanilla Linux installations may result in installation or use complications. In addition, requiring special permissions, such as root account access, may also impede ease of use.
Table 1. An I/O Tracing Framework summary table. The classification features and overhead measurements of any I/O Tracing Framework can be summarized for quick reference and comparison to other Frameworks. Feature Parallel file system compatibility Ease of installation and use
Control of trace granularity Replayable trace generation
[Yes or No]
Trace replay fidelity
Describe experiment results
Reveals dependencies
[Yes or No] [1 (V. Passive), thru 5 (V. Intrusive)] [Yes or No]
Anonymization
Event types. Various types of events might be traced, including I/O function calls such as functions in a Message Passing Interface (MPI), or messages passed between nodes in a cluster such as Roadrunner, or event messages passed between layers of a protocol stack within a particular device/node [6].
Intrusive vs. Passive
Replayable trace generation. The I/O Tracing Framework may optionally generate a pseudo-application from collected trace data with the aim of reproducing the I/O signature of the original application. Such a pseudo-application is especially valuable in research settings such as academia where collaboration on I/O related research is popular, and in general for I/O debugging. Trace replay fidelity. For I/O Tracing Frameworks that support replayable trace generation, it is important to verify that the pseudo-application generated manifests I/O representative of the original applications. One way to verify this is to use the I/O Tracing Framework to trace both the pseudo-application and the original application and compare the traces generated. Another test is to compare the end-to-end run time of both using a utility such as the Linux command line time utility. Reveals Dependencies. Several techniques have been employed in tracing mechanisms to expose event dependencies and causality. This information can be costly to collect in terms of end-to-end application timing overhead but can be highly valuable to developers and debuggers alike. Intrusive vs. Passive. Traditionally, some tracing mechanisms require the instrumentation of application source code. This is an important factor since such instrumentation may be costly in terms of development time and energy for many applications, especially in the case of large scientific applications such as those used at LANL. Analysis tools. An important aspect of any trace operation is the constructive use of the trace data collected. Some I/O Tracing Frameworks include useful tools for manipulation and analysis of trace data collected.
[Yes or No] [1 (V. Easy) thru 5 (V. Difficult)] [None or 1 (Simple) thru 5 (V. Advanced)] [Systems calls, library calls, FS events] [Yes or No]
Anonymization. Often traces are collected for distribution, such as recently published traces by LANL [5]. In such cases, it is often desirable to anonymize personal or sensitive data. Simple anonymization involves replacing all potentially sensitive text within the trace data such as user name, UID, or file content, with randomly generated bytes. More advanced anonymization might provide a means of specifying which parts of the trace need to be anonymized.
Control of trace granularity. Performance overhead is typically a function of the granularity of the tracing data collected. Therefore, it is desirable to allow for collection of only as much information as is required by the person using the trace data.
Events types
Analysis tools Trace data format Accounts for time skew and drift Elapsed time overhead
[Binary or Human readable] [Yes or No] Describe experiment results
Trace data format. Some tracing mechanisms [1] generate traces in binary format in order to save space and facilitate automated parsing. However, sometimes it is convenient to visually inspect traces and then having human readable trace data is necessary. In addition to classifying qualitative features if an I/O Tracing Framework by inspection and investigation, it is also important to measure the performance overhead caused by it when running applications with tracing enabled. In order to account for I/O tracing overhead we consider the following quantitative feature: Accounts for time drift and skew. Time skew is the difference between distributed clocks at any single moment in time. Time drift is the change in time skew over time. Trace frameworks which capture and report timestamps from each of the parallel processes should allow for the possibility of drift and skew and provide mechanisms by which developers and debuggers can account for them. Elapsed time overhead. Elapsed time overhead, also known as “wall clock time” overhead is defined as: elapsed time of traced applicatio n - elapsed time of untraced applicatio n elapsed time of untraced applicatio n
These measurements can be made using a tool such as the Linux command line utility time. This feature is important because distributed applications in HPC tend to be very large, thus even a relatively small performance overhead can add considerably (hours or even days) to the applications run time.
3.2 Summary Table After applying the taxonomy to an I/O Tracing Framework, a simple reference table can be built summarizing the results for quick feature comparison (Table 1).
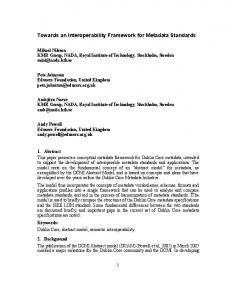
Figure 2. LANL-Trace overhead with N processes writing one 100GB file, strided. This is the benchmark parameterization most demanding on the parallel I/O file system. We observe bandwidth as a logarithmic function of block size and an approximately constant I/O bandwidth overhead. .
Figure 4. LANL-Trace overhead with N processes writing N 10GB files. We observe bandwidth overhead similar to that of N to 1, non-strided.
4.1.1 LANL-Trace feature classification Much of the intuition we expressed during our survey of LANLTrace, such as its ease of installation and lack of advanced features, is captured in the following taxonomy feature classification: Parallel file system compatibility: We experienced no difficulty using our parallel file system with little or no modification to LANL-Trace. Ease of installation and use: Because of the simplicity of the tracing mechanism, installation and use were uncomplicated. However, Perl, strace, and ltrace were required on all compute nodes. Anonymization: Not supported. Event types: Library and system I/O function calls captured when using ltrace, system calls only when using strace. These tools cannot track memory-mapped I/Os.
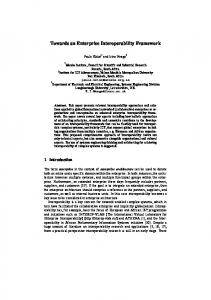
Figure 3. LANL-Trace performance overhead, N processes writing one 100GB file, non-strided. Bandwidth overhead approaches a constant factor of untraced application bandwidth as block size is increased.
Control of trace granularity: The user may choose between the use of strace, which provides system call only tracing, and ltrace, which provides tracing of both system calls and linked library calls.
4. TAXONOMY CASE STUDY
Replayable trace generation: Not supported, the focus is on trace distribution, not replayability, though beta development is under way on a pseudo-application generator from trace data. However, it is trivial to imagine a replayer being built that reads and replays the raw trace files.
We apply our taxonomy to LANL-Trace, Tracefs, and //TRACE.
Trace replay fidelity: Not supported.
4.1 LANL-Trace Classification
Reveals Dependencies: Not supported.
In an effort to encourage collaboration between government and academic parallel I/O research groups, LANL committed to releasing anonymized traces of the large scientific applications. LANL-Trace was the tool chosen for the generation of these traces. We had the unique opportunity to apply our I/O Tracing Framework taxonomy for a complete classification of LANLTrace during this process.
Intrusive vs. Passive: Passive, no instrumentation of application required.
Analysis tools: Simple aggregation of node timings provided as standard output which can be used to account for different nodes having clocks that are off by a constant difference (skew) and different nodes whose clocks are off by a changing difference (drift).
We believe the performance overhead is worse for small block sizes because a constant number of traced events are generated for each block. The number of such events is inversely proportional to block size, thus a smaller block size implies more events to trace.
Trace data format: All three output types produced are human readable.
4.2 Tracefs Classification
Accounts for time skew and drift: Yes. LANL-Trace runs a simple MPI job before and after running the traced application. This job reports the observed time for each node, does a barrier, and then reports the time again.
Parallel file system compatibility: Tracefs did run on our parallel file system without significant modification, though tracing of I/O on the Network File System (NFS) was functional.
Elapsed time overhead: The measured elapsed time was observed to be highly variable ranging from 24% to 222%. The variability was observed to relate directly to the block size of the I/O performed by the application. To complete our LANL-Trace taxonomy case study, we compiled our taxonomy results into a summary table (Table 2).
4.1.2 LANL-Trace Overhead Measurement As the developers of LANL-Trace, we are in a unique position to perform more complex analysis of its performance overhead. The application that we traced is the LANL bandwidth benchmark used to perform parameter studies on the various LANL supercomputers. As such, in our experiments we were able to perform detailed analyses of where the overhead was incurred The experiments were run on 32-processors on a cluster with a gigabit ethernet-over-copper interconnect. The compute nodes are running Linux 2.6.14. The MPI library we are using is mpich 1.2.6. In the experiments, we tested under three parallel I/O access patterns2. First, N processors writing to N files, 10GB each. Second, N processors writing to a single 100GB file, with each processor writing to a single contiguous spot within the file. This behavior is called non-strided. Third, again N processors writing to a single 10GB file, this time each processor wrote to many spots within the file (often this is used to keep similar data grouped by proximity within the file). This is called strided behavior. In order to measure bandwidth overhead, we wrote constant sized output files under RAID 5 with a stripe width of 64 kilobytes across 252 hard drives. In all cases, we saw higher bandwidth overhead for tracing smaller block sizes than for larger block sizes. Specifically, we measured for N-to-1 strided, N-1 non-strided, and N-to-N. At block sizes of 64KB, we saw bandwidth overheads of 51.3%, 64.7, and 68.6%, respectively. For block sizes of 8192KB, bandwidth overheads were 5.5%, 6.1%, and 0.6%, respectively.
2.
For further description of the meaning of the various I/O access patterns (i.e. N-N, N-1 strided, N-1 nonstrided) shown in the graphs, see [12].
Using our taxonomy, we apply feature classification to Tracefs:
Ease of installation and use: Being implemented as a kernel module we found that it requires a significant amount of installation and configuration effort such as dealing with root permissions on compute nodes. Anonymization: Advanced, Tracefs allows for secret key encryption using Cipher Block Chaining (CBC) of trace data with a fine grain user-level selection mechanism for deciding which fields (e.g. UID, GID) to encrypt/anonymize. This feature is not classified as “Very advanced” because no mechanism is provided for true anonymization (i.e. randomization) of trace data. Since trace data may be retained for many years, there is a non-zero probability of trace encryption being subverted and anonymization compromised. Event types: File system operations, i.e. Virtual File System (VFS) calls, such calls include standard (i.e. local) file system calls, in addition to calls which might be missed if tracing was done at a lower level such as memory-mapped I/O or Network File System (NFS) calls. Control of trace granularity: A flexible declarative syntax is provided for user-level specification of file system operations to be traced. Replayable trace generation: While not currently supported, the framework’s developers report replayable trace generation as a focus of future work [1]. Trace replay fidelity: Not supported. Reveals Dependencies: Not supported. Intrusive vs. Passive: Passive, no instrumentation of application required. Analysis tools: Not supported. Trace data format: Binary, with optional checksumming, compression, encryption, or buffering (to improve performance) of output. Accounts for time skew and drift: No, because Tracefs was not originally developed to trace parallel applications and thus has no inherent parallelization mechanism, drift and skew are not considered.
Table 2. Classification summary table for various Traces Feature
LANL-Trace
Tracefs
//TRACE
Parallel file system compatibility
Yes
No
Ease of installation and use
2 (Easy)
4 (Difficult)
Yes 2 (Easy)
Anonymization
No
4 (Advanced)
No
Events types
Systems calls, library calls
File system operations
I/O System calls
Control of trace granularity
1 (Simple)
5 (V. Advanced)
No
Replayable trace generation
No
No
Yes
Trace replay fidelity
N/A
N/A
As low as 6% 5
Reveals dependencies
No
No
Yes
Intrusive vs. Passive
1 (Passive)
1 (Passive)
1 (Passive)
Analysis tools
No
No
No
Trace data format
Human readable
Binary
Human readable
Accounts for time skew and drift
Yes
N/A
No
Elapsed time overhead
24% - 222% 3
≤12.4% 4
N/A 6
Elapsed time overhead: The developers of Tracefs reported extensive testing of the elapsed time overhead incurred by their framework under various levels of trace granularity for both an I/O intensive application as being less than 12.4%.
Trace replay fidelity: 6% [2], trace replay accuracy is the central focus of //TRACE. However, //TRACE provides for user-control over replay accuracy by using sampling for their node-throttling technique.
We present a summary of the results of our taxonomy feature classification of Tracefs in a Table 2.
Reveals Dependencies: Yes, //TRACE creates inter-node dependency maps for use in generating accurate replayable traces of parallel applications.
4.3 //TRACE Classification In this section we use our taxonomy to apply feature classification to //TRACE:
Intrusive vs. Passive: Passive, no instrumentation of application required.
Parallel file system compatibility: Because //TRACE was developed for use in MPI/MPI-IO applications, we were able to use it “out of the box” on our parallel file system.
Analysis tools: Not supported.
Ease of installation and use: For our evaluation, were working with a pre-release version of the I/O Tracing Framework, but nonetheless experienced no problems installation or usage. Anonymization: Not supported. Event types: System I/O calls are traced using dynamic library interposition [11]. Like strace and ltrace (and thus LANLTrace), this mechanism cannot track memory-mapped I/Os. Control of trace granularity: All I/O system calls are captured. This is a side affect of the framework design objective to capture complete and accurate repayable traces. Replayable trace generation: Yes.
3.
High variance due to different I/O access patterns (N-N, N-1, N-N)
4.
Reported as maximum application elapsed time for I/O intensive benchmark [1]
5.
Represents maximum (across test applications) of errors (averaged across multiple runs) as published by the tool’s authors. By design, however, this number is highly variably, see “Trace replay fidelity” in 4.3 or [2] for further discussion.
6.
Elapsed time overhead is adjustable by design and ranges from ~0% to 205% in experimental data in [2]. See “Elapsed time overhead” in 4.3
Trace data format: Human readable. Accounts for time skew and drift: Not supported. Elapsed time overhead: Because of the design goals of //TRACE, the user can control the tradeoff between trace replay fidelity and elapsed time overhead. The overhead is thus highly variable as reported by the developers of //TRACE, ranging between ~0% to 205% in their experiments [2]. We summarize our taxonomy feature classification of //TRACE in Table 2.
5. CONCLUSION We have formulated an I/O Tracing Framework taxonomy and demonstrated its utility by applying it to three popular frameworks. We can see that for a tracing user who requires advanced features such as anonymization or powerful trace analysis tools, LANL-Trace is inadequate. By measuring the timing and bandwidth overhead of LANLTrace, we have shown that it adds a reasonable small overhead to parallel I/O applications for large block sizes and considerably worse overhead for small block sizes. Using our taxonomy to analyze Tracefs, we have seen that while it provides advanced features, one should anticipate considerable installation overhead, potentially including adaptation for use on a parallel file system.
For some applications, accurate replayable traces are desired. In this case, our taxonomy recommends that //TRACE should be considered. In summary, the taxonomy has value to potential users of I/O Tracing Frameworks in formalizing their tracing requirements. It is also valuable to I/O Tracing Framework developers for identifying current unfilled demands for tracing tools and categorizing the functionality and performance of any new I/O Tracing Frameworks they create.
6. FUTURE WORK For future work we are currently working on more thorough overhead measurements of Tracefs and //TRACE. Also, we are working on using our taxonomy for full classification of more I/O Tracing Frameworks [6]. While we have started with a narrow focus on I/O Tracing Frameworks, we believe our methodology can be expanded to define a more global taxonomy for describing diverse general data collection mechanisms, i.e. non-I/O Tracing Frameworks, such as path based event tracing in distributed applications [8],[10]. With such a global taxonomy, we would be able survey the entire Tracing Framework landscape and identify distinct but complementary tracing mechanisms. We intend to build a common framework for diverse trace aggregation. With such a framework, we would be able to present a single trace-data API to developers for use while building trace analysis tools or for use directly in distributed applications.
7. ACKNOWLEDGMENTS We would like to thank Peter Honeyman and Bill Bultman for their valuable feedback. We would also like to thank Gary Grider, Milo Polte, Remzi Arpaci-Dusseau, and the professors and students of the systems laboratory (RAD Lab) of UC Berkeley including Anthony Joseph, Randy Katz, Kuang Chen, Matei Zaharai and Kurtis Heimerl.
8. REFERENCES [1] A. Aranya, C. P. Wright, E. Zadok. 2004. Tracefs: A File System to Trace Them All. In Proceedings of the 3rd USENIX Conference on File and Storage Technologies. p. 129-145.
[2] M. Mesnier, M. Wachs, R. Sambasivan, J. Lopez, J. Hendricks, G. Ganger, D. O'Hallaron. 2007. //TRACE: Parallel Trace Replay with Approximate Causal Events. In Proceedings 5th USENIX Conference on File and Storage Technologies. p. 153-167. [3] Los Alamos National Laboratory open-source LANL-Trace. [4] Los Alamos National Laboratory open-source mpi_io_test synthetic application [5] Los Alamos National Laboratory public traces generated using LANL-Trace [6] P. Lu and K. Shen. 2007. Multi-Layer Event Trace Analysis for Parallel I/O Performance Tuning. In Proceedings of the 2007 int’l conference on Parallel Procesing (ICPP-07). [7] E. Zadok and J. Nieh. 2000. FiST: A Language for Stackable File Systems. In Proceedings of the Annual USENIX Technical Conference, p. 55-70. [8] Rodrigo Fonseca, George Porter, Randy H. Katz, Scott Shenker, and Ion Stoica. 2007. X-Trace: A Pervasive Network Tracing Framework. In Proceedings of 4th USENIX Symposium on Networked Systems Design & Implementation. p. 271–284. [9] H. Gunawi, N. Agrawal, A. Arpaci-Dusseau, R. ArpaciDusseau, J. Schindler. 2005. Deconstruction Commodity Storage. In Proceedings of the 32nd annual international symposium on Computer Architecture. p. 60-71 [10] N. Joukov, T. Wong, E. Zadok. Accurate and efficient replaying of file system traces. 2005. In Proceedings of conference on File and Storage Technologies. p 336-350. [11] T. Curry. Profiling and tracing dynamic library usage via interposition. 1994. In Proceedings of Summer USENIX Technical Conference. p 267-278. [12] R. Hedges, B. Loewe, T. McLarty, C. Morrone. Parallel File System Testing for the Lunatic Fringe: The Care and Feeding of Restless I/O Power Users. 2005. In Mass Storage. p 3-17.