Since the tracking is performed automatically, object trajectories are often imperfect and noisy. We use Savitzky-. Golay (SG) filter to smooth the trajectories [13].
2009 Advanced Video and Signal Based Surveillance
Towards Generic Detection of Unusual Events in Video Surveillance
Ivan Ivanov, Frederic Dufaux, Thien M. Ha, Touradj Ebrahimi Multimedia Signal Processing Group – MMSPG Institute of Electrical Engineering – IEL Ecole Polytechnique Fédérale de Lausanne – EPFL CH-1015 Lausanne, Switzerland {ivan.ivanov, frederic.dufaux, thien.haminh, touradj.ebrahimi}@epfl.ch ratio in the training sequences. This algorithm could be applied to video surveillance sequences of parkings, metro or bus stations, banks and airports lobbies, or shopping malls. The remaining sections of this paper are organized as follows. Section II surveys related work on trajectory representation and activity analysis. Section III briefly describes an overview of our proposed system with more details in Sections IV and V. Experiments and results are discussed in Section VI. Finally, Section VII concludes with a summary and some perspectives for future study.
Abstract—In this paper, we consider the challenging problem of unusual event detection in video surveillance systems. The proposed approach makes a step toward generic and automatic detection of unusual events in terms of velocity and acceleration. At first, the moving objects in the scene are detected and tracked. A better representation of moving objects trajectories is then achieved by means of appropriate pre-processing techniques. A supervised Support Vector Machine method is then used to train the system with one or more typical sequences, and the resulting model is then used for testing the proposed method with other typical sequences (different scenes and scenarios). Experimental results are shown to be promising. The presented approach is capable of determining similar unusual events as in the training sequences.
II.
Keywords-Video surveillance application; unusual event; trajectory representation; feature extraction; Support Vector Machine classifier.
I.
INTRODUCTION
Video surveillance is one of the most active fields of research in computer vision and pattern recognition. In the past, video-based surveillance systems relied primarily on human operators who observed dozens of monitors simultaneously. Due to the quantity of information, and rather lengthy surveillance footages, humans are known to be quite unreliable in detecting the so called “unusual events”, when reviewing either on-line video sequences or archived data. Examples of such unusual behavior might be a person walking in a forbidden zone, a vehicle driving on the wrong side of a road, a person running in an area where one expects people walk, etc. The main challenge is the development of an automatic and smart video-based surveillance system [1] which would not require human intervention. In this paper, we make a step toward generic detection of unusual events in terms of velocity and acceleration. The main motivation is to make a simple, low-dimensional and scenario independent system, which does not require any a priori camera calibration. The training set is composed of standard video surveillance sequences which consist of normal and unusual activities in terms of velocity and acceleration, such as running, or careless driving. The aim is then to determine whether similar unusual events can be identified in other test sequences (scenes). We consider unusual events in test sequences as events for which velocity ratio between normal and unusual events is similar to the 978-0-7695-3718-4/09 $25.00 © 2009 IEEE DOI 10.1109/AVSS.2009.63
RELATED WORK
In most prior work for unusual event detection, three specific problems can be identified. The first one aims at modeling trajectories and transforming them into an appropriate feature space. The second problem consists of defining an efficient distance measure between trajectories, after which the third problem arises in term of clustering trajectories into homogenous groups. Recently, many researchers have tried to model trajectories with reduced dimensionality. Bashir et al. [2] use Principal Component Analysis (PCA) to model a trajectory by PCA coefficients of its sub-trajectories for video indexing and retrieval systems. Antonini and Thiran in [3] transform a trajectory using Independent Component Analysis (ICA) for pedestrian counting in a video sequence. Porikli and Haga [4] use Hidden Markov Model (HMM) as a representation of trajectory in a feature space which is accurate in coordinate, orientation and speed similarity measurement between trajectories. In [5], Prati et al. modeled the shape of a single trajectory as a sequence of angles using a Mixture of Von Mises (MoVM) distribution. Different techniques for similarity or dissimilarity measurement have been widely exploited: Euclidian [2], Hausdorff distance [3], and Longest Common Subsequence (LCSS) [3]. More results about comparison of similarity measurement techniques can be found in [6]. For the problem of trajectory clustering, three approaches have been studied, namely, supervised, semi-supervised, and unsupervised clustering. In [7], Junejo et al. applied graph cuts to cluster trajectories using the Hausdorff distance measure. Calderara et al. [8] achieve clustering by using a kmedoids algorithm and a dynamic programming technique to distinguish between trajectories with different direction and velocity of movement. Fu et al. in [9] present a spectral clustering which outperforms conventional fuzzy k-means
61
Authorized licensed use limited to: EPFL LAUSANNE. Downloaded on October 8, 2009 at 15:52 from IEEE Xplore. Restrictions apply.
Video sequences
Segmentation
Tracking
Trajectories
Training Training trajectories
Pre-processing
Features extraction
Support Vector Machine classifier
Model
Testing Testing trajectories
Pre-processing
Features extraction
Support Vector Machine classifier
Cross-scaling
Abnormality results
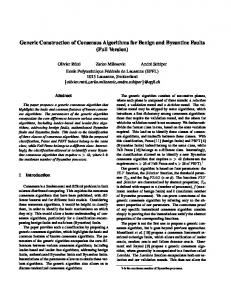
Figure 1. System architecture of the proposed unusual event detection system.
clustering in anomaly detection. Common patterns discovering and outliers detection has been studied by Anjum and Cavallaro [10] using mean-shift clustering technique. Most of these techniques consider one or more features that are processed consecutively. In this paper, we propose a simple multi-features supervised trajectory classification approach with potentially a generic usage. We then evaluate it on real trajectory data. III.
to different situations. Namely, it is possible to train the proposed system with normal and unusual trajectories from one sequence and to test it with different sequences from completely different scenes. Detection of unusual events in terms of velocity and acceleration is possible due to velocity invariance achieved with different kinds of scaling (normalization). IV.
SEGMENTATION AND TRACKING
Objects and their trajectories must be extracted reliably from video sequences. Here we assume that all sequences are captured using a single stationary camera. In this paper, we use a multilevel object-region tracking algorithm [11]. Foreground objects extraction is done by thresholding the frame difference between the current frame and the frame representing the background. Then, automatic video objects tracking algorithm based on a hybrid strategy is performed, using both objects and regions information. The algorithm identifies different regions in the current frame under analysis, and tries to associate them with the regions detected in the previous frame, using low-level features such as motion, color and texture. The main advantage of this technique is that it can deal with multiple simultaneous moving objects, and it is further capable of detecting both rigid and deformable objects. Occlusion might prevent an object from being seen and detected. To address this problem, we include position estimation by interpolating the trajectory between two known positions (see Section V.A). The trajectories will represent the output of this part of our system.
SYSTEM OVERVIEW
A complete system has been designed to evaluate the proposed approach. It performs two tasks: video segmentation for moving objects extraction and tracking, and unusual event detection. This paper is focused on the latter task. The system contains different functional modules each of which has a specific task (see Fig. 1): Segmentation and tracking. This module does the moving objects extraction using segmentation and tracking. Trajectories are represented as time series of 2-D spatial points. Trajectory pre-processing and features extraction. The first step is filling the holes in raw trajectories in case of tracking with occlusions. Another pre-processing technique, widely used in time series analysis, is smoothing. It is used to remove irregularities in the data and to provide a clearer view on the behavior of the trajectories. Trajectories are then re-sampled at equal distance intervals, and features, such as location, velocity and acceleration, are extracted. Each trajectory is thus represented by a feature vector of fixed dimension. Training. Extracted features are used to train our system with a Support Vector Machine (SVM) classifier resulting in a model represented with SVM coefficients. This model is then used for testing. Testing. The testing phase can be performed on sequences from the same scene as for the training phase, or from different scenes. The main contribution of this paper is the flexibility of the used feature representation which adapts
V.
UNUSUAL EVENTS DETECTION
In some circumstances, it is necessary to analyze the behaviors of the objects in a scene, for instance people and vehicles, and to determine whether these behaviors are normal or abnormal. The unusual event detection proposed in this paper is designed to exploit different types of information (velocity and acceleration in the examples used
62
Authorized licensed use limited to: EPFL LAUSANNE. Downloaded on October 8, 2009 at 15:52 from IEEE Xplore. Restrictions apply.
Before further calculations, all x- and y-coordinates are scaled as follows: ( xit,new = xit DimX , yit,new = yit DimY ) ,
in the paper) of objects’ trajectories from one scene and to fuse them in order to create a supervised learning model. The resulting model is later used to test trajectories from different scenes and to determine similar unusual events as in the training sequences.
where Dim X and DimY represent the resolution of the video frame in x- and y-projections, respectively. This will help us to achieve velocity and acceleration invariance when training and testing sequences are different. Furthermore, every trajectory is modeled using high-level features, such as velocity and acceleration calculated as the modulus:
A. Trajectory Pre-processing and Features Extraction Motion of the object is represented by its trajectory, as spatio-temporal localization of one of the representative points of a moving object. In our case, a trajectory is modeled as a sequence of consecutive locations of the center points of the bounding box of each object, resulting in a vector (time series) in 2-D Euclidian space:
Traji = where ( x , y t i
t i
)
{( x , y ) ⊆ ` ; t = T t i
t i
2
i init
}
i ,..., T final ∈\
t
fi =
in the image plane at time t. Initial time T
+f
t 2 i, y
(1)
§ dkx = ¨ ki © dt
2
· § d k yi t ¸ +¨ k ¹ © dt
2
· t ¸ . ¹
(2)
Here f ∈ {v, a} denotes velocity and acceleration calculated as first ( k = 1 ) and second ( k = 2 ) order derivatives, respectively, of a set of trajectory data ( xi , yi ) . ( vit, x , vit, y )
is the estimated x- and y-position of object i i init
f
t 2 i, x
and final time
and ( ait, x , ait, y ) represent velocity and acceleration with x-
i final
T represent the time of object’s appearing/disappearing from the scene. Note that lengths of trajectories vary depending on the time during which the corresponding object is successfully tracked, which also depends on the position and velocity of the object. Raw trajectories are most likely influenced by noise and may exhibit gaps due to the occurrence of occlusions. Therefore a pre-processing module is necessary. We perform pre-processing in several steps. Some objects may temporarily “disappear” in some frames because of occlusions, which results in gaps or holes in the trajectories of the objects. Lack of data can cause problems during features extraction. This is resolved by making use of a filling process. Due to its simplicity of implementation and reduced computational complexity, the most straightforward reconstruction technique is Bresenham’s line-drawing algorithm [12]. More specifically, we separate the motion trajectory into two one-dimensional signals ( xi ( t ) , yi ( t ) ) and interpolate between two known
and y-projections, respectively. The SG filters are generally used for smoothing and differentiation in many fields [13]. The derivative is defined as the derivative of the fitted polynomial at each point. For a given order of derivative (zeroth differentiation is equal to smoothing), the coefficients of the SG filters are dependent on the polynomial degree and the filter length. The last step is to re-sample the smoothed trajectory at equal spatial intervals so that the distance between any two consecutive trajectory points is the same. In our case, trajectories assigned to particular objects are represented as M = 128 equidistant points. Velocity and acceleration for each point are extracted, scaled and fed to SVM for training. Each trajectory Traji is modeled with the following feature vector:
ª¬vi1
points at the boundaries of the missing trajectory segment in both x-t and y-t planes. This algorithm basically acts as an integer linear interpolator. Since the tracking is performed automatically, object trajectories are often imperfect and noisy. We use SavitzkyGolay (SG) filter to smooth the trajectories [13]. The main advantage of this approach is that it tends to preserve features of the distribution such as relative maxima, minima and width, which are usually “flattened” by other averaging techniques (for example, moving average filter) [13]. The idea of SG filtering is to approximate a given function within a moving window by a polynomial representation of a certain order. In our experiments, the SG filter coefficients are calculated for order P = 4 of polynomial fit and F = 21 points of window length, resulting in a low computational complexity and a good approximation of trajectories. Filtering is then applied on trajectories in both x-t and y-t planes.
vi2
... viM
ai1
ai2
... aiM º¼ .
(3)
B. Support Vector Machine Classification Our unusual event detection approach is based on supervised learning techniques, and in particular, classification. We use a Support Vector Machine classifier [14] and the publicly available Libsvm software [15]. Libsvm supports multiclass classification and integrates a number of different techniques including C-SVC and nuSVC. It can also compute probabilities with which a given trajectory belongs to each of the predefined classes. SVM transforms the input patterns into a higherdimensional feature space through some nonlinear mapping chosen a priori. SVM takes as input N training patterns
{x
i
xi ∈ \ m
}
N
i=1
where xi represents the pattern attributes
(feature vectors of fixed length m = 2M , see Section V.A),
{
}
and yi yi ∈ {−1, +1}
N
i =1
the class labels of training patterns,
63
Authorized licensed use limited to: EPFL LAUSANNE. Downloaded on October 8, 2009 at 15:52 from IEEE Xplore. Restrictions apply.
(a)
(b)
(c)
(d)
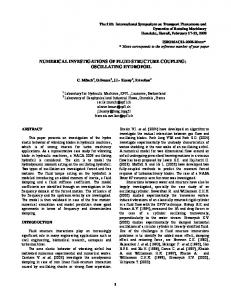
Figure 2. (a) and (b) Segmentation and tracking results of S1 and S2. (c) and (d) Trajectories of S3 before and after pre-processing.
where +1 and −1 correspond to normal and unusual events, respectively. Training samples are then mapped into a higher-dimensional space H by a function φ : \ m → \ h ,
inputs such that all attribute values lie between 0 and 1, for both velocity and acceleration, f ∈ {v, a} :
h = dim ( H ) . SVM finds a hyperplane separating the training instances in higher-dimensional space by their classes and maximizing the distance from the closest samples to the hyperplane (maximum-margin hyperplane). Assuming the optimal hyperplane is generated, the classification decision of an unknown pattern s for the two class problem is determined by the sign of the function: g ( s ) = sgn where
(¦
N i =1
α i ≥ 0, i = 1,..., N
multipliers that satisfy
¦
α i yi K ( xi , s ) + b
are N
i =1
)
non-negative
f i t,norm =
D. Testing After having test trajectories pre-processed, features extraction is performed. Additional cross-scaling is performed before testing phase, aiming at making equal maximum values of both training and testing sequences. The maximum values over all training and testing patterns are calculated. These values are then used to scale testing inputs. Velocity and acceleration values are separately scaled, f ∈ {v, a} :
(4) Lagrange
hyperplane, and K ( xi , s ) = φ ( xi ) φ ( s ) represents the kernel function. For our purpose, we used a linear kernel: T
K ( xi , x j ) = xi x j .
(6)
After scaling the patterns, the support vectors are computed using a linear kernel and they form a SVM model.
α i yi = 0 ; b is a parameter of the
T
f i t − f min . f max − f min
(5)
f
t j ,norm
=
{f } f max { f } max
i∈training j∈testing
The kernel function enables the operations to be carried out in the input space rather than in the high-dimensional feature space. The patterns closest to the hyperplane are called support vectors and are crucial for training. Cross validation is used to identify good parameters of the hyperplane, so that the classifier can accurately predict unknown data [15] and prevent the overfitting problem.
t
i
t j
t j
.
(7)
Equation (7) is applied to all testing trajectories. Following scaling, the SVM model (created in training phase) is then used for off-line classification of unseen trajectories, as normal or abnormal. This algorithm determines that a trajectory is unusual if its probability to belong to the “unusual” class is greater than the threshold τ = 0.5 .
C. Training During the training phase, a set of objects’ trajectories of various lengths (one scene, one sequence) is processed. For our purposes, we used a feature vector as shown in (3). According to Section V.B, each feature vector is manually accompanied with class labels {−1, +1} . We compute the feature vectors of our entire training dataset that can be used with SVM classifier. Scaling the data has been proven to increase the accuracy of classification results [15]. The maximum and minimum values for each attribute over all training patterns are determined. These values are then used to scale training
VI.
EXPERIMENTS AND RESULTS
In this section, experimental results of the proposed method are presented. Experiments were carried out on four standard video sequences from PETS datasets. The first two sequences (outdoor) come from PETS20011 and show the same traffic scene obtained from two different views: S1 (26 trajectories, 768×576, 25Hz) and S2 (24 trajectories, 768×576, 25Hz). Two other sequences (indoor) are from PETS20062: S3 (41
1 2
ftp://ftp.pets.rdg.ac.uk/pub/PETS2001/ ftp://ftp.pets.rdg.ac.uk/pub/PETS2006/
64
Authorized licensed use limited to: EPFL LAUSANNE. Downloaded on October 8, 2009 at 15:52 from IEEE Xplore. Restrictions apply.
(a)
(b)
(c)
(d)
Figure 3. Trajectory datasets – PETS2001 video sequences (a) S1 and (b) S2. PETS2006 video sequences (c) S3 and (d) S4.
TABLE I. Testing sequence S1 S2 S3 S4
Video duration (Number of frames) 4 min 25 sec (6642) 3 min 49 sec (5752) 1 min 50 sec (2551) 1 min 42 sec (2556)
PERFORMANCE STATISTICS OBTAINED.
Number of unusual trajectories (Number of trajectories)
Average unusual trajectory length in number of frames (Average trajectory length)
Training sequence
Unusual events detection rate
False alarms
5 (26)
135 (477)
S1 (2-fold crossvalidation)
2/2
none
2 (24)
218 (450)
S1
2/2
none
8 (41)
112 (222)
S1
8/8
2
8 (49)
80 (164)
S2
7/8
4
capable of determining unusual events in terms of velocity and acceleration, if the ratio between normal and unusual events is similar to that in the training sequences. In this paper we cover four test cases: training with S1 and testing the same sequence S1 using a cross-validation technique; training with S1 and testing the second view S2 of the same scene; training with S1 and testing S3 which corresponds to a completely different scene and scenario; and finally, training with S2 and testing S4. Table I summarizes the duration, number of trajectories for both normal and unusual events, sequences that are used for training, and detection and false alarm rates. As detection rate, we listed the actual number of detected unusual events out of the actual number of unusual events that occurred. It may be noted that in most scenes we had near perfect detection at the cost of a relatively small number of false alarms. A limitation appeared when we performed the following scenario: sequence S1 was trained with the reduced training dataset of 14 normal and only 2 unusual trajectories, and then tested using cross-validation. In this case, SVM was not able to distinguish between pedestrians and bicyclists, and the detection rate sharply decreased to a value around 70 %.
trajectories, 720×576, 25Hz) and S4 (49 trajectories, 720×576, 25Hz). At first, segmentation and tracking algorithm is run on the abovementioned sequences (see Fig. 2 (a) and (b)). Trajectories are extracted and pre-processed, as shown in Fig. 2 (c) and (d). Row 1 in Fig. 3 shows the cumulated trajectories superimposed on the background frame of each sequence, while row 2 depicts position of trajectories labeled as unusual events. In S1, there are several people walking along the road or passing through the grass area. The outliers are identified as objects that move faster than pedestrians, like bicyclists or cars. The same scenario refers to S2. For S3 and S4, passengers walk at a metro station, when suddenly some of them demonstrate “unusual” speeds (running). Running could be provoked by potential theft situations. The presented approach is able to detect and to alert when these activities occur. The main goal of our approach is to show that it is possible to train the system with one or more sequences and to use the resulting model for testing with other sequences (different scenes and scenarios). Experimental results are promising, as shown in Table I. The presented approach is
65
Authorized licensed use limited to: EPFL LAUSANNE. Downloaded on October 8, 2009 at 15:52 from IEEE Xplore. Restrictions apply.
Therefore, as a minimum requirement for all the training phases we used at least five abnormal trajectories. When objects are far away from the camera, it is not possible to accurately determinate their velocity since we do not use projection on the ground-plane. In order to recognize, detect and analyze behaviors of other objects (e.g., metro), it is necessary to investigate usage of other features, such as size, dominant color of the object, etc. The proposed system has been implemented using Matlab 7.5. Tests were run on a dual-processor PC with a CPU frequency of 2.5 GHz and 2 GB of RAM. The most time consuming part of our system is SVM parameters estimation, which in our case with a few training feature vectors (less than 50) was around 3 s.
REFERENCES [1]
W. Hu, T. Tan, L. Wang and S. Maybank, “A survey on visual surveillance of object motion and behaviors,” IEEE Trans. on Systems, Man, and Cybernetics – Part C: Applications and Reviews, 34(3):334-352, 2004. [2] F. I. Bashir, A. A. Khokhar and D. Schonfeld, “Segmented trajectory based indexing and retrieval of video data,” Proc. of IEEE Int. Conf. on Image Processing, pp. 623-626, 2003. [3] G. Antonini and J.P. Thiran, “Counting Pedestrians in Video Sequences Using Trajectory Clustering,” IEEE Trans. on Circuits and Systems for Video Technology, 16(8):1008-1020, 2006. [4] F. Porikli and T. Haga, “Event Detection by Eigenvector Decomposition using Object and Frame Features,” Proc. of IEEE Int. Conf. on Computer Vision and Pattern Recognition, pp. 114-123, 2004. [5] A. Prati, S. Calderara and R. Cucchiara, “Using Circular Statistics for Trajectory Analysis,” Proc. of IEEE Int. Conf. on Computer Vision and Pattern Recognition, pp. 1-8, 2008. [6] Z. Zhang, K. Huang and T. Tan, “Comparison of Similarity Measures for Trajectory Clustering in Outdoor Surveillance Scenes,” Proc. of IEEE Int. Conf. on Pattern Recognition, pp. 1135-1138, 2006. [7] I. N. Junejo, O. Javed and M. Shah, “Multi feature path modeling for video surveillance,” Proc. of IEEE Int. Conf. on Pattern Recognition, pp. 716-719, 2004. [8] S. Calderara, R. Cucchiara and A. Prati, “Dynamic Programming Technique for Classifying Trajectories,” Proc. of IEEE Int. Conf. on Image Analysis and Processing, pp. 137-142, 2007. [9] Z. Fu, W. Hu and T. Tan, “Similarity based vehicle trajectory clustering and anomaly detection,” Proc. of IEEE Int. Conf. on Image Processing, pp.602-605, 2005. [10] N. Anjum and A. Cavallaro, “Object Trajectory Clustering for Video Analysis,” IEEE Trans. On Circuits and Systems for Video Technology, 18(11):1555-1564, 2008. [11] A. Cavallaro, O. Steiger and T. Ebrahimi, “Tracking video objects in cluttered background,” IEEE Trans. on Circuits and Systems for Video Technology, 15(4):575-584, 2005. [12] C. Flanagan, “The Bresenham Line-Drawing Algorithm,”
VII. CONCLUSION In this paper a new approach for unusual event detection was presented. It makes a step toward generic detection of unusual events in terms of velocity and acceleration. The approach is performed on real trajectories obtained from a segmentation and tracking algorithm. We train an SVM classifier with one sequence, and the resulting model is then used for testing the proposed method with other sequences (different scenes and scenarios) in order to determine similar unusual events as in the training scene. The system has been tested over more than one hundred trajectories, collected from four different scenes that are operationally interesting in real-life video surveillance. The reported results, though preliminary, are promising. Our algorithm obtained good detection rates while keeping false alarm rates to a reasonable level. As future work, we will explore the extension of this method by using Radial Basis Function in SVM classifier, as well as, explore more types of unusual activities and other types of features, such as position, size, dominant color or texture of objects.
http://www.cs.helsinki.fi/group/goa/mallinnus/lines/ bresenh.html, Cited Feb 2009.
[13] J. Luo, K. Ying, P. He and J. Bai, “Properties of Savitzky–Golay digital differentiators,” Digital Signal Processing, 15(2):122-136, 2005. [14] C. J. C. Burges, “A tutorial on support vector machines for pattern recognition,” Data Mining and Knowledge Discovery, 2:121-167, 1998. [15] C.-C. Chang and C.-J. Lin, “LIBSVM: a library for support vector machines,” Software available at http://www.csie.ntu.edu.tw/~cjlin/libsvm, 2001.
ACKNOWLEDGMENT This work was partially supported by European Network of Excellence VISNET II (http://www.visnet-noe.org) IST Contract 1-038398, funded under the European Commission IST 6th Framework Program, and the Swiss National Foundation for Scientific Research in the framework of NCCR Interactive Multimodal Information Management (IM2, http://www.im2.ch).
66
Authorized licensed use limited to: EPFL LAUSANNE. Downloaded on October 8, 2009 at 15:52 from IEEE Xplore. Restrictions apply.