Arts and Design Studies ISSN 2224-6061 (Paper) ISSN 2225-059X (Online) Vol.12, 2013
www.iiste.org
Towards Solving Traffic Problems using Graphic Design Visuals in Multicultural Societies: A Case Study of Selected Cities in South Western Nigeria. OLADUMIYE E. BANKOLE (Ph.D) Department of Industrial Design, Federal University of Technology, P.M.B. 704 FUTA, Akure, Ondo State Nigeria. Email:
[email protected] Abstract The relationships between graphic design visuals and traffic problem have become a source of debate for generations. Graphic visuals serve as the symbolical innovative communication to the commuters and pedestrians all over the world. Nigeria is a multicultural society with different ethnic groups, with many languages and beliefs. Traffic problems are inevitable in a society like this. Information and instructions can only be passed to the populace via different local language and with the use visual signs and symbols. Mankind of the modern day exist in an era in which technological innovations and graphic visual devices are dominating the accomplishment of human endeavour and the age of communication explosion in graphic visuals have made life more useful. New innovations and methodologies are applied in graphic design in disseminating traffic communication. This paper surveys the role of graphic design visuals in disseminating information and solving traffic problems in a multicultural society like Nigeria. Due to the paucity of research on this topic, the study adopted an explanatory approach to this study which identified the relevant construct and the relationship of graphic design visuals to the road users. A series of studies were conducted in order to develop and evaluate the role of graphics in solving traffic problems in a multicultural society like Nigeria; Research conducted proved that graphics design visual is the best method in solving the traffic problems in Nigeria. Keywords: Graphic Design, Multicultural, Traffic, Demographic, Pedestrian, Ethnicity. 1. Introduction Road traffic problems are global phenomenon that bedevils the cities of the world. One of the negative impacts of this on socio-economic wellbeing of cities is the unpredictability of travel times. Traffic in a multicultural society is generally seen as chaotic and usually it is implied that driving in the streets of these cities is an art of its own. Multiculturalism relates to communities containing multiple cultures. The term is used in two broad ways, either descriptively or normatively. As a descriptive term, it is usually refers to the simple facts of cultural diversity. It is generally implied to the demographic make-up of a specific place, sometimes at the organizationally level. As a normative term, it refers to ideologies or policies that promote this diversity or its own institutionalization. In this sense, multiculturalism is a society that can be referred to as rich tapestry of human life and the desire amongst people to express their own identity.(Agunloye 1993, Chang and Herman 2008). Traffic congestion is dominant in these cities e.g. Lagos, Ibadan, Akure and Osogbo (Nigeria). Traffic congestion is caused by nonchalant attitude of the road users in these cities. The density of traffic obviously increases the possibility of apparent disorder, but ultimate disorder means the traffic would approach a point of permanent standstill (Standard, 1985 and Okoko 2001). Creating palliative measures or finding solution to these problems in a multicultural urban centre like Nigeria will face the challenge of differences in language and verbal communication of the citizens of such cities. 1.1 Graphic Design Visuals Perceptions Graphic visuals have proved since times age to be a good way of compressing large amount of informative data into visual signs and symbols, simply transferring the information in clear and fast manner. Graphic communication as the name suggest is communication through graphic design aids. It is the process of creating, producing and distributing materials, incorporating words and visuals to convey data, concepts and emotions (Munzer 2002). Graphic design visual in transportation system according to Oladumiye (2005) is a sign and symbols communication that represent a thing by means of something else that stand for whatever definition and application in philosophy, religions, literary and other spheres. He further remarked that symbolism always involves the substitution of visual sign and thus as its roots in visual communication and experience, the dimension of imagination and of artistic expression. Graphic visuals and symbols according to him do not arise from aesthetic experiences but from part of the cultural patrimony from which it is selected for the purpose of artistic communication expression. That is to say that in symbolic representation, there is immediate and direct
58
Arts and Design Studies ISSN 2224-6061 (Paper) ISSN 2225-059X (Online) Vol.12, 2013
www.iiste.org
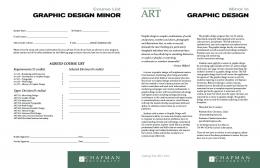
relationship between the chosen symbols or signs as its significance. The terms graphic visuals are used in this study as a means of pictograms for the pedestrians and motorist. In other words, the field of graphic design based information visualization is about creating tools that exploits the human visuals system to help people expose to its environment and create environmental awareness. (Oladumiye 2005). Effective graphic visuals in signs and symbols for transporters and road users rank very high as the basic requirement and concepts needed for the appropriate execution of our daily tasks. In other to achieve complete comprehension and perception of the concept of living and values, its function links or disintegrates all activities. The viewers of signs and road symbols or listeners actually should follows the signs and visuals chronologically then communication link up with all the activities will be possible; where information received or interpreted differs in meaning from the intended, then disintegration and dichotomy will arise. In this, sense there will be communication breakdown. An example was the Biblical Tower of Babel where communication resulted in the discontinuity of its construction ‘ditto to traffic congestion on Nigerian roads. (Thomas 2001) Graphic visuals are the process of transmitting and transforming instruction through visual symbols (Oladumiye, 2000). He further stated that road signs are also graphic visuals. According to him, they are symbols rather than words used to convey messages and information quickly. They are most popularly used today on the streets and highways. The language of road graphic signs are virtually international, in the sense that road signs and visual symbols are the same all over the universe. It had been in use for over 1000 years. (Okoko1998) They are functionally understood by more people. Goldman (1959) revealed that the arrow has been used through the ages and it means much to modern motorist, as it did to the early hinders. Many graphic visuals have been used for centuries. For instance, the circle represents eternity and it also represents the scientific symbol of the sun; when divergent lines are added to the circle, the sign for the sun is derived and it has a meaning on the road (Oladumiye 2005). Fredrick (1972), in his study of graphic visual awareness, revealed that the diagonal Saint Andrew’s Cross is also the mathematical graphics symbol for multiplication while the Greek Cross vertical and horizontal line meeting at the centre is the same for Plus sign used in Mathematics. In contemporary times, there are many graphical signs in science, where it is easier to use symbols rather than writing out whole instructions or names of chemical element. As they have meaning to the scientist, so also does symbols has meaning to the road users in a multicultural society. 1.2 Study Area This study area is Lagos in South Western Nigeria in which descriptive multicultural society, can be found, where different people from diverse culture, religion and language live together in a community. Lagos is a commercial centre where traffic congestion is prominent. Thereby a need to adopt a method of visual communication that will be easily identified and interpreted by commuters will be necessary. 1.3 Statement of Problem Judith Miller, Chief of the New York bureau in African has observed and discussed in several articles the African Traffic. She describes: “Pedestrians pouring out onto the streets to escape the sidewalks, while people with cars are looking for spaces to park. The cities few marked crosswalks are ignored by drivers and pedestrians alike. Taxis stop without warning in the middle of the road to let passengers disembark.” Adeagbo (2005), opined that traffic problems in multicultural society persists because of the absence of traffic signs and where there are, they are not adequate and effective as they are not tailored and observed, to cater for the multicultural characteristic of such society, where traffic instructions are written in English language and without illustrations, it will have no meaning or pass no information to a commuter who cannot speak, read or understand English language. These informs the need to create traffic signs with good visual communication that will be readable and easily interpreted by all road users irrespective of their beliefs, culture, religion and language. (Example of traffic jams in a street at Lagos where there is no graphics visuals are shown in figure one and two below)
59
Arts and Design Studies ISSN 2224-6061 (Paper) ISSN 2225-059X 059X (Online) Vol.12, 2013
www.iiste.org
Plate1: Traffic jam at Oshodi area of Lagos Nigeria Plate2: Traffic jam at Obalende Lagos. Nigeria Source: Author’s Collection 2013 Source: Author’s Collection 2013 1.4 Justification of the Study According to Oladumiye (2005) transportation is the back bone of any country’s economy and one of the problems of transportation is traffic jam, which results in the loss of productive man-hours. man hours. To fight this bane of the economy, an effective, readable and and easily interpreted traffic graphic visuals and signage system is important. The result of this study is to teach the pedestrian and drivers on how to observe graphic traffic visuals. 1.5 Aim and objectives of the Study The aim of this study is to create awareness in the use and observing graphic visual by the pedestrian and motorist in solving traffic problems in multicultural society. Questionnaires Questionnaires were used to seek the opinion of commuters on the use of traffic signs and symbols.
Plate 3: Parking in area that is prohibited for parking in Lagos Nigeria. Source: Author’s Collection 2013 2. Colours, Shapes and their Meaning in Graphic Design Visuals for Traffic Use Having aving being able to understanding the relevance of graphic design visuals in solving traffic problems, the study looked into the combinations of elements of design e.g. shape, lines, colours in solving traffic problems. Most of the signs and symbols to bee discussed have already been adopted as international traffic standard signs and symbols. Traffic graphic visuals and signals are essential to highway safety. Traffic visuals give information about the road, the highway system, traffic flow, and the local regulations and laws. The following section shows a sampling of graphic design visuals and signs on the highways, including a number of important regulatory, warning and guide signs, which the drivers must know the meaning so as to be able to drive safely. safe There are seven basic shapes of signs, and colours. The The shapes and colours of these visuals have specific meanings which must be recognized in multicultural society.
60
Arts and Design Studies ISSN 2224-6061 (Paper) ISSN 2225-059X (Online) Vol.12, 2013
www.iiste.org
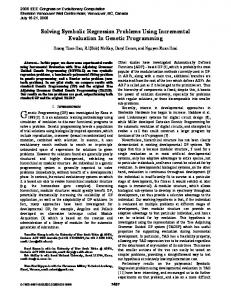
Figure: 1 Graphic Visuals in Colours and the interpretations
2.1 Analysis of the Uses of colours in traffic light signals Green “Go” Light (bottom) According to Oshaughness (2005) a green signal light (fig 2a) means proceed with caution, but it does not guarantee safe passage through the intersection. Look in both directions before entering the intersection, and then proceed with such care as to avoid hitting any vehicle or pedestrian. Always obey the rules of proper turning or right of way, such as yielding to opposing traffic when making a left turn on a green light. Always approach a green signal with alertness and be prepared to stop if the yellow caution light appears. In cities where traffic lights are arranged horizontally green is at right and red is at the left side. Yellow Caution Light A yellow caution light (fig 2b) follows the green signal. The yellow light is a warning that the signal is about to change, and that the red stop signal in fig 2b is about to be shown. Therefore, you should stop your car and wait for the next green light. Traffic situations around can become critical under these conditions. The need to observe and allow for other drivers to observe when approaching a yellow light is necessary. Red Stop Light A steady red signal light (fig 2c) means that one must stop before entering a crosswalk or intersection and remain at a standstill until the green light appears, unless a signal permits a special movement of traffic to proceed. An exception to this rule permits traffic facing a red signal to turn right except where a sign prohibits a turn on red. When turning on red you must stop before entering the crosswalk on the near side of the turn, yielding right of way to pedestrians lawfully within and adjacent to the crosswalk and to other traffic lawfully using the intersection.(Krampen 2005). Green Arrows A green arrow (fig 2d) means you may proceed carefully only in the direction in which the arrow is pointing, but must give the right of way to pedestrians and vehicles already lawfully within the intersection. Often a signal may be associated with a particular lane, and you may travel only in the direction indicated by the signal facing your lane, as in fig 2c. Figure: 2
Fig 2a Fig 2b Fig2c Fig 2d Fig 2e Fig 2f Yellow Arrows In many cases, the familiar yellow caution light is used after the green arrow to warn that the red stop light will appear. In certain cases, as in fig 2e, a yellow arrow may be used to indicate that the green arrow for a turn has ended and you must obey the signal that next appears. Red Arrows A steady red arrow signal in fig2f means that you must stop for the direction in which the arrow is pointing before entering a crosswalk or intersection and remain stopped until the green arrow appears for this movement. Flashing Red Light A flashing red light in fig 2f requires you to stop completely, and proceed when you can do so safely. Flashing Yellow Light A flashing yellow light (fig 2g) requires you to slow down to a safe and reasonable speed and to proceed with
61
Arts and Design Studies ISSN 2224-6061 (Paper) ISSN 2225-059X (Online) Vol.12, 2013
www.iiste.org
caution. Lane-Direction-Control Signals Cooley (2003) theory of transportation referred to Lane Directional Control graphics visuals as “reversible lane signals,” these devices in fig 2i can be used to relieve congestion on some heavily traffic streets during the morning and afternoon rush hours. A signal is used over each traffic lane, and each signal has a red “X” fig2h indication and green “arrow” indication. The green arrow, when illuminated, advises that you may travel in that lane. The red “X,” when illuminated, advises that those lanes are being used by traffic travelling toward you and you may not use those lanes. These devices are used to provide additional lanes in the directions of heaviest travel in order to accommodate peak traffic.
Fig 2f Fig 2g Fig 2h Fig 2i Figure: 3 Regulatory Signs Oladunmiye (2010) classified shapes as being made of lines, and that they are element of designs. To him shape has meaning to designers and road users. Some of these shapes and colours are discussed with some traffic graphics visuals, sign and symbols. Warning signs Prohibitory Signs (What you MUST NOT DO)
Mandatory Signs (What you MUST DO)
Gives Orders (Mandatory) Gives Information (Place name) Gives general information Gives route directions Regulatory sign ahead Source: Author’s Collection 2013 In a multicultural society like Akure, Lagos, Osogbo, and Ibadan others in South Western Nigeria. Traffic signs and symbols stated below can be found in streets of these cities. The following signs and symbols are easily understood by pedestrians and commuters; it passes the same information to thousands of road users. 3.1 The stop sign, most important to the safety, of the road users is the only eight sided (octagonal) sign at the side of the roads. 3.2 The three-sided yield sign means you are approaching an intersection where you must yield to any lanes you intend to enter or cross approaching from the right or left. This sign is also found at signalled railroad crossings where you must yield to approaching trains. Whenever this sign is present, it is your responsibility to slow down, look to the right or left and yields to oncoming traffic, and approaching train 3.3 Do Not Enter, This is particularly on ramps to interstates, tells you that you must not enter the road or highway because it is used only for travelling in the opposite direction. 3.4 Tells you that you are entering or travelling on a one-way roadway in the wrong direction. You should immediately stop and reverse your direction. Anytime you see a sign (such as sign 5) bearing a red circle with a slash mark across a black arrow (or other symbol), it means don’t do 3.5 The message is that you must not make a U-turn.
62
Arts and Design Studies ISSN 2224-6061 (Paper) ISSN 2225-059X (Online) Vol.12, 2013
www.iiste.org
3.6 In a five-sided pentagonal shape, it is an important sign and picture with the figure of two children approaching a school. These, indicate slow down and be prepared to stop. 3.7 With the line representing a crosswalk tells you that children may be crossing the road going to school. Be prepared to stop. 3.8 A yellow diamond-shaped picturing an adult tells you that just ahead is a location where pedestrians often cross. It cautions to drive slowly and, carefully and be prepared to stop.
Fig.3. 6
Fig.3. 7
Fig.3. 8
Having study the above Graphics Design traffic visuals there is need to seek the people’s opinion on the uses of these visuals in solving traffic problems in multicultural society like Lagos Nigeria. 2.2 Traffic Control Devices Wright and Ashford (1982) noted that traffic light, operating under ideal conditions, can move with ease and safety in any transport network by following rudimentary rules of the road and strict adherence to schedules. Volumes and densities increase, conflicting movements bring both increased probability of collision and uneconomic operation through high average delays to vehicles in the system. The introduction of traffic control devices serves two principal purposes e.g. (a) Increase of safety (b) Reduction of system delays and increase of capacity. The two control devices mode is the operating characteristics of the various signs and symbols on the road. Fredrick (1972) said that marks are the most familiar graphic communication devices for traffic control which nearly every community is enlightened. It conveys some feelings or thoughts to the community at large. In light of this for safety, these graphic forms function as knowledge. For pedestrian and motorist will normally react when they reads graphic marks indicating Children Crossing, Danger, Railway Crossing, 'Y' Junction, Double bend, Narrow Bridge, etc. Lines are also some aspects of graphic road communication devices. For instance, the centre lines and edge slanting are graphical communication devices. Centre lines are in the centre of the road to separate traffic proceeding in opposite direction. Broken lines are used in areas where there are no restrictions on overtaking. In areas where there are restrictions on overtaking, a solid line is painted alongside the broken line. Ideally, these are reflective lines for safety and clarity at night. The Ife- Benin, Akure and Abuja express road in Nigeria is an example of these. Edge lines are solid line along the side of the road; they indicate where the edge is and can be used also for traffic guidance. This is a means of communication to the road users. It is all embedded in graphics. They are of four major types: Centre Lines, Cross Walks, Pavement Messages and Diagonal Lines Cross walk lines are solid lines across the road used to denote pedestrian’s crosswalks commonly at intersections. Such lines could be found at the express roads in Nigeria. Pavement Messages: They are lines and symbol messages, which are painted on the roads to warn of conditions ahead. Diagonal Lines: Are painted graphics dimensioning symbols on the road for protection to separate traffic or to prevent traffic from entering into danger. Zebra Lines: These are signs and symbols used where pedestrians can cross the roads. Pedestrians stepped on the lines must be stopped for by motorist. 3. RESEARCH METHODOLGY This Section deals with the methodology used in the study it describes the various processes procedures,
63
Arts and Design Studies ISSN 2224-6061 (Paper) ISSN 2225-059X 059X (Online) Vol.12, 2013
www.iiste.org
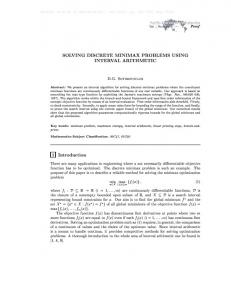
methods by which data are specified, defined, collected and analysed. 3.1 Method of Data Collection Structured questionnaire was used to obtaining data from the target groups of people made up of drivers, motor cyclist and pedestrians ians in Lagos, Nigeria. The questionnaire answered the follow questions on the. 1. Awareness of the use of traffic graphic design visuals. 2. The level of obedience to traffic graphical laws signs and symbols 3.2 Target Population The target audiences for the study are the pedestrian, motor cyclist and drivers who have been driven for at least two years. They are above 25 years of age, their educational background is not an important variable, and their licenses were professional license se and private ones. This study aims to acquire knowledge on the target group, and the citizens circulating the streets of Lagos, Nigeria proving their understanding on the availability and the uses of graphics visuals signs and symbols placed in their environment. env What was observed in the target group was that they were aware of traffic rules and visuals around them but they aren’t able to apply them and therefore, this brings us to discussing the research questionnaire in order to capture information from the target audience and analyze the needed data on the topic Towards Solving Traffic Problems Using Graphic Design Visuals. . 3.4 METHOD OF DATA ANALYSIS Figure: 4
Ethnicity distribution in the Study Area
Igbo Yoruba Hausa Others
Source: Field work Survey 2013 Above is the pie chat that indicates the various tribes of commuter and pedestrians that responded to the questionnaire. Igbo 57, Hausa 52 Yoruba 122 and others 19. 3.05 SAMPLE AND PROCEDURE A purposive sampling technique was used for data collection in the t study area.. The sampling frame is Lagos, commuters. A total of two hundred and fifty commuters and pedestrians were randomly selected as the sample size. A total of 250 questionnaires were administered to respondents selected from the sampling frame using usi a simple random-sampling sampling technique. Usable responses were obtained from all the 250 respondents. Some of the respondents that are unable to read the questionnaire, the questions were translated to them in their respective local languages. 3.06 DESCRIPTIVE VE STATISTICS Descriptive Statistics was used in the analysis of data. data Raw data sourced from the field were assembled, collated, analyzed and classified as appropriate in groups according to respondents’ answers as it relates to various objectives using frequency equency distribution table, and bar chat. These were used to analyze the background information to the study; also it was used to determine the level at which commuter and pedestrians uses and obey traffic laws in graphics visuals and symbols. 4.01 DATA PRESENTATION RESENTATION ANALYSIS AND DISCUSSION 4.02 CHARTS OF THE FREQUENCY DISTRIBUTION OF THE RESPONDENTS The bar chart below shows the response of 250 respondents from different tribes in Lagos State in South Western Nigeria where the questionnaires were administered administe
64
Arts and Design Studies ISSN 2224-6061 (Paper) ISSN 2225-059X 059X (Online) Vol.12, 2013
www.iiste.org
QUESTION 1: Are you aware of traffic laws that are printed in signs and symbols? Chart 1. Awareness of Traffics laws. 150
115
100 56
45
50 7
7
1
19 0
0 Yoruba
Igbo
Hausa
YES
Others
NO
Source: Field work Survey 2013 From the above table 94% of commuters and pedestrians confirm that they are aware of traffic laws printed in graphic sign and symbols and 6% commuters and pedestrians confirm that they are not aware of traffic laws printed in graphics sign and symbols. Meaning that, majority of our respondent are aware of the use of Graphic sign and symbols in solving ving traffic problems. QUESTION 2: Are you able to interpret and understand these signs and symbols while on the road? Chart 2. Interpretation of Traffic Graphic Visuals 150 98 100 41
50
24
27 25
16
14
5
0 Yoruba
Igbo
Hausa YES
Others
NO
Source: Field work Survey 2013 From chart two72% of commuters and pedestrians confirmed that they can interpret and understand graphic visuals and traffic laws printed in graphic sign and symbols and 28% commuters and pedestrians confirmed that they cannot interpret and understand traffic laws printed in graphics sign and symbols. Meaning Meaning that, majority of the respondent can interpret and understand Graphic sign and symbols used in solving traffic problems. QUESTION 3: Do you obey these traffic signs and symbols? Chart 3. Obedience of traffics laws. 100 80 60 YES 40
NO
20 0 Yoruba
Igbo
Hausa
Others
Source: Field work Survey 2013 Chart three was on the obedience of graphic traffics laws. 75.2% of commuters and pedestrians confirmed that they did not obey traffic laws printed in graphic sign and symbols and 24.8% commuters and pedestrians confirmed that they obey traffic laws printed printed in graphics sign and symbols. Meaning that, majority of our respondent did not obey Graphic sign and symbols used in solving traffic problems. 65
Arts and Design Studies ISSN 2224-6061 (Paper) ISSN 2225-059X 059X (Online) Vol.12, 2013
www.iiste.org
QESTION4 : How can you rate the obedience of traffic laws by road users? Chart 4. Rating of Graphics Visuals Traffic Traffic Signs and Symbols 150
122
100
74 34
50
15
5
0 0%-20% 20%
21%-40% 41%-60% 61%-80% 81%-100% TOTAL
Column1
Column2
Source: Field work Survey 2013 From the above chart 78.4% of the respondent which were made up of commuters and pedestrians confirmed that obedience of traffic laws printed in graphic-visuals graphic visuals sign and symbols is less than 40% while w 21.6% commuters and pedestrians says that obedience rate of traffic laws printed in graphics sign and symbols is above 40%. Meaning that, majority of our respondent says that obedience rate of Graphic sign and symbols used in solving traffic problems is less than 40%.That is people do not know the usefulness of these visual signs and symbols. QUESTION 5: Do you see traffic laws in Visual and sign as the best way to communicate to the commuters in this society? Which one is better in disseminating information? infor Chart 5. Awareness of Graphic Visuals 120 100 80 YES
60
NO
40 20 0
Yoruba Igbo Hausa Others Source: Field work Survey 2013 From the above chart 88.4% of commuters and pedestrians confirmed that traffic laws printed in graphic visuals signs and symbols is the best way to communicate to commuters and and pedestrians in a multicultural society like Lagos 11.6% commuters and pedestrians confirmed that traffic laws printed in graphics sign and symbols is not the best way of communication to commuters and pedestrians. While the greater majority of the respondents respo support the use of graphics symbols in solving traffic problems. Also commuters and pedestrians prefers the written traffic laws in Local languages with the Visual signs and symbols and that the use of graphic visual is the best way in disseminatingg information to the road user in Multicultural society like Nigeria.
Plate 4: A round about signage at Akure, Nigeria Plate 5: Zebra crossing at first Bank bus stop at Source: Author’s Collection 2013 Abeokuta Ogun state Nigeria. Source: Author’s Collection 2013 66
Arts and Design Studies ISSN 2224-6061 (Paper) ISSN 2225-059X 059X (Online) Vol.12, 2013
www.iiste.org
Plate 6: A bus stop sign at Mokola, Ibadan, Nigeria.
Plate 7: Street directional sign at Oshogbo, Nigeria.
Source: Author’s Collection 2013
Source: Author’s Collection 2013
4.3 SUMMARY Attempts have been made in this study to show the effectiveness of the use of graphic design visuals in solving traffic problems in multicultural society like Nigeria. The result of the analysis revealed that 89% confirmed that they are aware of the graphic traffic laws placed at the corner of the road for pedestrians and also majority of the respondent especially commuters and pedestrians revealed that they can interpret and understand unders the graphic visuals and 75% of the commuter and pedestrians confirmed that they did not obey these visuals because some pretended to understand the meaning of these visuals and majority believed that graphic visuals is one of the best ways to create awareness wareness to the public and also 82% of the commuters and pedestrians prefer the traffic laws in graphic visuals as the best ways to solve traffic problems in multicultural society. Graphic design visual is a system of communication. Visual signals must constantly constantly pass on to the pedestrian and motorist, for example, if there is difficulty in interpreting the visual communication devices or if the signs and symbols is not understandable by the users there will be accidents also if the signs or visuals is not received by the pedestrian or uncertainty in the receivers mind as to the meaning of the signs or if the visuals passed ratio is low or the drivers channel capacity is over loaded, the result may be disastrous. As a result the graphic visuals should be placed pla at a point where the entire roads user will be able to see them and make use of the visuals, signs and symbols. 4.4 CONCLUSION Traffic used in this paper refers to all vehicular and all non-vehicular non vehicular movement. In a rapidly growing urban area, free flow of traffic is ideally essential for the growth of multicultural society economy. The use of graphic visuals should be intensified. For the use of mere words may be inadequate for solving traffic problems. From the analysis of the study, the problem of the use of the graphic visuals signs and symbol to the pedestrian transporters motorists, cyclists are based on literary awareness of the people Graphics play an essential part in the social life of the individual road users either as transporters or pedestrians. pedestrians. As a result most of the visuals, symbols and signs are in billboards posters leaflets erected at the side of the road, stand to correct and enlightening individuals about the norms and rules of the road. Having studied the use of the elements of design design in forming visual communication signs in order to teach, inform and educate commuters on traffic rules. Large text can be represented in a small pictograph and it will pass information to viewers than the original text. The best traffic rule that will ll communicate better to commuter in a multicultural society is the one that employs visual communication signs and symbols. Thousands of commuters will see it and read the same meaning to it, irrespective of tribe, language, culture and religion. The pictogram pict is easy to understand. The respondent through questionnaire agreed that the use of graphics design visuals, signs and symbols is the best in solving traffic problems in Nigeria. The obedience level to these signs is very low in a multicultural societyy like Lagos this raises the question on what can be done to compel commuters and pedestrians in obeying these signs. In answering these questions the follow recommendations were made. 4.5 RECOMMENDATION In order to achieve an effective goal in the use of graphic design visual in solving traffic problems in multicultural society, literacy campaign for road users such as transporters, cyclist, pedestrian in Nigeria has to be embarked upon. Concerted efforts should be made to restructure the strategies used in issuing the drivers licenses and drivers should be made to know the graphical highway codes, visual signs and symbols. Workshops and seminars should be conducted on the use of graphic visuals placed at strategic points in the city. Federal, State and Local cal government should set up an agency to over-see over see the use and obedience to this traffic
67
Arts and Design Studies ISSN 2224-6061 (Paper) ISSN 2225-059X (Online) Vol.12, 2013
www.iiste.org
laws in graphics sign and symbols, and in-case of an existing agency like federal road safety corps, this agency should be strict on the offenders. And some of the visual signs that the instructions were written in English Language should be illustrated in graphics visual, signs and symbols. 4.6 ACKNOLEWLEDGEMENT My appreciation goes to my field assistants, Azah. S, Ezeani. P, Lebile, F and Ogunshina S, for helping me to carry out this research work. Especially in distributing and collating the questionnaires. REFRENCES Adeagbo, D. (2004) Accessiblity, Traffic and Parking Problems in Urban Markets. International Journal of Transportation Studies (1) (2). 29 – 39. Agunloye, O. (1993) Road Danger in Nigeria: truths and Consequences. In Ikya, S.A. Urban Passenger Transportation in Nigeria. Ibadan: Heinemann educational Books 367- 378 Chang, M, and Herman, R. (2008). An attempt to characterize traffic in metropolitan Areas. Mc Grew Hill publishing Co, NewYork. Transportation Science. (12), (1). 55-79 Cooley, H. (2003) The Theory of Transportation. Chathan Press House, American Economic Association (9) (3). 13 - 30. Fredrick, P. (1972) Visual awareness. London 4, Fifghardinge B.T. Bastord Pub LTD. 80-84. Goldman, E.F. (1959) The World’s History. New York Harcout Brace and World publishing. 29 -34. Krampen, M. (2005) Signs and Symbols in Graphic Communication Design Quaterly. Oxford University press. (62). 1 – 33 Munzer, T. (2002) Information Visualization. Compaq System Research Centre. West Mill presss, Endinburg 87-90. Okoko, E. (1998) Road Accident Trend in Ondo State, Nigeria: A Time –Series analysis Review of Growth and Change, 2, (2). 20-27 Okoko, E. (2003) stemming the tide of Carnage on the Roads: The use of Seat Belts by Motorist in Akure, Nigeria International Journal of transportation studies (1) (2). 8- 13. Oladumiye E.B (2000) Graphics in Technological Development. Journal of Design History (1) (1). 290 – 296. Oladumiye E.B (2005) The Role of graphic communication sign and symbols in transportation system in Nigeria. International Journal of transportation studies (2, 12). 64-70. Oladumiye, E.B.(2010) Graphic Design. A Development Tool for eliciting Ethical Values and Human Rights. International Journal of Research and Capacity Building. (6)(7). 56-60. Oshaughness, S. (2005). Graphic Communication retrieved from http://www.wikipedia/topic/graphicscommunication.com. August, 2012. Standard, W. (1985) Auto Traffic in Africa as a Verdant Grammar. Social psychology Quaterly Wynetham and sons Mill house, London Thomas, N. (2001) The Holy Bible Authorized King James Version Red Letter edition 11, 7-9 Wright,P.H.and Ashford, N. J.(182).Transportation Engineering Planning and Design,3rd Editions. Canada: Library of Congress Cataloguing Publishing.
68
Arts and Design Studies ISSN 2224-6061 (Paper) ISSN 2225-059X (Online) Vol.12, 2013
www.iiste.org
APPENDIX SOUTH-WESTERN STATE NIGERIA.
69
This academic article was published by The International Institute for Science, Technology and Education (IISTE). The IISTE is a pioneer in the Open Access Publishing service based in the U.S. and Europe. The aim of the institute is Accelerating Global Knowledge Sharing. More information about the publisher can be found in the IISTE’s homepage: http://www.iiste.org CALL FOR JOURNAL PAPERS The IISTE is currently hosting more than 30 peer-reviewed academic journals and collaborating with academic institutions around the world. There’s no deadline for submission. Prospective authors of IISTE journals can find the submission instruction on the following page: http://www.iiste.org/journals/ The IISTE editorial team promises to the review and publish all the qualified submissions in a fast manner. All the journals articles are available online to the readers all over the world without financial, legal, or technical barriers other than those inseparable from gaining access to the internet itself. Printed version of the journals is also available upon request of readers and authors. MORE RESOURCES Book publication information: http://www.iiste.org/book/ Recent conferences: http://www.iiste.org/conference/ IISTE Knowledge Sharing Partners EBSCO, Index Copernicus, Ulrich's Periodicals Directory, JournalTOCS, PKP Open Archives Harvester, Bielefeld Academic Search Engine, Elektronische Zeitschriftenbibliothek EZB, Open J-Gate, OCLC WorldCat, Universe Digtial Library , NewJour, Google Scholar