Towards the Unified Recovery Architecture for Reverse Engineering Thomas Panas
Welf L¨owe
Uwe Aßmann
Software Technology Group V¨axj¨o University, V¨axj¨o, Sweden
[email protected]
Software Technology Group V¨axj¨o University, V¨axj¨o, Sweden
[email protected]
Department of Computer Science Link¨oping University, Link¨oping, Sweden
[email protected]
ABSTRACT Program understanding, which is the acquisition of knowledge about a software system, is vital for all software engineering disciplines. One important aim of software engineering is hence the refinement of the program comprehension process to improve system maintenance effectively. Therefore, within this paper, our aim is to define a unified process for reverse engineering, including program analysis, the filtering and compression of program information and program visualization. The advantage of our unified recovery process lies in the decoupling of analysis and visualization, supporting specific tools and processes for each. KEY WORDS Program Understanding, Reverse Engineering, Program Visualization, Program Analysis, Information Focusing. I. I NTRODUCTION Our entire life is based on learning new artifacts every day. It is essential to comprehend these artifacts in order to conclude with intelligent responses. Exactly in the same way, software designers, developers and maintainers need to understand computer programs, in order to evolve or maintain their systems. Program understanding, which is the acquisition of knowledge about a software system, is therefore vital for all software engineering disciplines. Unfortunately, the process of reverse engineering and hence program understanding is ill defined and poorly understood. Realizing that software systems, likewise humans, age, it becomes obvious that they have to be maintained and reengineered to meet new requirements and adapted to integrate new features. Coherently, these complex software systems must be understood before being evolved. To understand complex software, engineers are vitally dependent on trustworthy information. However, the only trustworthy information for automatic inspection of a certain system is its source code. This, because program documentations are imprecise and incomplete, binary representations unreadable and complex, and architecture as well as design plans too abstract. Therefore, software engineers are forced to spend a great deal of software evolution and maintenance on the comprehension and abstraction of legacy code, to build intelligible high level program representations for complexity reduction.
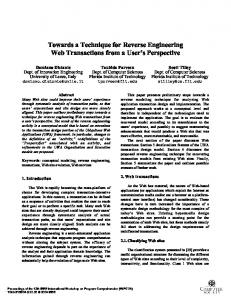
In the following we describe our definition of a reverse engineering process. Section III defines the visualization process with its models, metaphors, views and the final picture. The reverse engineering process is generalized in Section IV to the Unified Recovery Process. Related work is discussed in Section V. Finally the paper is concluded in Section VI. II. T HE R EVERSE E NGINEERING P ROCESS The combination of program analyses and software visualization techniques is crucial to succeed in comprehending legacy systems’ architectures: plain program analysis results are hard to capture by the software engineers. Moreover, the analyses have to be controlled by the software engineers interactively, making it necessary to assess intermediate results. Such an assessment is preferably based on software visualizations. However, plain visualization of the system’s structure or behavior cannot provide the right information to gain a system’s architecture. Software engineers would drown in the flood of information. Therefore the amount of information represented needs to be limited, in order to reduce the complexity of the original system and hence achieve an increased architectural understanding. According to the findings above, we define the reverse engineering process consisting of three parts: the analysis, the focusing and the visualization of a system. •
•
•
Program Analysis denotes the initial step towards program understanding. Numerous analysis techniques exist that retrieve program information reliably from source code and establish appropriate models for further investigation and modification. Information Focusing describes the process of handling large amounts of information properly. To prevent that the program analysis results in a incomprehensible flood of information, information is focused, i.e. filtered, folded, fused, etc. Program Visualization is responsible for the depiction of retrieved and focused program information that is kept in different program models. Program comprehension is additionally improved through interactive visualization.
We refer to this process, which is depicted in Figure 1, as the Reverse Engineering Process. In the following we describe each part of the process separately. We begin the description
Top Layer
Low Level Analysis
High Level Analysis
Source Level Representation
Class Level Representation
Information Focusing
Architecture Level Representation
Refined Component Layer
Basic Component Layer
}
Interactive Source Level Visualization
Interactive Class Level Visualization
Fig. 1.
Interactive Architecture Level Visualization
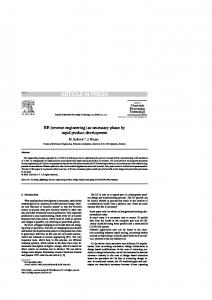
A. Program Information We define program information, as information about a program, that is vital for its comprehensibility. However, as shown in Figure 1, we retrieve throughout our reverse engineering process many different program representations on various representation levels. We therefore need to specify what kind of information is most vital for program understanding. To reach maximal program comprehensibility, our aim is to establish interactive views on a programs architecture and therefore we are mostly interested in program models holding information about a programs architecture. However, in order to retrieve an architecture level representation, as depicted in Figure 1, we need to conduct several program analyses first. These analyses result in various other immediate program representations and aid program understanding additionally for various users. Our ultimate goal is hence the retrieval of architecture level program information, in order to provide an nearly complete architecture representation of a system. The depiction of such an architectural model is presented in Figure 2. This model keeps information about various architectural program levels. The lowest level contains information about the programs implementation. The second level, holds information about components and connectors. The hierarchy continues until the system can be depicted as one component. The ascendency from a lower to a higher level occurs through pattern recognitions, e.g. component or design pattern detection.
}
public class Example { public void Example() { println("This is a test"); } public void main() { println("How are you?"); println("I am fine"); int x = 5;
}
}
public class Example { public void Example() { println("This is a test"); } public void main() { println("How are you?"); println("I am fine"); int x = 5;
The Reverse Engineering Process
with a specification of the data, i.e. the program information, which is processed within the unified recovery process.
public class Example { public void Example() { } public void main() { println("How are you?"); println("I am fine"); int x = 5;
}
Fig. 2.
}
public class Example { public void Example() { } public void main() { println("How are you?"); println("I am fine"); int x = 5;
}
Implementation Layer
public class Example { public void Example() { } public void main() { println("How are you?"); println("I am fine"); int x = 5;
The Reverse Engineered Architecture
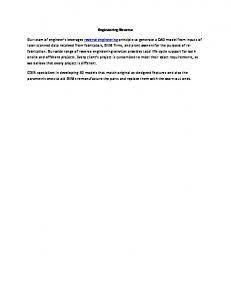
is a non-trivial task involving various analyses techniques and representations as shown in Figure 1. 1) Low Level Analysis: We denote the classic analysis techniques known from the field of compiler construction as low level. Their origin is the translation and optimization of programs. However, they can support the understanding of systems on higher levels of abstraction than the source code. We distinguish analyses for checking the well-definedness of programs from behavioral analyses of program runs. The former is done by compile front-ends, the latter by data flow analyses. Examples of low level representations are, as can be seen in Figure 3, attributed abstract syntax trees (AAST), control flow graphs (CFG), single static assignment (SSA) representations, call graphs, class graphs, et cetera. However, low level analyses usually result in much too complex representations in order to provide the developer with any architectural insight. To achieve an architectural understanding, we must therefore reduce the complexity of the low level representation by means of high level analyses. We denote analyses as high-level, if designed to retrieve a view on the systems that is more abstract than the source code.
AAST Lexical Analysis
Syntax Analysis
Semantical Analysis
CFG
SSA Tokens
AST
Source Code
B. Program Analysis The major task in software architecture comprehension is the identification of components and the essential communications between them. Given the source of a legacy system, program analyses ought to be able to identify components and communications. However, the achievement of this goal
public class Example { public void Example() { println("This is a test"); } public void main() { println("How are you?"); println("I am fine"); int x = 5;
public class Example { public void Example() { println("This is a test"); } public void main() { println("How are you?"); println("I am fine"); int x = 5;
Call Graph Run-time DATA
Statistical DATA
Metrics
Debugging
Class Graph Package Graph Inheritance Graph
Fig. 3.
Low Level Analysis Process
DataflowAnalysis (Pointer,Slicing)
Call Graph
Inheritance Graph
Component Detection
Concept Lattice
Package Graph
Dominance Tree
Class Graph
Fusion
Components & Connectors
AAST
Fusion
Design Pattern Detection CFG
SSA
Run-time DATA
Architecture
Design Patterns
AAST
Aspect Detection
Pattern Matching
Statistical DATA
Architecture Styles
Architectural Style Detection
Fig. 4.
High Level Analysis Process
2) High Level Analysis: High level analysis uses the result of the low level analysis to derive abstractions involving classes (or objects) interconnected by various dependencies (e.g. inheritance, method calls, and aggregation). On this abstraction level, that we simply call the class level, the high level analysis uses different techniques to identify well-known design patterns, aspects from aspect oriented programming [1], individual components, connectors or architectural styles. Each one of these techniques provides, as depicted in Figure 4, a high level representation of the system at hand, e.g. dominance trees, concept lattices, lists of possible component or pattern candidates, architectural styles, et cetera. The most significant difference between low and high level representations is that low level representations usually contain the same amount of information as the source representation, and that the low level analysis therefore often is reversible. C. Information Focusing Program representations resulting from program analysis contain for middle size programs enormous quantities of information. Consequently, to be able to adequately represent and comprehend the most relevant program information, the information assembled needs to be focused. There are basically three techniques to focus information: • Information Abstraction • Information Compression • Information Fusion 1) Information Abstraction: Information abstraction on program representations denotes the subtraction of program information from the representations. This is a favorable technique when information consistent in a program model is not required for further depiction or interactive modification. Information abstraction is implemented in two well-known abstraction techniques: information filtering and information slicing. Information filtering allows to disregard parts of a software system. Since filtering subtracts information from the systems’
model, information is lost. If filtered information turns out necessary later, program analysis must be performed once more to retrieve a new program representations of the program. Alternatively different program representations can be used simultaneously to keep dissimilar filtered versions of a program in memory. Examples of program information filters are graph filters, that e.g. subtract irrelevant packages or modules from a graph model, or composition filters [2], known from AOP. Composition filters extends object oriented programming by encoding crosscutting concerns as manipulators of messages that are received or sent by objects. When cutting a slice from a program, only those parts of a program representation are encapsulated, that are relevant for a particular purpose. The aim is to reduce and simplify the original program representation through the subtraction of irrelevant information. Therefore, slices contain only program information relevant for one purpose. Under certain circumstances slices can also lead to reduced, yet executable program slices. An example are hyperslices, known from aspect oriented programming, supported throughout Hyper/J [3]. Hyper/J allows a developer to cut through a program to compose a collection of separate models, called hyperslices, each encapsulating a concern of a program. The models typically overlap, and might or might not cut across one another. Each model can be understood in isolation. 2) Information Compression: Another option to focus information is to compress it. The advantage of compression over abstraction is, that information is not lost. While information is subtracted when being abstracted, it is solely hidden when being compressed. In this paper, we distinguish two types of information compression: information folding and information aggregation. While folding denotes the term for source code compression, the compression on all other program representations is called aggregation. Folding, the process of collapsing and accordingly expanding program information within a certain context, is a commonly used technique to reduce complexity on source level. Futile program information is folded, so that the developer can concentrate on the essential parts of a program. Many editors, such as jEdit and Emacs, support the folding of source code. Folding has recently even been applied to the world of aspect oriented programming, where diverse crosscutting aspects of a program and its core are systematically reunified and represented in their context. This technique is known as Aspect Folding [4]. Information aggregation is another technique to compress information. However, the compression is based on program representations different from source code, such as graphs. Aggregated program representations are, as well as folded representations, always available and do not need to be recomputed through additional program analyses. Aggregation follows the subclass, containment and instance-of relations. A superclass may represent subclasses, a class its class members or objects. Aggregation allows to define arbitrary levels of abstraction over the actual relations. The users may choose more abstract or more concrete views on their software
system. VizzAnalyzer [5] and Goose [6] are example tools that implement information aggregation. Aggregations within the VizzAnalyzer, are described through subclass, containment and instance-of relationships, meaning that e.g. a superclass may represent subclasses and a class its class members or objects. 3) Information Fusion: Information fusion for general information has been nicely defined by Dasarathy [7]: When you use information from one source, it’s plagiarism; When you use information from many, it’s information fusion. However, the notion of information fusion for program focusing is slightly different. Information fusion within program focusing, denotes the melting of diverse program representations. We have seen an example of information fusion already in Fig 4, where the high level analysis process was presented. Various program representations resulting from component and connector detection needed to be fused with each other. The reason is that component detection techniques, as e.g. the concept lattice or dominance tree analysis, produce several diverse component matches. These varying matches must be unified in order to designate consistent program components. We refer to the unification as program fusion. Further, we also fused the various component representations together with a basic program representation, e.g. an AAST, in order to retrieve an entire representation of a programs architecture. The essence of information fusion lies in both, the unification of two or more program representations, or even in the detection of novel program information. Information needs to be unified because of different reasons. Program models may hold too few and additionally similar information and are fused for efficiency, or they are melted because they depict the same information but through different analyses. However, as a side effect, information fusion may also reveal novel program information, e.g. when different component representations are unified and the unification reveals components unseen in the non-unified representations. Therefore the fusion of information and hence the concentration of vital program information is essential for the architectures’ understandability. D. Program Visualization Visualization is the presentation of pictures, where each picture presents an amount of easy distinguishable articfacts that are connected through some well defined relations. Visualization itself has a number of specialized foci that include [8]: Information Visualization, Scientific Visualization, Geographic Visualization, Business Visualization, Statistical Visualization, Process Visualization and Software Visualization. All sorts of visualization have a common objective, to transform information into a meaningful visual representation to aid humans with information comprehension and understanding. Throughout this paper the visualization focus narrows to software visualization. However, software visualization in general, including algorithm and program visualization, is still a too wide ranging term. Software visualization, as classified by John Stasko [8] is depicted in Figure 5 a). Out of our scope is
Software Visualization
Software Visualization Algorithm Visualization
Program Visualization
Static Algorithm Visualization
Static Code Visualization Static Data Visualization Data Animation
Algorithm Animation
Code Animation
Program Visualization
Visual Programming
Static Code Visualization
Code Animation Programming by Demonstration
(b)
(a) Fig. 5. Taxonomy for Software Visualization. (a) Stasko’s Taxonomy (b) Our Taxonomy
the depiction of algorithms and hence data visualization and animation, which is placed better in the field of information visualization [9]. Within our scientific investigation for reverse engineering we are therefore merely interested in the area of program visualization, dealing with static and dynamic code visualization, as depicted in Figure 5 b). 1) Source-Level Visualization: On source code level, current program editors, aspect editors and source code browsers provide diverse views on a program. On that level, source code is viewed and edited, preferably in its editing context [10]. Advanced tools provide often the integration of program editors with online debuggers and profilers supporting the retrieval of behavioral information and hence low-level analysis. Binary program representations reside on the same level as source code representations. This mainly, because both contribute to low level analyses. Binary representations are the basis for program executions and therefore run-time analysis. Examples of run-time analysis are profile or event traces from an program execution visualized, e.g. in debugging or profiling tools, or call graph drawings based on a single program execution. 2) Class-Level Visualization: On class level, many approaches and tools support the visualization of program structures. The information to be visualized is established during low level analysis and stored within diverse class level program representations. Through class level visualizations, different views on these models are established, such as call, class, inheritance and package graph views. A typical means to illustrate programs on class level are UML diagrams combining graphical views of static and dynamic aspects of software. Of particular interest are UML class diagrams whose purpose is to display class hierarchies (generalizations), associations, aggregations, and compositions in one picture. Example tools are Rational Rose [11] and Together [12], which additionally supports round-trip engineering for Java and C++. Besides static class diagrams there are a couple of different other diagram types, such as the dynamic sequence and activity diagrams which developers have found useful for communication. Although many approaches succeed in depicting static class level information, the most fail to
merge in behavioral information. The VizzAnalyzer [5], our own tool, combines structural and behavioral information of Java software systems on source and class level. It uses a compiler front-end for the static analyses, accesses the Java debugger interface for dynamic analyses and visualizes the combined information within various graphical views. 3) Architecture-Level Visualization: On architectural level, program information is depicted among other things through dominance tree drawings, UML diagrams, graph browsers, and component/connector graph drawings. However, unlike class level visualizations, where the graph is the usual metaphor used, a wider assortment of metaphors gets appropriate in order to sustain natural program understanding. Therefore, additional views for architecture level program depiction, such as program designs and architectures, through various metaphors, dimensions and output devices become appropriate. Researchers in the field of reverse engineering are aware of the situation that the high level analyses can only provide optional structures that are likely to represent the actual architecture. These options are to be assessed by a system engineer. Currently, there is little support for the comparative assessment of the single options. Program visualizations could bridge this gap. Dominance trees and the concept lattices, e.g., used in component recognition, define partitions of the systems classes implying their possible grouping into components. To compare the results of the analyses, one should consider a simultaneous view of the partitions induced by analyses. Moreover, system engineers understand the legacy system architecture and behavior only in terms of notions that are common also in forward engineering, e.g. in terms of components, connectors, classes, objects etc. Auxiliary data structures like dominance trees and the concept lattices, even if drawn nicely, do not directly trigger an understanding of the system. They have to be presented together with their induced system structures. System engineers should be able, e.g., to move the cut of the dominance tree, the concept lattice, upand downwards in the hierarchies and see simultaneously the implications in terms of a system partitioning into different components. A variety of approaches and tools have been developed to assist developers in visualizing software architectures [13]. III. T HE V ISUALIZATION P ROCESS Program visualization implies the depiction of program information, stored in diverse program representations. For program visualization, these program representations, which are established during low and high-level analysis, are mapped to a metaphor. With the help of the metaphor, different views on the program representations are provided. These views are finally illustrated as one picture and can be interactively modified. The entire process is depicted in Figure 6. In the following we describe the concepts of models, metaphors, views and pictures more in detail. A. Models Program information, when retrieved through analysis, is stored in diverse program models. Visualizations try to mediate
Program Representations
Metaphors
Mapping
Fig. 6.
Views
Mapping
Picture
Mapping
The Visualization Process
the insights and cohesions present in the models to the viewer. However, visualizations can arbitrate merley insights and coherences of articfacts that are already present in the models. Therefore full program models are inevitable for complete program illustrations. Moreover, program information can be of different nature and hence needs to be stored in different models. We distinguish between: • • •
the source code representation, class level representations and architecture level representations.
While the source code representation describes merely the source code under investigation, class level representations result from low level analyses and hence depict Abstract Syntax Trees, Control Flow Graphs, Single Static Assignments, etc. Architecture level representations denote program representations retrieved from high level analyses. These representations symbolize concept lattices, dominance trees, component and design pattern candidates, the architectural style, as well as the final architecture. B. Metaphors A metaphor describes the analogy of two concepts, where the one may be at a higher level of abstraction than the other. The lower level abstraction depicts the model that carries the information to be visualized. The higher level of abstraction specifies the image within the model to be depicted. The mapping from the model to the image is defined through a metaphor, specifying the type of visualization, e.g. a graph or 3D virtual reality world. Metaphors, when depicting real worlds and establishing social interaction, especially in virtual reality [14], [15], become very important. Essential is therefore the choice of metaphor to improve the usability of a system. One fundamental problem with many graphic designs is that they have no intuitive interpretation, and the user must be trained in order to understand them. Metaphors found in nature or in the real world avoid this by providing a graphic design that the user already understands.
Visualization
Metaphors
Data
Focusing
Aux Model
Architecture Level Visualization
Aux Model
Architecture Level Representations Aux Model
Information Focusing
High Level Analysis
Class Level Visualization
Class Level Representations Information Focusing
Program Execution
Binary Representation
Fig. 7.
Low Level Analysis
V i e w s
Analysis
Picture
Source Level Visualization
Source Representation
Fig. 8.
The Unified Recovery Architecture
The Unified Recovery Process
One of the most elaborated metaphors, however not one of the most natural to humans, is the graph. There are many reasons why graph drawing has succeeded in its domain [8]: • Graphs are suitable models for software. Large programs are complex, consisting of thousands of objects. Graphs are well-understood models to abstract relationships between objects. • Effective layout algorithms have been invented. Important algorithms were invented for important families of graph layouts: hierarchies, orthogonal drawings and forcedbased(spring) models. C. Views It is infeasible to depict all kinds of program model phenomena in just one picture when the model carries too much information. Therefore each program model is depicted through various views, visualizing diverse aspects of the model in different contexts. Thereby it is guaranteed that the right subsets of objects and their relations in the model are depicted and understood through a variety of views. Views depict static as well as dynamic information. While static views simply map information from the models to the views, dynamic program visualizations add either additional information to the views, such as path execution frequencies, or depict program runs entirely dynamic. Dynamic program information is usually depicted in one monolithic view, which concentrates all the information about a program run into a single dynamic image. However, a monolithic view of multiple aspects of even a simple dynamic program, must encode so much information that the user quickly runs into difficulty picking out the details of interest on the screen. Therefore, it is generally more effective to use several different views to illustrate a program run. D. Picture A picture, depicting visual information on various devices, such as e.g. the computer monitor or a virtual environment, is assembled through one or more views. Many different views are map-able from the program representations, but not all are
desirable for visualization. Within the picture, a selection of desirable views can be chosen. Virtual Reality is an enabling technology for depicting modern developments within three dimensional pictures. It allows sophisticated and powerful representations to be used to create a wide-ranging number of visualization styles and techniques [16]. These techniques all have the benefit of using three-dimensions, and when used effectively, can provide much more information and interaction at any point than the more traditional two-dimensional forms of visualization. IV. T HE U NIFIED R ECOVERY P ROCESS The reverse engineering process described above can be generalized to what we call the Unified Recovery Process, depicted in Figure 7. The figure shows that any program visualization process starts with program analysis. Primarily class level information about a program is collected and kept in a program model. The analysis continues with the establishment of architecture level program information based on the prior investigations. Additionally, the system is executed to gain further information on both, class and architecture level. Finally, all kind of information, may it be on source, class or architecture level, can either be depicted immediately through diverse metaphors and views, or is focused to new program representations. The information finally depicted, can further be interactively altered. This implies an information change on all levels of program representation and further an updated depiction of the new content. By explicitly integrating program analysis into our process, we accomplish the ability to define an unified recovery architecture, depicted in Figure 8, which has its strength in all three parts of reverse engineering and hence program comprehension. The figure describes an initial idea of a visualization architecture. The main packages denote analysis, focusing and visualization. All packages perform operations on the diverse program representations. V. R ELATED W ORK As stated in [17], it is important to focus efforts on a better definition of the reverse engineering process. Reverse
engineering has typically been performed in an ad hoc manner. Since such a process has yet, to our knowledge, not been established, we provide finally a conceptual unified recovery process for reverse engineering. [18] provide a framework to classify existing tools and techniques for reverse engineering. The framework described here, which is elaborated further in [19], comes close to our unified recovery process. However, there are a few essential differences. First of all, [19] does not describe a reverse engineering process but rather a framework for reverse engineering environments used to aid program understanding. The main difference is that analysis, focusing and visualization are not kept separate. Instead, analysis falls into data gathering, discovery during knowledge management and analysis within information exploration. Focusing is inherent in the knowledge management part and also information exploration. Moreover, knowledge management is the organization of data in models and should not be part of a reverse engineering process, but rather the products resulting with every step. [19] devides further the reverse engineering tasks into program analysis, plan recognition, concept assignment, redocumentation and architecture recovery. These tasks, except of concept assignment, fall in our approach all into low and high level analysis. Concept assignment is so far not integrated into our approach since it would additionally need the support for a top-down cognitive model and hence the integration of forward engineering. However, the framework denotes essential requirements for the upcoming unified recovery architecture. Another framework for classifying software reverse engineering techniques can be found in [20]. The authors provide a taxonomy of reverse engineering techniques, which denotes important semantic dimensions: semantic distance, semantic accuracy, semantic precision and semantic traceability. Applying the dimensions to our process, we can see that our process provides an ideal balance between the semantic dimensions, e.g. within the semantic distance, our visualization process provides model abstractions on low as well as high levels. However, what we do not cover in this paper is work related to reverse engineering from a cognitive point of view, as e.g. [21]. VI. C ONCLUSION AND F UTURE W ORK The established unified recovery process and also the unified recovery architecture that we are currently implementing, contribute program comprehension vitally. First of all, because they denote the first conceptual process and architecture for reverse engineering. The main advantage of this process lies in the decoupling of analysis and visualization, supporting specific tools and processes for each. However, both parts fit well together and accomplish each other through well-defined interfaces. These interfaces allow the individual development, and enhancement, of visualization and analysis techniques, in the way that they can be just exchanged or plugged into our framework. Another advantage of the described process is bidirectional mapping. Interactive changes to views on any visualization
level influence not only the models on the same representation level but update also lower and higher level representations and their views. For example, if a component on the architecture level is removed, the representation on architecture as well as class level must be updated, in order to keep the system consistent. On the other hand, interactions on class level influence the architecture level. Additionally, the diverse program representations can be interactively abstracted, compressed and fused. With our upcoming architecture, we support the overall process of reverse engineering, where analysis, focusing and visualization work hand in hand. No longer, analyses and visualization research must be conducted out of the other’s context. It should be just plug and play. R EFERENCES [1] G. Kiczales, K. Lieberherr, H. Ossher, M. Aksit, and T. Elrad. Discussing Aspects of AOP. Comm. of the ACM, 44(10), Oct. 2001. [2] L. Bergmans and M. Aksits. Composing crosscutting concerns using composition filters. Comm. of the ACM, 44(10):51–57, Oct. 2001. [3] P. L. Tarr H. Ossher. Using multidimensional separation of concerns to (re)shape evolving software. Communications of the ACM, 44(10):43– 50, October 2001. [4] T. Panas, J. Andersson, and U. Aßmann. The editing aspect of aspects. In I. Hussain, editor, Software Engineering and Applications (SEA 2002), Cambridge, November 2002. ACTA Press. [5] VizzAnalyzer. http://www.msi.vxu.se/˜tps/ VizzAnalyzer, 2003. [6] O. Ciupke. Automatic detection of design problems in object-oriented reengineering. In Technology of Object-Oriented Languages and Systems - TOOLS 30, pages 18–32. IEEE Computer Society, August 1999. [7] B.V. Dasarathy. Information fusion - what, where, why, when, and how? Information Fusion, 2:75–76, 2001. [8] J. Stasko, J. Domingue, M. H. Brown, and B. A. Price, editors. Software Visualization. MIT Press, 1998. [9] R. Spence. Information Visualization. ACM Press, 2001. [10] T. Panas, J. Karlsson, and M. H¨ogberg. Aspect-jedit for inline aspect support. In submitted to 3rd Workshop on AOP, Essen, Germany, 2003. [11] Rational rose. http://www.rational.com/products/rose/ index.jsp, 2002. [12] TogetherSoft. Together. http://www.togethersoft.com, 2002. [13] J. Grundy and J. Hosking. Ieee international symposium on visual languages (vl’00). In High-Level Static and Dynamic Visualization of Software Architectures. IEEE, September 2000. [14] G. Fitzpatrick, S. Kaplan, and T. Mansfield. Physical spaces, virtual places and social worlds: A study of work in the virtual. In CSCW’96. ACM Press, 1996. [15] K. Vaananen and J. Schmidt. User interfaces for hypermedia: how to find good metaphors? In CHI ’94 conference companion on Human factors in computing systems, pages 263–264. ACM Press, 1994. [16] C. Knight. Visual Software in Reality. PhD thesis, University of Durham, 2000. [17] H. A. Muller, J. H. Jahnke, D. B. Smith, M. D. Storey, S. R. Tilley, and K. Wong. Reverse engineering: a roadmap. In ICSE - Future of SE Track, pages 47–60, 2000. [18] S. R. Tilley, S. Paul, and D. B. Smith. Towards a framework for program understanding. 1996. [19] S. Tilley. A reverse engineering environment framework. Technical report, cmu/sei-98-tr-005, Software Engineering Institute–Carnegie Mellon University, Pittsburg, PA 15213, April 1998. [20] G. C. Gannod and B. H. C. Cheng. A framework for classifying and comparing software reverse engineering and design recovery techniques. In Working Conference on Reverse Engineering, pages 77–88, 1999. [21] I. Zayour. Reverse Engineering: A Cognitive Approach, a Case Study and a Tool. Ph.d. computer science, University of Ottawa, 2002.