data with other information sources. In this paper, we show that the basic travelling information collected by ticket validation (ATV) systems, conventionally.
Traffic Delay Detection by Mining Ticket Validation Transactions Boris Chidlovskii and Eduardo Cardenas Sanchez Xerox Research Centre Europe, 38240 Meylan, France
Abstract— One of the important aspects of traffic management systems is their ability to detect traffic incidents. In this paper, we propose a method for mining the ticket validation timestamps for detecting the delays in public transportation vehicle ridership. We establish a number of criteria crucial for building a robust detector. Method we propose mines the user travelling information for the normal and abnormal patterns in bus ridership. The method observes the transfer time in different places along the routes, and selects such places in an optimal way. Aggregating both normal and abnormal patterns in multi-variate data stream allows to build a reliable detector of traffic incidents. The feasibility and effectiveness of the proposed method is tested on two travelling datasets collected in Nancy and Lyon (France) public transport systems.
I. I NTRODUCTION Intelligent Transportation Systems are designed to use real time information for assisting public transport agencies in critical decision making. Through such systems, agencies invest in Automatic Data Collection (ADC) components in order to monitor vehicle ridership along the route, to adjust their headway plans periodically, to improve the quality of service and to make it more attractive to travellers [3], [10]. One of the most important aspects of traffic management systems is their ability to detect traffic incidents such as accidents, disabled vehicles, and obstacles on the road [13]. The incidents affect vehicles and cause traffic congestion, so an automatic detection method is highly desired. Modern urban public transportation networks deploy the automatic ticketing validation (ATV) systems for fare collection. The system includes ticket validation machines installed on board of the vehicles. They are integrated in the Automatic Fare Collection (AFC) systems designed to reduce the human presence and to eliminate the fare evasion [4]. Each validation records the ticket/passenger card identifier, the location and timestamp. User ticket/card validations collected in an ATV system represent a valuable information for tracking and understanding the passenger flows and demand in the network [3], [9]. Analysis of this data can provide a number of valuable insights for the transit and public transportation agencies [12] for improving their operations. Advances in the navigational technologies, such as Global Positioning Systems (GPS), led to the introduction of Automatic Vehicle Location (AVL) systems for monitoring the vehicle location and fleet management. AVL systems use dead reckoning and signposts where signals are transmitted from a mobile unit to stationary signposts and the position of the vehicle is determined based on known information about the signpost locations [6]. They provide travel agencies
with data collection and measurement systems and enabled the development of comprehensive planning and operations tools [5]. The impact of AVL installations in different cities demonstrated how data recorded by the system may be used to improve service reliability and operations planning on the public network. More and more agencies report the deployment of AVL systems, but a handful of them get the full AVL coverage of the network. In most cases, a few AVL-supplied lines coexist with multiple no-AVL lines. Leveraging the service reliability over the entire system raises the challenge of combining AVL data with other information sources. In this paper, we show that the basic travelling information collected by ticket validation (ATV) systems, conventionally used for the passenger flow understanding, can be also used for measuring the service reliability. Since all buses are equipped with fare collection systems, they generate a massive collection of fare transactions with timestamps which can be analysed for critical insights on bus ridership [8], [10], [14]. In particular, we cope with important traffic delays. We develop a method for mining the user travelling information, namely validation timestamps, for detecting the normal and abnormal patterns in bus ridership. The method observes the transfer time in different places along the routes, where the set of places is selected in an optimal way. Both normal and abnormal patterns get then aggregated in multivariate data stream in order to build a reliable and robust detector. The remainder of the paper is organized as follows. In Section 2, we present the traffic detection as the structural outlier detection in spatio-temporal series produced by ticket validation timestamps. Using a simple example, we identify a transfer time between bus stops as the core element for capturing both normal and abnormal episodes in bus rides. In Sections 3 and 4, we identify and discuss some important elements for building a robust and accurate delay detector, such as traffic volumes and route coverage. In Section 5, we formalize the stop selection as an combinatorial optimization problem and propose a greedy algorithm to solve it in approximative way. Method for traffic problem detection as outlier in multivariate distribution is given in Section 6. Section 7 describes the implementation details; two series of evaluation of evaluation tests for Nancy and Lyon datasets are presented in Section 8. Section 9 concludes the paper. II. O UR APPROACH Any delay in a bus ride causes delays in passenger boardings and therefore delays in their ticket validations. In this paper we address the inverse problem. We analyse
a)
b)
c)
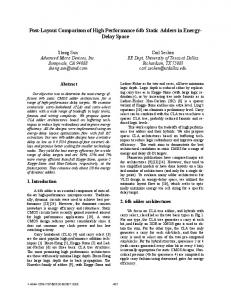
Fig. 1. a) Ride delay in AVL system with available time schedules; b) Ride delay by mining validation timestamps; c) Delays as outliers in transfer time distributions.
the ticket validation timestamps in order to automatically determine important bus delays due to traffic problems. The core component comes from observing the transfer time between two bus stops on a given route. The bus ridership is a complex spatial-temporal process and the transfer time between two stops is influenced by a number of unobserved factors. A few validation timestamps may give an unclear and random picture. If however we collect a large number of validations, we can analyze them and and propose statistically significant hypothesis to assess whether observations reflect certain behavioural patterns. Our approach is based on three following observations: • Important traffic problem results in a critical deviation from the expected transfer time, such deviation can be statistically measured; • A serious deviation concerns not one, but multiple stops at the same ride; • Traffic delays can be treated as the outlier detection when observing simultaneously the transfer time among stops affected by the delay. Outlier detection in traffic data has gained attraction lately due to an increasing capability to track moving vehicles in city roads [11]. Previous studies proposed to merely detect temporal outliers with an emphasis on historical similarity trends between data points, when outliers are calculated from drastic changes in the trends. Main contributions of this paper can be summarized as follows. We express the traffic problem as the structural outlier detection in spatio-temporal series produced by ticket validation timestamps. Transfer time between two bus stops is identified as the basic element for capturing both normal and abnormal episodes in bus rides; we make a normal distribution hypothesis on the transfer time and process the delays as outliers. We extend the above by identifying other crucial aspects to take into account when building a robust and accurate predictor. These aspects include the traffic volume between the stops and its regularity, the distance between stops and the coverage of the route by segments for tracking the transfer time. We pay a particular attention to the route coverage problem; we define the task as a selection of bus stop pairs and express it as a combinatorial optimization
problem. Due to the NP-completeness of the task, we provide a greedy solution to the stated problem which is proved to be close to the optimal solution. A. Example We demonstrate our approach using a simple example. Figure 1.a presents a time-space chart for an imaginary bus line with 15 stops. We assume that 5 of these stops (A, B, C, D, E) are equipped with AVL signposts (shown as vertical lines). The figure shows three bus rides R1, R2 and R3, blue straight lines trace their schedule time, and red lines show the maximal ride delay (for example, set to 10 minutes beyond the schedule). The real rides are shown in bold blue colour. When the ride track crosses a red line, a delay message is triggered. As Figure shows, R1 and R2 rides went OK, while ride R3 triggered a delay warning at stops D and E. Figure 1.b follows the same example, where the fare collection system is used instead of AVL. In this case, the schedule is not available, and ticket validation timestamps are recorded at all stops. In the figure, validation timestamps are shown as violet strips for all stops and rides. As presented before, our idea is to track the transfer time between different stops, produced by passengers validating their tickets during the same ride. Figure 1.c shows transfer time histograms for two selected stop pairs, from ’c’ to ’h’ and from ’A’ to ’i’ (shown as red segments in the diagram). To determine the delay in ride R3, two conditions should be satisfied. First, the delay is to be observed as a deviation from the expected behaviour. Second, such deviations is expected to occur simultaneously in multiple stop pairs covering different segments of the route, including ’c-to-h’, ’A-to-i’ and others. Red arrows in the distribution plots show delays as outliers in the transfer time distributions. III. M ETHOD DESCRIPTION We define the traffic detection problem as tracking abnormal behaviour in the transfer time between stops along the bus route. We call the structured outlier detection the method where we catch transfer time outliers simultaneously for different stop pairs. For multi-stop lines, we select a number of stop pairs for the simultaneously outlier tracking. When selecting the pairs, we take into account the following:
Validation volume: Stops with dense validation volume are preferred to stops with low one, as they are likely to contribute in statistically reliable predictions; • Distance: Tracking the transfer time between two remote or two neighbour stops can catch events of different granularity, on global and local level. It is preferable that both cases are represented in the selection. • Coverage: Sampling the transfer time between bus stops reflect both normal and abnormal events within the corresponding line segment. Therefore, selection of stop pairs should cover the whole line. No stop should remain without covering by at least one time tracking. • Quality control: When ADC generates erroneous timestamps making the transfer time between some stops out of utility. Therefore we need to assess those bus pairs which are allowed to contribute to the traffic detection problem. In the following sections, we address in detail three main contributions to the method, namely, the quality control of transfer time samples, the selection of stop pairs, and the structural outlier detection on the selection. •
IV. Q UALITY CONTROL The transfer time sample between stops si and sj is a 00 00 collection of values t = t −t0 where t and t0 are validation timestamps at si and sj during the same ride, registered by different passengers. Given the transfer time sample, the quality control refers to checking if the sample induced by validation timestamps is consistent with their possible deployment for the traffic problem detection. We use the normality test to reject cases when data can not be assessed and therefore deployed for the outlier detection. Specifically, we use the Lilliefors test of the default null hypothesis that the transfer time sample comes from a distribution in the normal family, against the alternative that it does not come from a normal distribution. The Lilliefors test is a 2-sided goodness-of-fit test [1] suitable when a fully-specified null distribution is unknown and its parameters must be estimated. The Lilliefors test statistic is the same as for the Kolmogorov-Smirnov test: KS = maxx |ECDF (x) − CDF (x)|,
(1)
where ECDF is the empirical cdf estimated from the sample and CDF is the normal cdf with mean and standard deviation equal to the mean and standard deviation of the sample. The test returns the logical value h = 1 if it rejects the null hypothesis at the given significance level (β = 5%), and h = 0 otherwise. Figure 2 processes validation timestamps collected for one bus line in Nancy city and reports transfer time distributions for 30 randomly selected stop pairs. Most of pairs successfully pass the normality test. However, pairs in positions 8, 10, 11, 12, 13 and 29 (pointed by red arrows) fail to pass the test and therefore unlikely to be selected 1 . 1 Analysis
of such abnormal behaviour is beyond the scope of this paper.
Fig. 2.
Stop-to-Stop transfer time samples for a bus line.
V. S TOP PAIR SELECTION Once stop pairs are assessed, we address the problem of selecting an optimal set of stop pairs for the structural outlier detection. Let a selected route have n stops, s1 , . . . , sn . One naive solution is to take n − 1 neighbour stop pairs, (si , si+1 ), i = 1, . . . , n−1; another is to take the longest one (s1 , sn ). Both solutions are unsatisfactory, as they correctly cover the route but ignore the volume and distance issues, explained above. We present the stop pairs selection for structural outlier detection as an optimization problem. We associate a binary variable xij with the stop pair (si , sj ), 1 ≤≤ j ≤ n where xij is 1 if (si , sj ) is selected, 0 otherwise. The problem is to find N stop pairs which maximize a linear cost function while satisfying a number of linear coverage constraints. It can be formalised as follows Pn Pn maximize j>i wij xij Pi=1 n Pn xij ≤ N, subject to i=1P j>iP (2) n n lk ≤ i=1 j>i ck (xij ), k = 1, . . . , n, xij ∈ {0, 1}, where • N is the number of selected pairs, N < n(n − 1)/2; • wij is the weight of binary variable xij ; • ck is the coverage index for stop sk , ck (xij ) = 1 iff xij = 1 and i ≤ k ≤ j, 0 otherwise; • lk is the minimum allowed coverage for stop sk , 0 ≤ lk ≤ N ; in practice we often have lk = 1 for all k. Weights wij are to aggregate two factors, the quality control and the validation volume for pair (si , sj ). The quality is measured by the normality test for the transfer time distribution, hij ; the validation volume is denoted vij . These weights play a double role. On one side, they should penalise cases when the transfer time sample is different from the normal distribution. Second, they should favour pairs with a large volume of validation timestamps for fixed period of time. To fit these goals, the weight for (si , sj ) can be set as the log-product of two factors, wij = log(hij vij + 1). Thus, problem (2) is a combinatorial optimization problem, it is a generalization of 0-1-knapsack problem. Even a simpler version of the problem where ck are constants and independent of xij is NP-hard.
The exact solution to the problem is computationally expensive, an approximated solution should be found. Instead of approximating the solution for (2), we reshape it as a weighted set covering problem for which there exist efficient approximations [15]. We denote P the set of n stops, P = {1, 2, . . . , n}. Each stop pair which passed the quality test, defines a subset of stops it covers. There are m ≤ n(n − 1)/2 S such subsets, F = {P1 , . . . , Pm }, Pj ⊂ P , such that j Pj = P and each Pj has a positive real weight cj . Any 0-1 valued mtuple y = (y1 , ..., ym ) constitutes a cover for P in which the number of times that stop i is covered is defined to be the sum of yj ’s for those Pj ’s which contain iP and the total weight of the multiple cover is defined to be j cj yj . The weighted set covering problem seeks a sub-collection C ⊂ F yielding the minimum weight multiple cover for P , such that every element i is covered at least 1 time. By defining aij to be 1 when i ∈ Pj and 0 otherwise, we can rewrite the above problem as follows: P minimize cj y j j=1 Pm subject to 1 ≤ j=1 aij yj , i = 1, . . . , n, yj ∈ {0, 1}, (3) The exact solution to problem (3) being NP-complete, it was shown [2] that it can be approximated to a factor of Hd = log d + O(1), where d = max{|S| : S ∈ F }. Below we propose a greedy algorithm for the pair selection, which is derived from the greedy heuristics for the weighted set coverage. At each step, it calculates the weighted cost for each of remaining candidates and greedily selects the best one. Since (3) is a minimization problem, and subset Pj ∈ F has volume cj , we set its cost to be cj = 1/vj . If the Algorithm 1 Weighted route covering algorithm. Input: Set F = {P1 , . . . , Pm } of m stop pairs/stop subsets with validation volumes v1 , . . . , vm Output: Subset C ⊂ F of stop pairs covering set P 1: for every subset Pj do 2: Set up weight cj = 1/vj 3: end for 4: C := ∅; P := {1, . . . , n} 5: while P 6= ∅ do cj 6: Find set Pj ∈ F \ C that minimizes α := |Pj ∩P |. 7: C := C ∪ {S}; P := P \ S 8: end while 9: return C
problem. The transfer time observed for N selected pairs form a set of multivariate vectors t=(t1 , . . . , tN )T . its shape and size are quantified by the covariance matrix. Any traffic problem leads to an important deviation from the expected time for multiple stop pairs. Thus it appears as an outlier in the multi-variate distribution. The Mahalanobis distance is often used as the measure of dissimilarity between a vector x and vector y of the same distribution with the covariance matrix C; it is defined as q (4) DM (x, y) = x − y)T C −1 (x − y). Multivariate outliers are simply defined as observations having a large squared Mahalanobis distance [7] from the estimated multivariate mean location µ = (µ1 , . . . , µN ). For the structured outlier detection, we generate a N -dimensional multivariate observations t collected during the same period of time. Large Mahalanobis distance values DM (t, µ) will indicate the most likely traffic problem cases. VII. I MPLEMENTATION All method elements described in Section 4-6, including the transfer time analysis and normality test, the stop pair selection and structural outlier detection has been implemented and tested on different cases. Some screenshots below demonstrate some elements of the implementation.
Fig. 3. a) Bus stop volumes for one route; b) Route coverage by a selected pairs of stops.
algorithm returns |C| pairs and we need N > |C| pairs, the algorithm should be completed by sorting the remaining candidates and selecting N −|C| pairs with the minimal costs ci . Also, the algorithm can be extended to the minimal stop coverage different from 1 [2]. VI. S TRUCTURED OUTLIER DETECTION Once a set of N stop pairs is selected by Algorithm 1, we apply the structured outlier detection to determine the traffic
Fig. 4. Structural outlier detection: a) Hourly means; b) Hourly variances; c) Hourly outlier ratios; d) Hourly Mahalanobis distances.
Figure 3.a reports the stop volumes for the longest route in Nancy city (58 stops), where a stop volume is the number of validation timestamps at the stop, over a fixed period of time (March 2012). One can observe both high and low volumes and their unequal distribution over the route. Figure 3.b shows an example of a route with 14 stops and the result of stop selection accomplished by Algorithm 1 for N = 25. Points refer to bus stops and stop pairs are shown as line segments. In the figure, stop pairs selected by the Algorithm 1 to cover the route are coloured in blue; rejected pairs are shown in green. Figure 4 shows the prototype interface for visualizing the traffic problem detection, for the longest bus line in Nancy city with N = 35 stop pairs. It presents four plots all covering a two week period, on the hourly basis. In any plot, one column aggregates 1 hour information, one row refers to a stop pair. Two top plots report the deviations of hourly mean and variance from the accumulated average values, for all stop pairs. Their block-wise structure is due to low traffic over night hours (see one day pattern in red). The third plot shows the hourly outlier detection (univariate, one line for one selected pair). Points coloured differently from dark blue, refer to important deviations for the corresponding stop pairs and hours. Finally, the last plot aggregates all the data; it reports the multivariate outlier detection by the Mahalanobis distance for all pairs on the hourly basis. Dark blue colours indicate hours with low distance values and therefore normal traffic. Instead, red and yellow colours indicate high distance values and therefore the important traffic delays.
Method for multivariate outlier detection from validation timestamps has been tested on both Nancy and Lyon sets for which we dispose a set of known traffic problems and the schedule delay information collecting by AVL system partially covering. In the tests, we experiment with three versions of the method described in the previous section. • Method M1 applies the quality control but makes a random stop selection. In other words, all stop pairs deployed for the problem detection are expected to yield data fitting the normal distribution, but traffic volumes are ignored and the route coverage is not guaranteed. • Method M2 skips the quality control and selects stop pairs by Algorithm 1 from all available data. The method covers properly all the route but some selected elements might have failed the normality check. • Method M3 applies both the quality control and stop selection by Algorithm 1.
Fig. 6.
Problem recognition for Nancy, k = 10.
Fig. 7.
Problem recognition for Lyon, k = 10.
Fig. 5. Minute-by-minute validation counts for Nancy (left) and Lyon (right) cities.
VIII. E VALUATION In this section we report some evaluation tests of traffic problem detection for two cities, Nancy and Lyon (France). In public transport network of Nancy city, 27 bus lines (89 different bus routes) provide service over the area with 1129 stops. 5.24M ticket validation timestamps have been collected over the period of 60 days in March-April 2012. Similarly, for Lyon city network with 177 lines, 375 routes and 2,449 stops, we dispose 13.82M ticket validation timestamps collected over 3 weeks in January 2011. Figure 5 reports minute-per-minute distribution of validation timestamps in both cities. We observe the similar patterns during the pick and off-pick hours. With transfer time analysis, the percentage of stop pairs passed the quality control is 68.6% for Nancy and 79.1% for Lyon.
Fig. 8.
Problem recognition for Nancy (left) and Lyon (right), k=1.
Below we report two series of evaluation tests on Nancy and Lyon datasets. Known problem recognition. In the first evaluation, we test three methods on the available set of known problems occurred during the observation period. For Nancy, 31 moderate (delay > 10 minutes) and 6 severe (delay > 20 minutes) cases (hours) have been identified, 16 moderate cases have been found in Lyon dataset. The evaluation setup is the following. We generate multinomial observations for all routes with noted problems, on
the hourly basis. For each route, we rank all observation hours by their Mahalanobis distance and then check top k = 10 items for the known problem cases. Figure 6 plots the average accuracy whisker diagrams for Nancy routes, with the number of pairs N varying from 10 to 40; Figure 7 reports the same evaluation results for Lyon set. In both cases, we observe the consistent advantage of the full combination by M3 over partial solutions M1 and M2 . Figure 8 reports the same evaluation results for the very first item (k = 1). The plot suggests that, unlike the previous evaluation, the largest Mahalanobis distance does not necessarily match a known problem; this happens in less than 45% cases, for any method and set. This discovery may have different interpretations, including one of unnoticed problems; further investigation will be needed here. Correlation with AVL data. For Nancy, we dispose the schedule delay information collecting by AVL system covering about 13% of routes and 4% of bus rides. For routes with available AVL data, we select p items with large Mahalanobis distance detected by method M1 , M2 or M3 which refer to the most probable delays. For these candidate delays, corresponding AVL data have been aggregated in the same way, as proportion of at least 10 minutes delays in the whole AVL records. Then we measure the Pearson linear correlation coefficient between the Mahalanobis distance values of delay candidates and the corresponding delay ratios from AVL. Figure 9 plots Pearson linear correlation coefficients for p=10 and p=50, with the number of pairs N varying again from 10 to 40. For three methods, we observe a positive correlation with the values steadily growing with the number N of stop pairs, for all methods.
Fig. 9. Pearson correlation coefficients for top p =10 (left) and p =50 (right) delay candidates.
All conducted evaluation tests indicate than combining the quality control with an accurate pair selection represents a winning strategy for detecting the traffic problems in a public transport system. Observing the transfer time between bus stops selected in a way that satisfies a number of criteria is crucial for feeding a multivariate outlier detection and measuring traffic delays. The method is developed on the line-basis and expected to be complementary to AVL systems. In installations where AVL is not available or where existing AVL offers a partial coverage (not all buses/routes are equipped with AVL), the analysis of ticket validations can compensate the miss. We showed that under certain conditions, this analysis can produce statistically reliable insights on the traffic problems.
The most interesting extension to the current method is to relax the fixed hour-based grid used at all steps. The current analysis is based on collecting hourly data sufficient to statistically validate hypothesis made. However, the data volume vary a lot in the function of pick and pick-off hours, high and low volume rides, etc. We are looking forward to developing a flexible grid principle; it would be adaptable to the available data flow and capable of statistical hypothesis validation without predictive loss. This can reduce, for example, the grid size to half-hour during the pick hours. IX. C ONCLUSION We presented a method for mining the ticket validation data collected by AFC systems for the traffic delay detection. Our method is developed in the framework where the flow of transactional data from the public transport system is collected and analysed off-line. In PT installation where AVL data are not available or partial, ticket validation data represents an important source of information and can serve as a solid alternative or complement to the AVL data. The method we propose is composed of three main components, the quality control for transfer data flow, the stop set selection and the structural outlier detection. Each of these elements may be a subject of potential improvements which will be addressed in our future work. R EFERENCES [1] Herve Abdi and Paul Molin. Lilliefors/van soests test of normality. In Encyclopedia of Measurement and Statistics, Ed. Neil Salkind, 2007. [2] Edward K. Baker. Efficient heuristic algorithms for the weighted set covering problem. Computers and Oper. Research, 8(4):303–310, 1981. [3] Catherine Morency Bruno Agard and Martin Trepanier. Mining public transport user behaviour from smart card data. In 12th IFAC Symp. on Information Control Problems in Manufacturing, 2006. [4] Alex Cui. Bus passenger origin-destination matrix estimation using automated data collection systems. In MIT, Dept. of Civil and Environmental Engineering, MS thesis, 2006. [5] Joseph Emanuel Ehrlich. Applications of automatic vehicle location systems towards improving service reliability and operations planning in london. In MSc Thesis, MIT, Dept. of Civil and Environmental Engineering, 2010. [6] Mahmoud Abd El-Gelil and Ahmed El-Rabbany. Where’s my bus? radio signposts, dead reckoning, and gps. GPS World, 15(6), 2004. [7] P. Filzmoser, R. Maronna, and Werner M. Outlier identification in high dimensions. Comp. Statistics and Data Analysis, 52:1694–1711, 2008. [8] Kun-Chan Lan and Ze Ming Wu. On the feasibility of using public transport as data mules for traffic monitoring. In Intelligent Vehicles Symposium, 2008 IEEE, pages 979 –984, june 2008. [9] N. Lathia and L. Capra. Mining mobility data to minimise travellers’ spending on public transport. In ACM SIGKDD Intern. Conf. on Knowledge Discovery and Data Mining, pages 1181–1189, 2011. [10] N. Lathia, J. Froehlich, and L. Capra. Mining public transport usage for personalised intelligent transport systems. In IEEE International Conference on Data Mining, pages 887–892, 2010. [11] X. Li, Zh. Li, J. Han, and J.-G. Lee. Temporal outlier detection in vehicle traffic data. In Proceedings of the 2009 IEEE Intern. Conf. Data Engineering, ICDE ’09, pages 1319–1322, 2009. [12] Alan T. Murray. Strategic analysis of public transport coverage. SocioEconomic Planning Sciences, 35(3):175 – 188, 2001. [13] I. Ohe, H. Kawashima, M. Kojima, and Y. Kaneko. A method for automatic detection of traffic incidents using neural networks. In Vehicle Navigation and Inf. Systems Conf., pages 231 –235, 1995. [14] Matti Pursula. Simulation of traffic systems - an overview. Journal of Geographic Information and Decision Analysis, 3:1–8, 1999. [15] Vijay V. Vazirani. Approximation Algorithms. Springer-Verlag, 2001.