Advanced OR and AI Methods in Transportation
TRAFFIC PARAMETERS ESTIMATION TO PREDICT ROAD SIDE POLLUTANT CONCENTRATIONS USING NEURAL NETWORKS Fabio GALATIOTO1, Pietro ZITO2, Marco MIGLIORE3
Abstract. The analysis aims to evaluate which among traffic parameters (flows, queues length, occupancy degree and travel time) are most important in order to forecast CO and C6H6 concentrations. The study area was identified by Notarbartolo Road and bounded by Libertà Street and Sciuti Street in the urban area of Palermo. In this area, various loop detectors and one pollution monitoring site were located. Traffic data were estimated by SUMO micro-simulator software. Traffic and weather data were used as input variables to predict pollutant concentrations by using neural networks.
1. Introduction The pollutant concentrations in urban areas that are produced by traffic emissions depend on vehicle characteristics, traffic and weather conditions, and the geographic and built environment characteristics of the local site [3]. Carbon monoxide (CO) and benzene (C6H6) are mostly from vehicle exhausts and hence the focus of this study. Many researchers have sought to predict road side pollutant concentrations by traffic and weather data. Among these, Moseholm et al. (1996) studied the usefulness of neural network to understand the relationships between traffic parameters and CO concentrations measured near an intersection [3]. Dorzdowicz et al. (1997) developed a dispersion model based on neural network to estimate hourly mean concentrations of CO in the urban area of Rosario city [1]. Gardner and Dorling (1999) developed a multi layer perceptron neural network model with hourly NOx and NO2 and meteorological conditions data of Central London showing that the neural network outperforms the ordinary least squared model [2]. 1
Department of Aeronautical and Transportation Engineering, University of Palermo, Viale delle Scienze, Edificio n. 8, 90128 Palermo (Italy),
[email protected] 2 Department of Aeronautical and Transportation Engineering, University of Palermo, Viale delle Scienze, Edificio n. 8, 90128 Palermo (Italy),
[email protected] 3 Department of Aeronautical and Transportation Engineering, University of Palermo, Viale delle Scienze, Edificio n. 8, 90128 Palermo (Italy),
[email protected]
Traffic parameters estimation to predict road side pollutant…
89
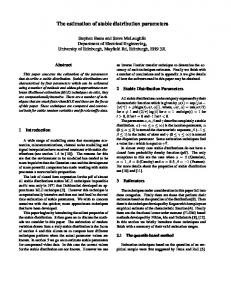
No previous work evaluated what among traffic input parameters (essentially flows, queues length, occupancy degree and travel time) played the most important role in the forming process of CO and C6H6 concentrations. For this purpose the main research goal is to undertake a comparative analysis among the different traffic parameters (namely flows, queues length, occupancy degree and travel time) using neural networks. The study area was Notarbartolo Road and bounded by Libertà street and Sciuti Street in the urban area of Palermo (see figure 1). In this area, various loop detectors and one pollution monitoring site were located by City Council. This area is very important since it joins the Port of Palermo to the highway net. Moreover it is characterized by canyon shape, high traffic flows (in particular heavy vehicles) and coordination of traffic lights (range 80 – 150 m). The raw traffic data collected every hour come from four loop detectors: two of these were located on rear end and front end of the part of Notarbartolo Road identified by 62 and 73, and finally one on Morello Street and the other on Lo Jacono Street (identified by 81 and 71 respectively). All the data used were regularised into hour intervals. Data between 31/03/2004 and 06/09/2004 inclusive were collected and pre-processed to remove invalid values. The pollution monitoring site was located on link of Notarbartolo Road between Sciuti and Morello Street. In order to estimate the traffic parameters directly close to the pollution monitoring site, a micro simulation was carried out by using SUMO software (Simulation of Urban MObility). Thus, the traffic parameters estimated by SUMO micro-simulator (flows, queues length, occupancy degree and travel time) immediately near to the monitoring site together with weather data were used as input for neural Networks to be analyzed. The neural networks can approximate highly non-linear functions with little information about the nature of these relationships. The collinearity among input variables set was investigated by SPSS, as well as most important lagged input variables in order to determine the most appropriate input data set. In this study was used the feed forward neural network. A sensitivity analysis was carried out to determine the relative importance of each input variable.
Figure 1. The study area.
90
F. Galatioto et al.
2. Methodology The traffic parameters taken into account were: flows (F1 and F6 for the downstream and upstream directions respectively), queues length (Q1 and Q6), occupancy degree (OD1, OD6), travel time (T1, T6); whereas the weather parameters were: temperature (T), humidity (U), wind speed (WS) and wind direction (WD). Initially the data were analysed by using the traditional statistical methods to investigate whether any obvious correlations were present. The analysis highlighted that there was a high collinearity among the traffic parameters. Furthermore the cross-correlation analysis showed that the CO concentrations were differently correlated to the traffic parameters related to the upstream and downstream directions (identified by 6 and 1 respectively, see figure 2). CO with F1
CCF
CO with F6
1.0
1.0
.5
.5
CCF 0.0
0.0
-.5
-.5 Confidence Limits
-1.0
-7
-6
-5
-4
-3
-2
-1
0
1
2
3
4
5
6
7
Coefficient
Confidence Limits
-1.0
Lag Number/Hour
-7
-6
-5
-4
-3
-2
-1
0
1
2
3
4
5
6
7
Coefficient
Lag Number/Hour
Figure 2. The cross-correlation analysis Therefore, it should be noted that the traffic parameters related to the upstream direction presented the best correlation for two hours of lag, whereas for downstream direction was one hour of lag. The same happened for the C6H6 concentrations. Thus, the data set was synchronized shifting the traffic parameters of one and two hours of lag in according to different directions. The multi layer perceptron were used in this analysis. The architecture of the neural network varies but in general consists of several layers of neurons. Its structure was determined by pruning approach. Thus the neural network has two hidden layers (of 10 and 5 neurons respectively) and finally an output layer. Data were scaled linearly to a range (0,1) that is appropriate for the logistic transfer function of neurons, whereas the Levenberg - Marquardt learning algorithm was used in the neural networks. After the neural networks were trained, the input variables were then examined to see which of them was most important for the estimation of pollutant concentrations. Each of input variables is increased by a certain percentage (e.g. 5%) in turn, and the change in the output caused by the change in the input is calculated. The sensitivity of each input is given by: S ( x p ) = 100 ×
∆Voutput ∆Vinput
(1)
Traffic parameters estimation to predict road side pollutant…
91
The sensitivity analysis shows us how an input variable increase causes a significant change (either positively or negatively) to the output variable. Finally, after the initial training of the neural networks was completed, a comparative analysis among the different traffic parameters (flows, queues length, occupancy degree and travel time) was curried out in order to evaluate the accuracy of various neural models, using statistics indexes (the root mean squared error RMSE between the estimated ti and the actual values ai, and the correlation coefficient R) as forecasting performance measures. RMSE =
1 N
∑ (t i − ai ) N
(2)
2
i =1
3. Results The table 1 shows the outcomes of the comparative analysis among different traffic parameters. It should be noted as the queue length is the traffic parameter which better explains the variation over time of pollutant concentrations. Output CO
Feed Forward Neural Networks Input variables R
RMSE
0.6729
0.5166
T, U, WS, WD, F1, F6
0.8161
0.6660
T, U, WS, WD, T1, T6
0.8004
0.6406
T, U, WS, WD, OD1, OD6
0.8203
T, U, WS, WD, Q1, Q6
C6H6
R2
0.8210
0.6740
0.5216 0.5409
0.5156
T, U, WS, WD, F1, F6
0.8179
0.6689
3.0912
T, U, WS, WD, T1, T6
0.7772
0.6040
3.3923
T, U, WS, WD, OD1, OD6
0.8088
T, U, WS, WD, Q1, Q6
0.6541
0.8181
0.6693
3.1615 3.1327
Table 1. The comparative analysis among the different traffic parameters. P. U. [%] 1.5
1
0.5
0
-0.5
-1
T
U
WS
WD
Q1
Q6
Figure 3. The sensitivity analysis related to C6H6.
92
F. Galatioto et al.
P. U. [%]
1 0.8 0.6 0.4 0.2 0 -0.2 -0.4 -0.6 -0.8
T
U
WS
WD
Q1
Q6
Figure 4. The sensitivity analysis related to CO. The figures 3 and 4 show the analysis related to C6H6 and CO respectively considering the queues length as traffic parameters. It should be noted the different behaviour of some weather parameters such as the temperature and the humidity for C6H6 are positively correlated, whereas for CO are negatively correlated. Moreover for both pollutants the traffic parameters are always positively correlated. The figures 5 and 6 show the actual and predicted values for CO and C6H6 highlighting as for an unseen data set, the neural networks provide reliable predictions (considering as traffic parameters Q1 and Q6). CO 3.5 [µg/m3] 3
Unseen Data
2.5 2 1.5 1 0.5 0
0
5
10
Actual Values
15
20
25
30
35
Estimated Values
40
45
50
Hours
Figure 5. Actual and predicted values of CO concentrations
Traffic parameters estimation to predict road side pollutant… C6H6 [µg/m3]
30
93
Unseen Data
25 20 15 10 5 0 0
5
10
Actual Values
15
20
25
30
35
Estimated Values
40
45
50 Hours
Figure 6. Actual and predicted values of C6H6 concentrations.
4. Conclusions This study applies the neural networks to predict the CO and C6H6 in the urban area of Palermo. A comparative analysis among the different traffic parameters (flows, queues length, occupancy degree and travel time) was carried out by neural networks, in order to determine the most important traffic parameter. The analysis highlighted that the queues length were the better correlated traffic parameter to the pollutant concentrations. Thus it explained about 82% of CO and C6H6 variations over time. Moreover, it was highlighted as the queues length related to the downstream direction (Q1) showed to have a major importance than queues length related to the upstream direction (Q6).
References [1] Dorzdowicz B, Benz S. J., et. Al. A neural network based model for the analysis of carbon monoxide concentration in the urban area of Rosario. Computational Mechanics Publications, Southampton 677-685, 1997. [2] Gadner M.W., Dorling S. R. Neural network modelling and prediction of hourly NOx and NO2 concentrations in urban air in London. Atmospheric Environment 33, 709719, 1999.
[3] Moseholm L., Silva J., Larson T. Forecasting carbon monoxide concentrations near a sheltered intersection using video traffic surveillance and neural networks. Transportation Research D 1. 15-28, 1996.