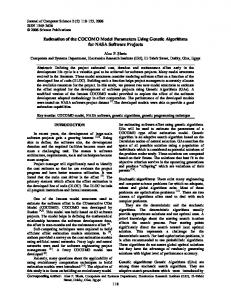
The lack of closed form expression for the pdf of almost all stable distributions .... the numbers of bits/frame for a JPEG encoded version of the movie Star Wars.
The estimation of stable distribution parameters Stephen Bates and Steve McLaughlin Department of Electrical Engineering, University of Edinburgh, Mayfield Rd, Edinburgh, EH9 3JL
Abstract This paper concerns the estimation of the parameters that describe a stable distribution. Stable distributions are characterised by four parameters which can be estimated using a number of methods and although approximate maximum likelihood estimation (MLE) techniques do exist, they are computationally intensive. There are a number of techniques that are much faster than MLE and these are the focus of this paper. These techniques are compared and contrasted both for stable random variables and for teletraffic data.
1 Introduction A wide range of modelling areas that encompass economics, telecommunications, channel noise modelling and signal interpolation have received treatment with stable distributions (see section 1.4 in [10]). The reasons for this are that the environment to be modelled has tended to be more impulsive than the Gaussian case and the development of more powerful computers has made working with stable processes a more realistic proposition. The lack of closed form expression for the pdf of almost all stable distributions makes MLE techniques impossible and it was only in 1971 that DuMouchel developed an approximate MLE technique [2]. However this technique is computationally intensive and does not lend itself to the real time estimation of stable parameters. We wish to concern ourselves with the quicker, more approximate techniques that have been developed. This paper begins by introducing the salient properties of the stable distribution. It then goes on to discuss the methods we consider in this paper. The estimation of random variables drawn from a truly stable distribution is the focus of section 4 and this allows us to compare how different techniques perform when the actual parameter values are known. In section 5 we go on to estimate stable parameters for compressed video data. In this case the correct values for the stable distribution are not known. However we use
an inverse Fourier transfer technique to determine the accuracy of each techniques estimates. Finally we finish with a number of conclusions and in appendix A we give details of how the software used in this paper may be obtained.
2 Stable Distribution Parameters All stable distributions can be uniquely expressed by their characteristic function which is given by '(t) = expfjat ? j tj�[1 + j sign(t)!(t; �)]g; where, !(t; �) = tan(��=2) for � 6= 1 and (2=�) log jtj for � = 1 and sign(t) = 1 for t > 0, 0 for t = 0 and -1 for t < 0: The parameters a, �, and describe completely a stable distribution. a (?1 � a � 1) is the location parameter, � (0 � � � 2) is termed the characteristic exponent, (?1 � � 1) is the index of skew and (0 � � 1) is termed the dispersion parameter. Some estimation techniques find 1 a value for c which is equal to � . In almost every case stable distributions do not have a closed form probability density function (pdf). The only exceptions to this are the case when � = 2 (Gaussian), � = 1; = 0 (Cauchy) and � = 0:5; = ?1 (Pearson). For more details about the properties of stable distribution see [10] and [11].
3 Estimators The techniques under consideration in this paper fall into three categories. Firstly there are those that perform their estimates based on the quantiles of the distribution[9]. Then there is the technique developed by Kogon which employs an empirical estimate of the characteristic function [4]. Finally there are the fractional lower order moment (FLOM) based methods developed by Nikias, Ma and Tsihrintzis [8], [12]. In this section we briefly introduce these techniques and finish with a summary of their valid estimation ranges.
3.1
The quantile based method
Estimation techniques based on the quantiles of an empirical sample were first suggested by Fama and Roll [3].
However their technique was limited to symmetric distributions and suffered from a small asymptotic bias. McCulloch developed a technique that uses five quantiles from a sample and estimates �, , c and a over a wider range of the parameter space without asymptotic bias [9].
4.1
3.2
4.2
The characteristic function based method
Stable distributions can be uniquely defined by their characteristic function (the Fourier transform of their pdf). This implies that an empirical approximation of the function may be used to estimate the stable parameters for that sample. It was Koutrouvelis who first developed a method that took advantage of this approach [5], [6]. However in [4] Kogon develops a modified approach that yields better results in almost all cases and reduces the amount of computation required.
3.3
The FLOM based methods
A stable random variable with characteristic exponent 1 � � < 2 has infinite variance but finite mean. If the random variable has � < 1 then both the mean and variance are infinite. More generally we can say E(jX jp ) = 1 if p � �; < 1 if p < �. We can therefore use the behaviour of these FLOMs to determine an estimate for �. In [8] Ma and Nikias present the log FLOM method and in [12] Tsihrintzis and Nikias present the extreme order method.
3.4
Summary
Table 1 summarises the permissible range of parameter values for each of the estimation methods. Parameters that can be estimated by a given technique are marked with a *. Name McCulloch Kogon Ma Tsihrintzis
� :6; 2)� � (0; 2) � (0; 2) � (0; 2)
(0
Table 1.
?1; 1)� � (?1; 1) (
(0) (0)
(0
; 1)�
(1)
�
; 1)� � (0; 1) (0
a
?1; 1)�
(
(0) (0)
?1; 1)�
(
Permissible ranges of estimation.
4 Estimating parameters for stable random variables In this section we test the accuracy of the estimation techniques when the data is drawn from a stable distribution with known parameter values. In all the cases in this section we performed the estimation for 1000 independent sets of data, each of length 1000, and recorded the mean and the 95% confidence interval of the estimate.
Generating stable random variables
We generated the stable random variables using a method based on the work of Chambers, Mellow and Stuck (CMS) [1] and reproduced in [11].
Results
The first results consider the case of estimating � when = 0, c = 1 and a = 0. Figure 1 plots the mean and 95% confidence interval for � for the four estimation techniques. The next series of results is concerned with the estimation of � and for series of stable random variables drawn from a skewed distribution. We only used the results from those estimators capable of estimating i.e The estimators of Kogon and McCulloch. We have plotted the results for =-1, -0.5, 0.5 and 1 in figures 2-5. Next we wished to consider the effects of mis-applying a symmetric estimator to an asymmetric series. In this case we used the FLOM based techniques to estimate � from data drawn from a skewed distribution ( =-0.5 and 0.5, figure 6). To investigate the estimation of we generated data and then scaled it using the mapping X ! X � k. Since the CMS algorithm generates random variables with = 1 the 1 expected estimate of the scale parameter, c (c = � ) is k. We considered the symmetric case for k=0.1 and k=10 (figures 7 and 8).
4.3
Discussion
There are many points that can be made about the results in section 4.2, the main ones we wish to make are listed below. 1. In figure 1 McCulloch’s method performs best when � > 0:5 (as expected) with a slight drop in the accuracy of �ˆ as � ! 2. 2. Tsihrintzis’s method tends to overestimate � although it gives very similar results for = 0 and = �0:5. This is unexpected as the method is based on the assumption of symmetry. 3. Kogon’s estimation technique tends to perform better then McCulloch’s over the range � 2 (0; 2], 2 [?1; 1], c = 1 and a = 0 (figures 2 - 5). 4. The method of Ma performs just as well at estimating � when = �0:5 as when = 0. This suggests that the FLOM techniques may be more robust to the value of than previously thought. 5. Kogon’s cˆ are very poor when k = 10 but improve when k = 0:1. This is due to the flattening effect larger have on the characteristic function.
6. Tsihrintzis’s’ cˆ are overbiased when underbiased when k = 0:1.
k = 10 and are
7. McCulloch and Ma’s estimates for cˆ are superior than the other two methods. Ma slightly outperforms McCulloch over the range � 2 (0; 2].
5 Estimating parameters for real data In this section we turn our attention to attempting to determine stable parameters for real data, to which we are attempting to fit a stable distribution. One problem is determining whether the estimated parameters produce a distribution which matches the data well. To test this we perform a goodness of fit test between the estimated pdf of the data and the pdf of the estimated stable distribution. We have already mentioned that no closed form expression for the pdf exists in most cases of stable distribution but we can determine it by calculating the inverse Fourier transform of the characteristic equation (section 2.3 in [10]).
5.1
The video data
The video data consists of 171000 values representing the numbers of bits/frame for a JPEG encoded version of the movie Star Wars. The salient statistics of the data are N = 171000 � = 27791.2
5.2
� = 6254.2 max = 78459
min = 8622
The Ethernet data
The packet data was generated from a well studied Ethernet trace collected at Bellcore Labs [7]. From this trace we constructed the “activity” per second data set (measured in bytes/s). We then differenced this set to obtain a distribution that was less one sided and more suitable for estimation. The statistics of the data are N = 3143 � = 24.3
5.3
� = 79018
min = -377870
max = 395970
�ˆ 1.898 1.985 NaN 1.944
Technique McCulloch Ma Tsihrintzis Kogon
Table 2.
cˆ 4130 1.052 NaN 1.018
aˆ 27856 -0.008 -
Results for JPEG video data.
Technique McCulloch Ma Tsihrintzis Kogon
Table 3.
ˆ 1.000 4.338
�ˆ
ˆ
1.511 1.426 4.349 1.788
0.046 0.696
cˆ 41924 0.878 0.000 1.123
aˆ 1577 -0.033 -
Results for Ethernet activity data.
JPEG results The �ˆ was close to 2 for every technique (except Tsihrintzis) which suggests that the ˆ are very unstable. This explains the large (and impossible) value for ˆ from Kogon’s estimator. The NaN (Not a Number) results for the Tsihrintizis method result from the fact that the method must take the square-root of a value which in this case was negative. Since no similar result occurred when testing with stable random variables this may suggest the data in question does not approximate to a stable distribution. In order to determine the performance of the estimation techniques we calculated the approximate pdf of the stable distribution with the estimates found using McCulloch’s, Ma’s and Kogon’s techniques. The results are compared with the pdf of the original data in figure 9. Ethernet results In this case, even though the distribution was again symmetric in appearance (see figure 10) the � ˆ were significantly less than 2 in all cases. This suggests that the distribution is more impulsive than for the JPEG case. It also means that ˆ are more stable and have more influence over the shape of the distribution. An interesting point is that it is the Ma technique’s estimate of � that achieves the best match, even though Kogon’s technique estimates j j > 0.
Estimation procedure and results
6 Conclusions In section 4.2 we discovered several important points about the performance of the estimation techniques. One point is that Kogon’s technique gives good � and estimates but only when c is close to 1. Therefore McCulloch’s technique was applied first to the real data and it was scaled using cˆ and aˆ . Since we found evidence to suggest the FLOM methods work well even when 6= 0 we applied them to the data. Finally Kogon’s technique was applied and all the estimated values were recorded in tables 2 and 3.
In this paper we have directly compared four quick stable parameter estimation techniques, with both stable random variables and two forms of real data. The results contain a wealth of information but we have only space to make a few salient observations. These experiments were carried out to learn more about how we should apply these techniques to real data estimation. In that respect we suggest that:-
1. Scaling is critical for Kogon’s technique. 2. Tsihrintzis and Ma’s techniques can be applied, even if it appears that j j > 0. 3. More than one technique should be applied until more about the performance of these techniques is understood.
[12] G. A. Tsihrintzis and C. L. Nikias. Fast estimation of the parameters of alpha-stable impulsive interference. IEEE Transactions on Signal Processing, 44(6):1492–1503, June 1996.
Figures 2 McCulloch Kogon Ma Tsihrintzis
1.8 1.6 1.4 Estimated alpha
Tables 2 and 3 record our estimates for two real data sets and the difference between the results for the different techniques are marked in some cases. Until we learn more about why this is the case we should be careful when applying these techniques to real data.
1.2 1 0.8 0.6
Appendix A
0.4 0.2 0
C code for the generation and estimation techniques discussed in this paper is available from the authors on request.
0
0.4
0.6
0.8 1 1.2 Actual alpha
1.4
1.6
Figure 1. Results for �ˆ when
References
1.8
=
2
0.
2.5
Estimated alpha and beta
2
McCulloch, alpha Kogon, alpha McCulloch, beta Kogon, beta
1.5 1 0.5 0 -0.5 -1 -1.5 0
0.2
0.4
0.6
0.8 1 1.2 Acutal alpha
1.4
1.6
1.8
Figure 2. Results for �ˆ and ˆ when
2
=
?1.
2.5 2 Estimated alpha and beta
[1] J. M. Chambers, C. L. Mallows, and B. W. Stuck. A method for simulating stable random variables. Journal of the American Statistical Association, 71(354):340–344, June 1976. [2] W. H. DuMouchel. Stable distributions in statistical inference. PhD thesis, Yale University, 1971. [3] E. F. Fama and R. Roll. Parameter estimates for symmetric stable distributions. Journal of the American Statistical Association, 66(334):331–338, June 1971. [4] S. Kogon and D. Williams. On the characterization of impulsive noise with �-stable distributions using fourier techniques. In Proceedings of the 29th Asilomar Conference of Signals ,Systems and Computing, 1995. [5] I. A. Koutrouvelis. Regression-type estimation of the parameters of stable laws. Journal of the American Statistical Association, 75(372):918–928, December 1980. [6] I. A. Koutrouvelis. An iterative procedure for the estimation of the parameters of stable laws. Communications in Statistics - Simulation and Computation, 10(1):17–28, 1981. [7] W. Leland, M. Taqqu, W. Willinger, and D. Wilson. On the self-similar nature of Ethernet traffic (extended version). IEEE/ACM Transactions on Networking, 2(1):1–14, February 1994. [8] X. Ma and C. L. Nikias. Parameter estimation and blind channel identification in impulsive signal enviroments. IEEE Transactions on Signal Processing, 43(12):2884– 2897, December 1995. [9] J. H. McCulloch. Simple consistent estimators of stable distribution parameters. Communications on Statistics - Simulation, 15(4):1109–1136, 1986. [10] C. L. Nikias and M. Shao. Signal processing with alphastable distributions and applications. John Wiley & sons, 1996. [11] G. Samorodnitsky and M. Taqqu. Stable Non-Gaussian Random Processes: Stochastic Models and Infinite Variance. Chapman & Hall, 1994.
0.2
McCulloch, alpha Kogon, alpha McCulloch, beta Kogon, beta
1.5 1 0.5 0 -0.5 -1 -1.5 0
0.2
0.4
0.6
0.8 1 1.2 Acutal alpha
1.4
1.6
Figure 3. Results for �ˆ and ˆ when
1.8
=
2
?0:5.
2.5 McCulloch, alpha Kogon, alpha McCulloch, beta Kogon, beta
20
1.5 1 0.5 0 -0.5 -1 -1.5 0
0.2
0.4
0.6
0.8 1 1.2 Acutal alpha
1.4
1.6
Figure 4. Results for �ˆ and ˆ when
1.8
=
2
Estimated scale parameter (c)
Estimated alpha and beta
2
5
0.2
0.4
0.6
0.8 1 1.2 Acutal alpha
1.4
1.6
1.8
2
Figure 8. Results for cˆ when k=10.
1.5 1 0.5 0
8e-05
-0.5
7e-05
-1
6e-05
Kogon Ma McCulloch JPEG data
5e-05 0
0.2
0.4
0.6
0.8 1 1.2 Acutal alpha
1.4
1.6
1.8
Figure 5. Results for �ˆ and ˆ when
=
2
Probability
Estimated alpha and beta
McCulloch, c=10 Kogon, c=10 Ma, c=10 Tsihrintzis, c=10
0
McCulloch, alpha Kogon, alpha McCulloch, beta Kogon, beta
-1.5
1.
4e-05 3e-05 2e-05 1e-05
2.5 Ma, b=-0.5 Tsihrintzis, b=-0.5 Ma, b=0.5 Tsihrintzis, b=0.5
2 Estimated alpha
10
0
0:5.
2.5 2
15
0 -1e-05 0
10000 20000 30000 40000 50000 60000 70000 80000 Frame Size (bits)
1.5
Figure 9. The real and estimated stable pdfs for the JPEG data.
1
0.5
0 0
0.2
0.4
0.6
0.8 1 1.2 Acutal alpha
1.4
1.6
1.8
2
Figure 6. Results for �ˆ when the FLOM based techniques are applied to a skewed distribution.
9e-06 8e-06 7e-06
Kogon Ma McCulloch Ethernet data
6e-06 Probability
Estimated scale parameter (c)
0.2 McCulloch, c=0.1 Kogon, c=0.1 Ma, c=0.1 Tsihrintzis, c=0.1
0.15
5e-06 4e-06 3e-06 2e-06 1e-06
0.1
0 -300000 -200000 -100000 0 100000 200000 Differenced Work data (bytes/sec)
300000
0.05
0 0
0.2
0.4
0.6
0.8 1 1.2 Acutal alpha
1.4
1.6
1.8
Figure 7. Results for cˆ when k=0.1.
2
Figure 10. The real and estimated stable pdfs for the Ethernet data.