Proceedings of the 3rd International Conference on Industrial Application Engineering 2015
Traffic Sign Classification using Support Vector Machine and Image Segmentation Kedkarn Chaiyakhan*, Anusara Hirunyawanakul, Ratiporn Chanklan, Kittisak Kerdprasop, Nittaya Kerdprasop Data Engineering Research Unit, School of Computer Engineering, Institute of Engineering, Suranaree University of Technology, Nakhon Ratchasima 30000, Thailand. Rajamangala University of Technology Isan, Nakhon Ratchasima 30000, Thailand. *Corresponding Author:
[email protected]
Abstract 1. Introduction Traffic sign classification system is a part of driving assistance system that automatically alerts and instructs the driver about the meaning of traffic signs. In this paper, we proposed the idea for classifying automatically each type of traffic signs. The proposed method has been tested with a publicly available dataset: German Traffic Sign Recognition Benchmark (GTSRB). We use 360 images for testing by grouping traffic signs into 12 groups and images are taken by short distance from camera. In the first stage of our method, we have to separate particular traffic sign from background using color analysis, edge detection, and region of interest (ROI). In the process of ROI, we use Hough Transform algorithm to detect the different shapes of circle, square, and triangle. After we obtained edge images and images from ROI, in the subsequent stage we use 75% of images for training and 25% of images for testing using support vector machine classification algorithm. From ROI image we use feature extraction to get normal direction from edge image and also use support vector machine (SVM) to classify and compare results between ROI and ROI with normal direction feature. In our experimental results, using ROI and SVM can improve the efficiency of classification which has the accuracy 73%, ROI with normal direction feature and SVM can improve the efficiency of classification which has the accuracy 88.60%, when compare with the original involved background 67.80%. The improvement from SVM is about 5% and 20.8% respectively.
Image segmentation is the important process to subdivide an image into several regions. It is an important topic in computer vision and image processing. The result of segmentation is objects that are separated from background. The separated objects can decrease processing time and processing steps. Nowadays image segmentation has been widely used in several kinds of applications such as industrial images, geography and traffic safety. In this paper, we propose the experiment results of classification for several kinds of traffic signs by performing segmentation using image processing technique and classifying with support vector machine. Traffic sign was designed for human to recognize and interpret the meaning of the abstract sign which using uncomplicated shape, character and symbol. The development of traffic sign recognition has been used for automatic driven vehicle or warning system for driver. Then it is an interesting task to make the computer identify, distinguish, and recognize the traffic sign correctly. Color space is primarily used to obtain image information and detection. The Hue-Saturation-Value(1,2) (HSV) color space has been the most popular one as it based on human color perception. In addition it is considered largely invariant to illumination changes and also used to classify traffic sign by color separation. Many researchers use Red-Green-Blue (RGB) color space(3) to get image information and then convert it to a gray scale image to find edge contour of traffic sign region. However RGB is not a good representation with color separated between
Keywords: image classification, support vector machine, hough transform, feature extraction, ROI. DOI: 10.12792/iciae2015.013
52
© 2015 The Institute of Industrial Applications Engineers, Japan.
objects and background. Thus, the conversion of RGB to gray scale image is required and then uses gray scale image to find contour edge. The contour edge can describe the shape properties of object and finally the position of object can be derived. Currently, there are many researches in traffic sign segmentation and recognition that using several algorithms. Amplitude segmentation methods is the simplest method to separate the region of traffic sign using a proper threshold value, but the result is not good since the intensity of image and background are similar. Boundary detection method (4) is rather be popular and get good efficiency result of image segmentation is edge detection. This method takes quite a long time in processing, because after obtaining edge contour, the next step is to find the arbitrary shape in image.
Table 1. Traffic Sign
Different categories of traffic signs from GTSRB. Image
Traffic Sign
Types
Types
Speed limit
Speed limit
(30 km/h)
(120 km/h)
Speed limit
No overtaking
Image
(50 km/h)
Speed limit
No overtaking
(60 km/h)
by lorries
Speed limit
Right of way
(70 km/h)
at the next crossroads
2. Related Work
Speed limit
Priority road
(80 km/h)
Many methodologies and researches have been proposed for traffic sign classification system. Sekanian et al.(5) proposed the detection of Norwegian speed limit signs. They design for 3 steps. Color classification using HSV color space, position detection of speed limit sign using template matching, and speed limit number recognition using neural network. Liu et al. (6) proposed vision-based stop sign detection and recognition systems for intelligent vehicle based on HSV color space, size analysis, and ratio of traffic sign. They used neural network technique in recognition process. Huda et al.(7)proposed real-time detection and recognition of Indian traffic signs using matlab. They also used gaussian filter and median filter to remove noise in image and used YCbCr color space in segmentation process. In the next step they used feature extraction before classification and recognition using multi-layer perceptron neural network method. Another method has also been proposed by Surinwarangkoon et al. (8) based on thresholding. They use RGB color space in segmentation process. They also use feature selection before classification process in traffic sign recognition system in poor condition.
Speed limit
Give way
(100 km/h)
(GTSRB). The dataset used in our experiment contains 360 images, which are separated into 12 categories. There are mainly 3 shapes of traffic signs in our experiment such as circle, square, and triangle. Short distance photos were taken in shady, normal and bright light conditions by camera for every image. The size of the traffic signs were normalized to 80 X 80 pixels for size testing of signs. Different category of traffic signs from GTSRB are shown in Table 1.
4. Materials and Methods 4.1
Canny Edge Detection
In this paper we use canny edge detection to compute gradient direction of image. Canny edge detection enhances the image using smoothing process by Gaussian filter to blur image for eliminating noises in image. Then compute the gradient magnitude and gradient orientation using first-order derivative. Next step is to use non-maxima suppression and gradient magnitude to find thinnest contour. The last step is to use double thresholding algorithm to specify contour pixels and make the contour continuously. Noise reduction is the first step using Gaussian filter.
3. Characteristics of Traffic Sign Since traffic signs provide important information for driver about caution and hazard, their color and shape are chosen by traffic authorities to make them easy to understand by humans. In this paper, we selected traffic signs from German Traffic Sign Recognition Benchmark 53
(a)
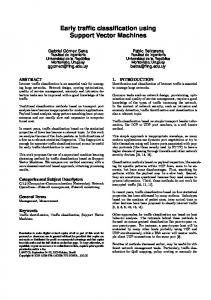
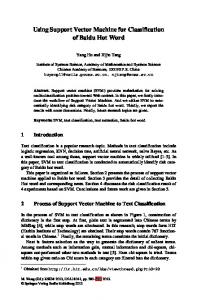
Fig. 1. Normal direction of edge pixel.
𝑄,𝑖, 𝑗- ≈ (𝑆,𝑖, 𝑗- − 𝑆,𝑖 + 1, 𝑗- + 𝑆,𝑖, 𝑗 + 1- − 𝑆,𝑖 + 1, 𝑗 + 1-)/2
(1)
𝑋𝑐 = 𝑥 + 𝑟 cos 𝜃 𝑌𝑐 = 𝑦 + 𝑟 sin 𝜃
(2) (3)
(4) (5)
Thus the normal direction of edge pixel can be compute in the process of Canny edge detection. These normal direction values are the feature extraction that has been used in image segmentation by support vector machine. Normal direction on each edge pixel shown in Fig.1. 4.2
(6) (7)
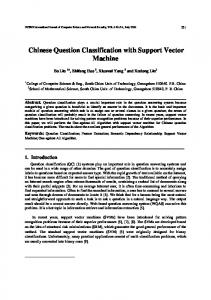
Where Xc and Yc are the possible center point of circle (range of Xc is 1 to image width, Yc is 1 to image height), x and y are edge pixel coordinate, r is radius of circle (range of r is 1 to half diagonal distance of image), and is possible angle when measure along x coordinate (0-360 degrees) as shown in Fig. 2. (b) Hough transform for line detection Line detection using Hough transform is the method for line detection in image. Every edge pixel in binary image was substituted in geometric line equation called Hough space to derive the maximum vote of each line. If there are 3 maximum votes and 3 intersection in Hough space the object is triangle. Likewise, if there are 4 maximum votes and 4 intersection in Hough space the objects is square.
In the final step P[i, j] and Q[i, j] can be compute by converting rectangular coordinates to polar coordinates to find the size and direction of gradient. 𝑀,𝑖, 𝑗- = √𝑃,𝑖, 𝑗-2 + 𝑄,𝑖, 𝑗-2 𝜃,𝑖, 𝑗- = arctan(𝑄,𝑖, 𝑗-, 𝑃,𝑖, 𝑗-
Line
for circle detection in image. Every edge pixel in binary image was substituted in geometric circle equation called Hough space to obtain a center of circle and radius in an image using maximum vote value of Xc, Yc, and r.
When smooth the image with noise reduction, the next step is to take the S[i, j] image to compute x, y partial derivatives P[i, j] and Q[i, j] respectively 𝑃,𝑖, 𝑗- ≈ (𝑆,𝑖, 𝑗 + 1- − 𝑆,𝑖, 𝑗- + 𝑆,𝑖 + 1, 𝑗 + 1- − 𝑆,𝑖 + 1, 𝑗-)/2
(b)
Fig. 2. Coordinate of circle and line.
Given that I[i,j] is the image which require edge contour, G[i,j, ] is Gaussian smoothing filter, and is the variable to control the distribution of smoothing. The smoothing process is as follows: 𝑆,𝑖, 𝑗- = 𝐺,𝑖, 𝑗, 𝜎- ∗ 𝐼,𝑖, 𝑗-
Circle
𝑑 = 𝑥𝑐𝑜𝑠𝜃 + 𝑦 sin 𝜃
(8)
Where d is distance from the origin point when perpendicular measuring from specific line, is possible angle (0-360 degrees) of line when dragging from origin point to perpendicular with line along x coordinate, x and y are coordinates of edge pixel as shown in Fig. 2.
Region of Interest (ROI)
Region of Interest is the method to crop the specific region of object in the image by eliminating background. ROI can be obtained by using binary edge contour image to find the position of circle, triangle, and square in image. The Hough transform is the algorithm to find the position of object. Since this paper uses 3 shapes of traffic sign, thus 2 methods of Hough transform algorithm were used to find sign position: Hough transform for circle detection and Hough transform for line detection to detect triangle and square. (a) Hough transform for circle detection Circle detection using Hough transform is the method
4.3
Support Vector Machine (SVM)
In this section we introduce some basic concepts of SVM and different types of kernel function. (a) Overview of SVM Support vector machine is supervised machine learning algorithm used for classification and regression problems by generating the optimal separation hyperplane in a multi-dimensional space. The basic idea 54
Linear kernel: 𝐾 (𝑥𝑖 , 𝑥𝑗)= 𝑥𝑖 𝑥𝑗 w
(w . x)
+b
=0
(w . x)
(w .
(O
+b
Polynomial kernel: x)+ b= -1
pt im al =1
(11)
hy pe rp la
𝐾(𝑥𝑖, 𝑥𝑗 ) = (𝛾 𝑥𝑖 𝑥𝑗 + 𝑟)𝑑 ,
𝛾>0
(12)
𝐾(𝑥𝑖 , 𝑥𝑗 ) = exp(−𝛾‖𝑥𝑖 − 𝑥𝑗 ‖2) , 𝛾 > 0
(13)
RBF kernel: ne )
Sigmoid kernel: 𝐾(𝑥𝑖 , 𝑥𝑗 ) = tanh 𝛾 𝑥𝑖 𝑥𝑗 + 𝑟)
(14)
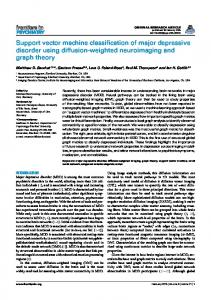
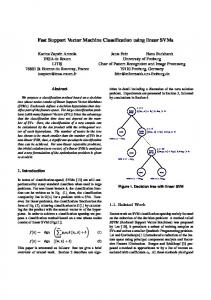
Fig. 3. Optimal hyperplane with maximum margin. Here, 𝛾, r and d are kernel function parameters. of SVM is to find the optimal hyperplane to separate datasets. Two parallel hyperplanes are constructed on each side of the hyperplane that separate the data. The separating hyperplane is the hyperplane that maximizes the distance between the two parallel hyperplanes. An assumption is made that the larger of margin or distance between these parallel hyperplanes, the better of classification as shown in Fig. 3. We consider 2 datasets of the form 𝐷 = * (𝑥1 , 𝑦1 ), … , (𝑥𝑙 , 𝑦𝑙 ) +, 𝑥𝑖 ∈ 𝑅𝑚 , 𝑦𝑖 ∈ *−1, 1+
5. Proposed Work A framework of proposed work for segmentation and classification of traffic sign is shown in Fig. 4. The main stages of our implementation are: image pre-processing using edge detection, image pre-processing using Hough transform to get region of interest (ROI), and classification process using support vector machine with different kinds of kernel functions.
(9) 5.1
Where l denote the amount of dataset, i denote the sequence of data, m is number of dimensions, and y is classification result consisting of +1 and -1 to denote each group of dataset after separation process. If the training data are linearly separable, we consider the dataset by specifying x1 to be data of xi and value is positive. Likewise x2 is data of xi and value is negative. This can be written as
using
Canny
Edge
In Canny edge detection process; the first step is to decrease the dimensions of color space by converting color image to gray scale image to the remaining of only 256 colors, since much color is not necessary to find edge. Then the Canny edge is detected from gray scale image, as shown in Fig. 5 5.2
(𝑤 ∗ 𝑥1 ) + 𝑏 > 0 where, yi = +1 (𝑤 ∗ 𝑥2 ) + 𝑏 < 0 where, yi = -1
Image Pre-processing Detection
Image Pre-processing using Region of Interest
(10) In the process to finding region of interest (ROI) by eliminating background, there are two main steps to detect region of traffic sign: convert color image to gray scale image and edge detection using canny edge detection, because it can remove noise from image by blurring to improve the quality of edge image. After that, the edge image is then sent to Hough transform to detect circle, triangle, and square. So, we can obtain the region of interest of traffic sign and then in the final step, region of interest has been sent to classification process using support vector machine as shown in Fig. 6.
Where w denotes weight of vector, x1 is positive data vector, x2 is negative data vector, and b denotes bias value. (b) Kernel Function of SVM Training vectors can be represented in a higher dimensional space. There are many kernel functions available in SVM. So how to select an optimal kernel function is also a research problem. However, for general purpose, there are some popular kernel functions:
55
Traffic Sign Image
Grayscale Image
Traffic sign color image
Canny Hough Transform
Region of Interest (ROI)
Color to gray scale
Select normal direction from canny edge that corresponding with ROI
Normal direction feature
Canny edge detection
Max vote from Hough space SVM(linear kernel)
SVM(poly kernel)
SVM(RBF kernel)
SVM(sigmoid kernel)
Compare Result between Original image, ROI and, Normal direction feature
Circle and line detected
Fig. 4. A framework of proposed work. Region of Interest (ROI)
Example
Fig. 6. Find ROI using Hough transform.
Result of Canny edge
Fig. 5. Canny edge image.
5.3
Fig. 7. Normal direction feature on every edge pixel.
Feature Extraction
models were trained from 270 images. In classification evaluation process, 90 images were used for testing. These tested images had been performed with image processing steps the same as those in the training process. Finally, we use 4 kernels functions (Linear, Polynomial, Sigmoid, and RBF) in SVM classification process.
After we obtained the edge image we also obtained the normal direction feature. The normal direction of gradient or normal vectors are derived from the line that drags to touch every edge pixel from edge image which we call tangent vector, and then draw the perpendicular line with tangent vector. We will get the normal direction degree when measure angle along x axis. The normal direction in every edge pixels are the feature that will use in SVM classification process. Because normal direction feature can represents the shape and curve of object in degree of angles (0-360). Normal direction feature is shown is Fig.7. 5.4
6. Experimental Results In this paper, we use 360 images from 12 categories and 3 different shapes such as circle, triangle, and square. We use Matlab for pre-processing images and Pyhon 2.7 use for the classification process. SVM is the efficiency method that has been widely used for classification and we also use 4 kernel functions in classification process as shown the experimental results in Table 2. Linear kernel function gives rather high accuracy when
SVM Classification
In SVM training process, we have 3 models for training images including original images that are converted to gray scale, ROI and, ROI with normal direction feature. All 3 56
Table 2. Classification results for each method.
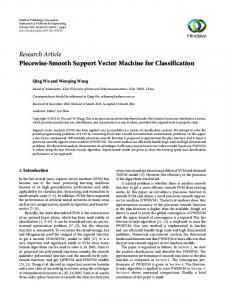
compared with other kernel functions. The accuracy rates are ranging between 67.80% - 88.60%. But original image gives low accuracy. Polynomial kernel function obtains medium accuracy between 46.70% - 54.50%. Original image gives low accuracy for this kernel function. RBF and sigmoid kernel function get very low accuracy in all methods of pre-processing image. The accuracy rates are between 4.40% - 28.70%. The accuracy of classification when using ROI with linear kernel function is 73% and the accuracy of classification when using ROI with normal direction feature is 88.60%. The results of Polynomial , RBF and Sigmoid kernel functions are rather low as shown in Table 2. In Table 2, we found that the classification accuracy of linear kernel function with region of interest (ROI) and region of interest with normal direction feature techniques is rather good on 3 methods of image pre-processing. Accuracy of original image is 67.80%, ROI 73% and, ROI with normal direction feature 88.60%. A comparative graph of classification accuracy using image pre-processing techniques with 4 kernel functions is shown in Fig. 8.
SVM
Original
ROI
Normal
Accuracy
Accuracy
Accuracy
direction
Train
Test
Train
Test
Train
Test
Linear
1.000
0.678
1.000
0.730
1.000
0.886
poly
1.000
0.467
1.000
0.511
0.958
0.545
RBF
1.000
0.067
1.000
0.067
1.000
0.365
Sigmoid
0.960
0.044
0.096
0.044
0.0975
0.287
1 0.9 0.8 0.7 0.6 0.5 0.4 0.3 0.2 0.1 0
Linear Poly RBF Sigmoid Original
ROI
ROI with Normal direction
Fig. 8. Accuracy of classification using image.
7. Conclusions In future work, we will mainly focus on improving the efficiency of the traffic sign segmentation and classification in order to use other information in image such as texture feature and morphological features. We will also apply feature extraction and feature selection before classification process to improve accuracy and reduce misclassification data.
Traffic signs classification using support Vector machine and image segmentation is the main contribution presented in this paper. The image segmentation algorithm namely region of interest (ROI) and region of interest (ROI) with normal direction feature using SVM linear kernel function is quite efficient for classification. It can improve the accuracy of classification from 67.80% to 73% and 88.60%; the increase is about 5% and 20.8%. This increase is due to the fact that ROI will crop image only the region of traffic signs and eliminate the unnecessary background. We also use feature extraction with normal direction and bring the results to compare with ROI and original image. The accuracy of original image when used in classification process is not good. We found that the classification result using original image get low accuracy because original image consists of noisy background. On the other hand, ROI and ROI with normal direction feature are the gray scale image which has possible 256 intensity values, and we crop the specific region of traffic sign and also eliminate noisy background from image. Hence, ROI and ROI with normal direction feature when using with SVM linear kernel function already shows good accuracy in terms of segmentation and classification.
Acknowledgment Financial assistance for Kedkarn Chaiyakhan has been provided by a scholarship from Rajamangala University of Technology Isan, Nakhorn Ratchasima, Thailand.
References (1) G. Piccioli, E. De Micheli, P. Parodi, and M. Campani : “A robust method for road sign detection and recognition”, Image and Vision Computing, Vol. 14, No. 1, pp. 209-223, 1996 (2) X. W. Gao, L Podladchikova, D. Shaposhnikov, K. Hong, and N. Shevtsova : “Recognition of traffic signs based on their colour and shape features extracted
57
(3)
(4)
(5)
(6)
(7)
(8)
using human vision models”, Journal of Visual Communication and Image Representation, Vol. 17, pp. 675-685, 2006 A. de la Escalera, L. E. Moreno, M. A. Salichs, and J. M. Armingol : “Road traffic sign detection and classification”, IEEE Transactions on Industrial Electronics, Vol. 44, pp. 848-859, 1997 T. Surinwarangkoon, S. Nitsuwat, and E. J. Moore : “Traffic sign recognition by color filtering and particle swarm optimization”, 4th International Conference on Computer Research and Development, pp. 55-59, 2012 L. Sekanina, and J. Torrensen : “Detection of Norwegian Speed Limit Signs”, In Proc. Of the 16th European Simulation Multiconference, pp. 337-340, 2002 X. Lui, and B. Ran : “Vision-based Stop Sign Detection and Recognition System for Intelligent Vehicle”, Journal of the Transportation Research Board, Vol. 1748, pp. 161-166, 2001 H. Dean, and Jabir : “Real Time Detection and Recognition of Indian Traffic Signs using Matlab”, International Journal of Scientific & Engineering Research, Vol. 4, pp. 684-690, 2013 T. Surinwarangkoon, S. Nitsuwat, and E. J. Moore : “Traffic Sign Recognition System for Roadside Images in Poor Condition”, International Journal of Machine Learning and Computing, Vol. 3(1), pp. 121-126, 2013
58