Training artificial neural networks using APPM Zhihua Cui*1,2 1
Complex System and Computational Intelligence Laboratory, Taiyuan University of Science and Technology, Shanxi, 030024, China 2 State Key Laboratory of Novel Software Techchnology, Nanjing University, 210093, China E-mail:
[email protected] *Corresponding author
Chunxia Yang Complex System and Computational Intelligence Laboratory, Taiyuan University of Science and Technology, Shanxi, 030024, China E-mail:
[email protected]
Sugata Sanyal School of Technology & Computer Science, Tata Institute of Fundamental Research, Homi Bhabha Road, Mumbai-400005, INDIA E-mail:
[email protected] Abstract: In order to train artificial neural networks, we used a new stochastic optimization algorithm that simulate the plant growing process. It designs two artificial photosynthesis operator and phototropism operator to mimic photosynthesis and phototropism mechanisms, we call it briefly with APPM algorithm. In this algorithm, each individual is called a branch, and the sampled points are regarded as the branch growing trajectory. Phototropism operator is designed to introduce the fitness function value, as well as phototropism operator is used to decide the growing direction. In this paper, we apply APPM algorithm to train the connection weights for artificial neural network (ANN). To assess the performance of our APPM-trained ANN (APPMANN), two real-world problems which named Cleveland heart disease classification problem and sunspot number forecasting problem are adopted. Simulation results show that APPMANN increases the performance significantly when compare with other sophisticated machine learning techniques proposed in recent years. Keywords: Photosynthesis operator; phototropism operator; ANN Reference to this paper should be made as follows: Zhihua Cui, Chunxia Yang and Sugata Sanyal, (2012) ‘Training artificial neural networks using APPM’, Int. J. Wireless and Mobile Computing, Vol. 1, Nos. 1/2/3, pp.64–74. Biographical notes: Zhihua Cui is Associate Professor in the School of Computer Science and Technology at Taiyuan University of Science and Technology, China. He received his PhD in System Engineering from Xian Jiaotong University in 2008. He is the Editor-in-Chief of International Journal of Bio-Inspired Computation.His current research interests are in swarm intelligence and bio-inspired algorithms. He has published nearly 60 international journal and conference papers. Chunxia Yang is a master student in Taiyuan University of Science and Technology, P.R.China. Her research topics are particle swarm optimization and its applications. Sugata Sanyal is a Professor in the School of Technology & Computer Science at the Tata Institute of Fundamental Research (http://www.tifr.res.in/ sanyal). In the early phase of his career, Sugata was involved in huge developmental projects, designing Rugged Micro programmed Computers and Fault-Tolerant Computerized systems. He has worked in diverse areas of Computer Architecture, Parallel Processing, Fault Tolerance and Coding Theory and in the area of Security. Sanyal is in the Editorial Board of many International Journals, and is collaborating with scientists from India and abroad.
1
INTRODUCTION
With the developments of industry and economics, many new problems are suggested in which much of them are with non-differential, multi-modal and high-dimensional. To solve these problems, scientists propose the stochastic optimization methods. Up to now, many optimization algorithms are designed such as genetic algorithm, artificial physics optimization(Xie L P, Tan Y, Zeng J C and Cui Z H, 2010), social emotional optimization algorithm(Z.H.Cui and X.J.Cai, 2010) and firefly algorithm(Yang X S, 2010). The most well known examples are particle swarm optimization (PSO)(Eberhart, R. and Kennedy, J., 1995) and ant colony optimization (ACO)(Kennedy, J. and Eberhart, R., 1995). Particle swarm optimization(Chen S, Hong X, Luk BL and Harris CJ, 2009) (Senthil Arumugam M, Ramana Murthy G and Loo CK, 2009) (Parsopoulos KE and Kariotou F, Dassios G, Vrahatis MN, 2009) mimics the behavior of fish schooling and bird flocking. PSO is a populationbased stochastic optimization strategy with fast convergent speed than general evolutionary algorithms (EAs). Different from EAs, each particle employs not only position information, but also the velocity information. They communicate good positions to each other and adjust their own positions according to their decision. Ant colony optimization is a probabilistic technique for solving computational hard problems which can be reduced to finding optimal paths. The main idea is the indirect communication between the ants by means of chemical pheromone trails. Although there are still many new swarm intelligent algorithm inspired other phenomenons, however, none of them consider the plant growing phenomenon. Recently, a new evolutionary algorithm inspired by plant growing process is designed by Zhihua Cui which contains two artificial photosynthesis operator and phototropism operator to mimic photosynthesis and phototropism mechanisms, and is called APPM briefly (??Zhihua Cui and Xingjuan Cai, 2011Chunxia Yang and Zhihua Cui, 2011). In this paper, we apply APPM to train the artificial neural network (APPMANN). The process of ANN weight training can be regarded as a hard continuous optimization problem, since the search space is high-dimensional multi-modal and is usually polluted by noises and missing data(S. He, 2010). The APPM trained ANN (APPMANN) is then applied to two machine learning benchmark problems - Cleveland heart disease data set and sunspot forecasting problem. The rest of this paper is organized as follows: We present the APPM algorithm in Section 2. In Section 3, the APPMANN will be introduced and the details of implementation will be given. As well as in section 4, we describe the experimental settings and the experimental results. Conclusion will be given in the final section. c 200x Inderscience Enterprises Ltd. Copyright °
2
2.1
APPM
Main Method
To simulate the plant growth phenomenon, one important issue is how to simulate this process in APPM. Since light intensity guides the plant growing direction, suppose the photosynthesis provides all necessary energies, then light intensity can be viewed as the fitness value which guides the search direction in the problem space. Furthermore, for one virtual branch, the search strategy can also be regarded as the growing trajectory. More comparing details can be found in Tab.1. Because this new algorithm simulates the growing patten of plants by incorporating photosynthesis and phototropism mechanism, we call it briefly with APPM algorithm. Table 1: Similarity between Plant Growing Process and Optimization Problem problem search space iteration global optimum fitness value point position update
2.2
plant environment growing period highest light intensity light intensity branch branch growth
Photosynthesis Operator
Photosynthesis is a process that converts carbon dioxide into organic compounds, especially sugars, using the energy from sunlight(Smith A L, 1997). Photosynthesis occurs in plants, algae and many species of bacteria, but not in archaea. Photosynthetic organisms are called photoautotrophs, since they can create their own food(Bryant D A and Frigaard N U, 2006). In plants, algae and cyanobacteria, photosynthesis uses carbon dioxide and water, releasing oxygen as a waste product. Photosynthesis is vital for all aerobic life on Earth. As well as maintaining the normal level of oxygen in the atmosphere, nearly all life either depends on it directly as a source of energy, or indirectly as the ultimate source of the energy in their food(the exceptions are chemoautotrophs that live in rocks or around deep sea hydrothermal vents). The rate of energy capture by photosynthesis is immense, approximately 100 terawatts(Nealson K H and Conrad P G, 1999), which is about six times larger than the power consumption of human civilization. As well as for energy, photosynthesis is also the source of the carbon in all the organic compounds within organisms’ bodies. In all, photosynthetic organisms convert around 100C115 teragrams of carbon into biomass per year(Field C B, Behrenfeld M J, Randerson J T, and Falkowski P, 1998). Because the fitness value of each branch represents the light intensity, therefore, to avoid the confusion, a predefined range [0, 1] is needed, in this paper, the following
equation is designed to refine this range: Scoreu (t) =
fworst (t)) − f (xu (t)) fworst (t)) − fbest (t))
(1)
where fworst (t) and fbest (t) are the worst and best original light intensity at time t, respectively, f (xu (t)) denotes the branch u0 s original light intensity (fitness value). Photosynthetic rate plays an important role to measure how much energy produced. Up to date, many models have been proposed, such as rectangular hyperbolic model and non-rectangular hyperbolic model(Piao Y Z and Qiang Y, 2007). As the most important model, rectangular hyperbolic model has been successfully applied widely to simulate the photosynthetic rate. Therefore, in this paper, rectangular hyperbolic model is employed to measure the obtained energy for each branch:
Fu (t) denotes the growing force guided by photosynthetic rate, rand() represents a random number sampled with uniformly distribution. For each branch u, Fu (t) is computed by Fu (t) =
Futotal (t) ||Futotal (t)||
(4)
where || · || means the Euclidean distance, Futotal (t) is computed as follows: X Futotal (t) = Fu,j (t) (5) j6=u
and
(
Fu,j (t) =
0, if ||xu (t) − xj (t)|| = 0 , −dim·P Rj (t) −e−dim·P Ru (t) coe · e ||xu (t)−xj (t)||
, otherwise. (6) αScoreu (t)Pmax P Ru (t) = − Rd (2) where dim represents the problem dimensionality, coe is a αScoreu (t) + Pmax parameter used to control the movement direction: ½ where P Ru (t) represents the photosynthetic rate of branch 1, if f (xu (t)) > f (xj (t) , coe = (7) u at time t, Scoreu (t) denotes the light intensity, α is the −1 , otherwise. initial quantum efficiency, Pmax is the maximum net photosynthesis rate, and Rd is the dark respiratory rate. α, Furthermore, a small probability pm is introduced to Pmax and Rd are three parameters to control the size of reflect some random events affection: photosynthetic rate. According to the corresponding refxu (t) = L + (U − L) · rand1 (), if (rand2 () < pm) (8) erencesPiao Y Z and Qiang Y, 2007), they are set to 0.055, 30.2, 1.44, respectively. where L and U are the lower and upper bounds in the probIn each iteration, all branches grow with obtained energy lem space, rand1 () and rand2 () are two random numbers from photosynthesis according to the above equation. with uniform distribution, respectively. 2.3
Phototropism Operator
Phototropism is directional growth in which the direction of growth is determined by the direction of the light source. In other words, it is the growth and response to a light stimulus. Phototropism is most often observed in plants, but can also occur in other organisms such as fungi. The cells on the plant that are farthest from the light have a chemical called auxin that reacts when phototropism occurs. This causes the plant to have elongated cells on the farthest side from the light. Phototropism is one of the many plant tropisms or movements which respond to external stimuli. Growth towards a light source is a positive phototropism, while growth away from light is called negative phototropism (or Skototropism). Most plant shoots exhibit positive phototropism, while roots usually exhibit negative phototropism, although gravitropism may play a larger role in root behavior and growth. Some vine shoot tips exhibit negative phototropism, which allows them to grow towards dark, solid objects and climb them. Because each branch will be attracted by those position with high light intensities, therefore, in iteration t, branch u takes the following movement:
2.4
The Steps of APPM
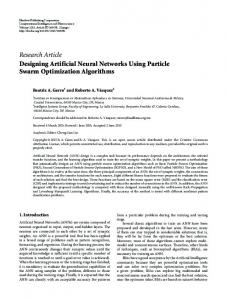
The steps of APPM is listed as follows (see also in Figure 1): Step1. Initializing the position vectors of each branch, and determining the historical best positions of light intensity; Step2. Determining the best and worst light intensity at time t with the following definitions. fbest (t) = min{f (xj (t)), j = 1, 2, ..., s}
(9)
fworst (t) = max{f (xj (t)), j = 1, 2, ..., s}
(10)
and
and calculating the score of each branch at time t. Step3. Determining the photosynthetic rate according to Eq.(2); Step4. Updating the position vectors of each branch according to Eq.(3)-(8); Step5. Determining the current personal memory (historical best position with high light intensity) of each branch; Step6. Determining the historical highest light intensity xu (t) = xu (t − 1) + Gp · Fu (t) · rand() (3) of the swarm; where Gp is a parameter reflecting the energy conversion Step7. If the stop criteria is satisfied, output the best rate and used to control the growing size per unit time. solution; otherwise, go step 2.
Figure 2: The processing unit
Figure 3: Multi-Layered Neural Network
Figure 1: Code of APPM
3
THE APPM BASED TRAINING ALGORITHM
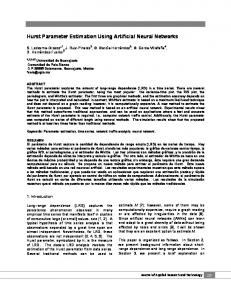
It consists of one input layer, one output layer and hidden layer. It may have one or more hidden layers. The outputs are nonlinear function of inputs, and are controlled by weights that are computed during learning process. In this study, the ANN we employed consists one hidden layer. The activation functions of each layer use Log-Sigmoid function.
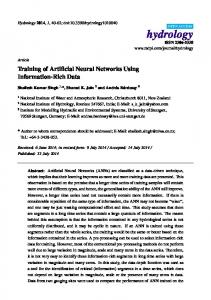
Artificial Neural Network (ANN) is basically as implied model of the biological neuron and uses an approach simThe error signal for the pth neurons of output layer is ilar to human brain to make decisions and to arrive at e (n) = dkp (n) − ykp (n), and the energy errors of the pth kp conclusions(Boryczka M and Slowinski R, 1988). Every 1 2 is ekp (n), then sum of the energy errors for all the neural 2 neuron model consists of a processing element with synapnetwork output layer are tic input connections and a single output. The structure of a neural network of most commonly used type is schematically shown in Figure 2. The neuron can be defined as P 1X 2 E(n) = e (n) (12) 2 p=1 kp n X y = f (W × X + θj ) = f ( ωij xi − θj ) (11) i=1
where, x is input signals, ωij is synaptic weights of neuron, This least-squared error function is used as the fitness f is the activation function and y is the output signal of function in APPMANN. We used the APPM algorithm neuron. The architecture of multi-layered neural network to optimize the connection weights and bias terms of the is shown in Figure 3. ANN.
4
EXPERIMENTAL STUDIES
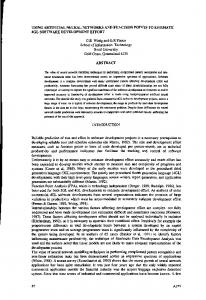
the instances without heart disease in each set is the same as 4:5. In order to evaluate APPM’s performance, APPMANN Table 2 compares APPMANN’s result against those was applied to two real-world problems. Firstly, we use ANNs trained by other algorithms. We could find that one well-studied benchmark function from the UCI ma- APPMANN generated the best average result in terms of chine learning repository, Cleveland heart disease classifi- testing error rate. cation data. There are missing attribute values in the data sets of the Cleveland heart disease classification problem. 4.2 Sunspot forecasting problem Secondly, we also solve one forecasting problem, the sum sport number forecasting problem. The sunspot forecast- The sunspot is the most basic and obvious kind of solar ing problem is a chaotic time series. Therefore, they rep- activities which occurs on the photosphere layer of the resent some of the most challenging problems in the ANN sun. Generally speaking, the sunspot is actually the huge and the machine learning field (Yao X and Liu Y, 1999). maelstrom of intensely hot gas on the solar surface, its To show the effectiveness of APPMAPP, we also imple- temperature is about 4500 Celsius degrees. Because this mented a standard GSO training algorithm (SGSOANN); temperature is 1000-2000 Celsius degrees lower than the a modified back-propagation training algorithm: gradi- temperature of solar photosphere layer’s surface(the tement descent with momentum and adaptive learning rate perature of solar photosphere layer’s surface is about 6000 (BPANN); and four training algorithm based on EAs: 1) Celsius degrees), so the sunspot looks like some spots of Simple Genetic Algorithm (SGA); 2) Evolutionary Pro- deep dark colors. The sunspot is seldom move alone, it gramming (EP); 3) Evolution Strategies (ES); 4) Particle is usually in groups to appear. The sunspot activity is Swarm Optimization (PSO). Although the APPM is pro- cyclical, its cycles is about 11 years. It would impact on posed recently, it is not fair to compare the results of APP- magnetic field while being active, mainly is make the air MANN to those of other sophisticated ANNs, then we will current of South and North Pole and equator make radial compare the results we have obtained with the latest paper flow in thus creates heavy weather, causes the climate to transfer coldly, seriously will bring damage to each kind published in the literature. The maximum epoches is set as the number of members of electron product and electric appliances. Therefore, it in the population times 50. All experiments were repeated become more and more important to predict the sunspot especially in our modern world. 30 runs in order to get average results. The Cleveland Heart Disease Data Set
This data set comes from the Cleveland Clinic Foundation and was supplied by Robert Detrano of the V.A. Medical Center, Long Beach, CA. The goal of this data set is to predict the presence of heart disease in the patient. This database contains 76 attributes, but all published experiments refer to using a subset of 14 of them. And one of these attributes has demonstrated patient’s condition, it is integer valued from 0 (no presence) to 4. Experiments with the Cleveland database have concentrated on simply attempting to distinguish presence (values 1,2,3,4) from absence (value 0). The database originally contained 303 instances but 6 of them had missed some values and 27 of the remains were still in case of dispute. Since handling the missing attribute values is out of the scope of this paper, we remove the instances with missing attribute values in the data set, leaving a final total of 270 which includes 120 instances with heart disease and 150 instances without heart disease. According the guidelines of Prechelt (L. Prechelt, 1995), in the Cleveland heart disease classification problem, each set of data was divided into three sets: 50% of the patterns were used for learning, 25% of them for validation and the remaining 25% for testing the generalization of the trained ANN. So the 270 instances were partitioned into the training set of 134 instances, the validation set of 68 instances, and the testing set of the final 68 instances. To carry on the training well to the neural network, the ratio of the instances with heart disease to
200 180 160 140 Sunspot numbers
4.1
120 100 80 60 40 20 0 1700
1750
1800
1850
1900
1950
2000
2050
Year
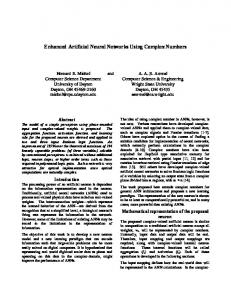
Figure 4: Sunspot cycles from 1700 to 2010 The data set used in our experiment recorded the sunspot activity over the last 300 years. The sunspot cycles from 1700 to 2010 are shown in Figure 4. To compare fairly with other methods, we used the first 180 year (1700-2010) as the training set to train the proposed APPMANN. Following (F. H. F. Leung, H. K. Lam, S. H. Ling, and P. K. S. Tam, 2003), the inputs xi of the APPMANN consists of three past data points: x1 = y1d (t − 1), x2 = y1d (t − 2),and x3 = y1d (t − 3), where t denotes the year and yid (t) denotes the sunspot number at the year t. The output is the prediction of the sunspot number at year t : yb1 (t). The performance (forecasting error rate) of the trained APP-
Training Set Mean SD Min Max 7.51 4.52 2.98 25.37 10.03 0.44 9.26 11.67 12.53 2.35 8.89 18.21 12.54 3.28 9.72 20.89 8.70 0.67 7.44 10.27 10.03 1.23 8.46 14.73 29.23 9.96 11.19 51.75
Method APPMANN SGSOANN SGAANN EPANN ESANN PSOANN BPANN
Validation Set Mean SD Min Max 7.71 2.53 2.97 12.87 12.66 0.70 11.51 14.52 17.88 4.21 12.04 34.07 17.86 7.37 11.97 46.33 15.49 3.55 11.28 28.52 13.65 1.18 11.55 16.40 30.56 10.02 11.76 54.70
Test Set Mean SD Min 13.82 3.72 4.41 14.51 1.48 11.76 20.88 5.04 14.71 21.37 8.43 13.24 16.86 3.08 10.29 16.08 3.30 11.76 43.28 17.64 13.24
Max 20.58 17.65 33.82 45.58 23.53 25.00 77.94
Table 2: Error rate of ANNs of the Cleveland heart disease data set. MANN can be calculated from: err =
1980 X
(|
t=1885
y1d (t) − yˆ1 (t) |) 96
(13)
Province Natural Science Foundation of China under Grant No.2011011012-1 and the Program for the Top Young Academic Leaders of Higher Leaning Institutions of Shanxi.
We tabulated the results of training errors and forecasting errors in Table 3. We can see that APPMANN genREFERENCES erated the best mean forecasting error. Simulation results of the 96-year prediction using APPMANN and the actual Eberhart, R. and Kennedy, J. New optimizer using parnumbers are shown in Figure 5. ticle swarm theory. Proceedings of the Sixth International Symposium on Micro Machine and Human Sci10 ence, IEEE CS Press, (1995)Nagoya, Japan, pp.39-43. actual numbers 3
prediction
Kennedy, J. and Eberhart, R. Particle swarm optimization. Proceedings of ICNN’95 - IEEE International Conference on Neural Networks, IEEE CS Press, (1995)Perth, WA, Australia, pp.1942-1948.
Sunspot numbers
2
10
1
10
0
10 1880
1900
1920
1940
1960
1980
Chen S, Hong X, Luk BL and Harris CJ. Non-linear system identification using particle swarm optimisation tuned radial basis function models. International Journal of Bio-Inspired Computation, Vol.1, No.4, pp.246258.(2009)
Year
Figure 5: Comparison between forecasting results and the actual numbers
Senthil Arumugam M, Ramana Murthy G and Loo CK. On the optimal control of the steel annealing processes as a two-stage hybrid systems via PSO algorithms. International Journal of Bio-Inspired Computation, Vol.1, No.3, pp.198-209.(2009)
Parsopoulos KE and Kariotou F, Dassios G, Vrahatis MN. Tackling magnetoencephalography with particle swarm optimization. International Journal of BioIn this paper, APPM algorithm is applied to train the conInspired Computation, Vol.1, Nos.1/2, pp.32–49.(2009) nection weights and bias terms of artificial neural networks. To show the performance, the heart disease classification Xie L P, Tan Y, Zeng J C and Cui Z H. Artificial physics optimisation: a brief survey. International Jourand sunspot forecasting problems were used to evaluate. nal of Bio-inspired Computation, vol.2, no.5, pp.291Compared with the other implemented ANNs, APPMANN 302.(2010) yields the best average classification and forecasting results on the two real-world problems. Z.H.Cui and X.J.Cai. Using social cognitive optimization algorithm to solve nonlinear equations. Proceedings of Acknowledgement 9th IEEE International Conference on Cognitive InThis paper was supported by National Natural Science formatics (ICCI 2010), July 7-9, Tsinghua University, Foundation of China under Grant No.61003053, Shanxi (2010)beijing, China, pp.199-203. 5
CONCLUSION
Method APPMANN SGSOANN SGAANN EPANN ESANN PSOANN BPANN
Training Set Mean SD Min Max 10.60 0.45 10.07 11.42 12.34 0.28 11.92 13.02 13.41 0.91 11.89 15.17 13.22 0.49 12.53 14.52 12.52 0.55 11.64 13.55 11.88 0.23 11.53 12.44 13.36 1.17 11.79 16.22
Test Set Mean SD Min 13.32 0.71 12.39 13.37 0.53 12.40 16.68 7.46 11.83 14.77 1.73 12.05 14.22 1.05 12.64 13.55 0.75 12.22 14.40 0.90 12.79
Max 14.59 14.62 43.76 22.60 16.34 15.59 16.17
Table 3: Error rate of ANNs of the sunspot forecasting problem. Yang X S. Firefly algorithm, stochastic test functions Zhihua Cui, Xingjuan Cai and Jianchao Zeng. (2012) A and design optimisation. International Journal of Bionew stochastic algorithm to direct orbits of chaotic sysinspired Computation, vol.2, no.2, pp.78-84.(2010) tems. International Journal of Computer Applications in Technology. Yao X and Liu Y. A new evolutionary system for evolving artificial neural networks. IEEE Transactions on Neural Zhihua Cui and Xingjuan Cai. (2011) A new stochastic algorithm to solve Lennard-Jones clusters, Proceedings Networks, 8(3):694-713. (1999) of 2011 International Conference of Soft Computing and S. He. Training artificial neural networks using Lvy group Pattern Recognition (SoCPaR2011), pp.528-532. search optimizer. Journal of Multiple-Valued Logic and Chunxia Yang and Zhihua Cui. (2011) Solving redundancy Soft Computing. 16(6): 527-545.(2010) optimization problem with a new stochastic algorithm, Smith A L. Oxford dictionary of biochemistry and molecLecture Notes in Computer Science, Vol.7077, pp.132ular biology. Oxford University Press, Wellington(1997) 139. Bryant D A and Frigaard N U. Prokaryotic photosynthesis and phototrophy illuminated. Trends in Microbiology, vol.14, no.11, pp.488-496.(2006) Nealson K H and Conrad P G. Life: past, present and future. Philosphical Transactions of the Royal Society, Part B, Biological Sciences, vol.354, no.1392, pp.192339.(1999) Field C B, Behrenfeld M J, Randerson J T, and Falkowski P. Primary production of the biosphere: integrating terrestrial and oceanic components. Science, no.281, no.5374, pp.237-40.(1998) Piao Y Z and Qiang Y. Comparison of a new model of light response of photosynthesis with traditional models. Journal of Shenyang Agricultural University, vol.38, no.6, pp.771-775. (2007) Boryczka M and Slowinski R. Derivation of optimal decision algorithms from decisiont ables using rough sets. Bulletin of the Polish Academy of Sciences:Series Technical Sciences, 1988,36,252-260.(1988) L. Prechelt.Problem1 - a set of neural network benchmark problems and benchmarking rules. Technical report, Fakultat fur Infromatik Universitat Karlsruhe, 76128 Karlsruhe, Germany. (1995) F. H. F. Leung, H. K. Lam, S. H. Ling, and P. K. S. Tam. (Jan. 2003). Tuning of the structure and parameters of a neural network using an improved genetic algorithm. IEEE Transactions on Neural Networks, 14(1):79C88.