WSEAS TRANSACTIONS on BUSINESS and ECONOMICS
Luca Di Persio, Oleksandr Honchar
Training neural networks for financial forecasting: Backpropagation vs Particle Swarm Optimization Oleksandr Honchar University of Verona Department of Computer Science Strada le Grazie, 15 - Verona Italy
[email protected]
Luca Di Persio University of Verona Department of Computer Science Strada le Grazie, 15 - Verona Italy
[email protected]
Abstract: Neural networks (NN) architectures can be effectively used to classify, forecast and recognize quantity of interest in, e.g., computer vision, machine translation, finance, etc. Concerning the financial framework, forecasting procedures are often used as a part of the decision making process in both trading and portfolio strategy optimization. Unfortunately training a NN is in general a challenging task mainly because of the high number of parameters involved. In particular, a typical NN is based on a large number of layers, each of which may be composed by several neurons , moreover, for every component, normalization as well as training algorithms, have to be performed. One of the most popular method to overcome such difficulties is represented by the so called back propagation algorithm. Other possibilities are represented by genetic algorithms, and, in this family, the swarm particle optimization method seems to be rather promising. In this paper we want to compare canonical backpropagation and the swarm particle optimization algorithm in minimizing the error on surface created by financial time series, particularly concerning the task of forecast up/down movements for the assets we are interested in. Key–Words: Artificial neural networks, Multi-layer neural network, Backpropagation, Particle Swarm Optimization, Stock markets, Time series analysis, Financial forecasting. AMS classification: 62M45, 62F86, 68T05, 68T42, 91G60, 91G70
1
Introduction
functions can approximate almost any function with corresponding hyperparameters, see, e.g., [7, 9, 15] It is worth to mention that aforementioned approach has to be consider with a certain care. In particular, learning from past history is in general ill-posed method. In fact, a good forecasting model has to be sufficiently flexible to merge past infos with newer ones. This allows to realize an adaptive way of prediction. Concerning the latter issue, ANNs showed they power in some applications to time series, in particular to financial time series, see, e.g., [8, 13], mainly being backpropagating trained, by mean of classic algorithm based on gradient descent optimization routine.
A general forecasting process aims at producing a set of outputs which are supposed to happen, with an estimated probability, in the future, the related mathematical prediction being based on set of values (time series) describing what has happened in the past. In the present article we mainly deal with historical financial data, assuming that the time series of daily close prices. We assume that some aspects of the past patterns also characterize present values influencing the future ones rather smoothly. Past relationships can then be discovered through study and observation. Such an approach is standard in classical financial engineering technical analysis when observing candlestick patters to predict bull or bear behaviour of a stock. The basic idea being to find an approximation of the map that relates input and output as to discover the implicit rules that influence future events. Artificial neural networks (ANN) architectures constitute an efficient tool to learn such a relation by exploiting time series of interest as set of training data, see, e.g., [1, 2, 4, 5, 11, 12], and references therein. It has been shown, that ANNs with non-linear activation
E-ISSN: 2224-2899
Swarm Intelligence (SI) originates from the study of natural creatures behaving as a swarm where individuals follow simple rules, whereas the whole swarm exhibits complex dynamics. SI based approaches argue against the view that individuals are isolated information-processing entities, while stressing the fact that intelligent dynamics are produced by the interaction among such individuals. Based on this idea, Particle Swarm Optimization (PSO) algorithm
597
Volume 13, 2016
WSEAS TRANSACTIONS on BUSINESS and ECONOMICS
Luca Di Persio, Oleksandr Honchar
has been shown to converge rapidly during the initial stages of a global search, see, e.g., [6], and references therein. Nevertheless, around global optimum, the search process becomes very slow. On the contrary, the gradient descending method can achieve faster convergent speed around global optimum, and at the same time, the convergent accuracy can be higher. In this paper we want to study the behaviour of ANN weights optimized by gradient descent, the PSO and their mixture, see, e.g., [3, 10], to find an optimal mix with respect to speed of convergence and accuracy of predictions. In particular we show how to use PSO to avoid ANNs bad performance in predicting local optimum, when trained with wrong hyper-parameters. The article is subdivided as follows: in Sec. 2 we specify the particular time series we have considered, also explaining the basic choices made with respect to the initialization of the ANNs approach; then in Sec. 4 we provide the detailed implementation of the proposed training algorithms, namely we specify the Output layer, both the Hidden layer N-1 and the Hidden layer N-2, and we describe the PSO approach; eventually, in Sec. 5 we summarize obtained results, while in the Appendix we give a pseudocode used to implement the PSO method.
2
the next day, resp. minute, is larger or smaller than the previous one, based on the last N , N ∈ N+ , days, resp. minutes, of observations. Then, from the ANNs point of views, we have to choose appropriate time window and prediction horizon during hyper parameter optimization stage. In our research we use return prices as more representative data with normalization for stock price movement forecasting problem. In particular, we normalized our time series to have zero mean and unit variance, making use of the sklearn library, see [14]. All existing time series have been splitted, accordingly to the latter, in train, 80%, resp. in test dataset, the remaining 20%. Moreover we use 10% of training set for hyper parameter optimization. After empirical tests on data, we can conclude that the best choice, for every element of the train data set, is to consider a normalized time series with length of N = 30. Based on such a subdivision, we want to predict the next day/minute transition [1; 0], if price goes up, resp. [0; 1] if it goes down.
3
Artificial neural networks
To describe ANNs we start with the definition of a computationally modelled neuron. Essentially it is a network of interconnected functional elements each of which has several inputs, but only one output. We can formalize it as follows
Data processing
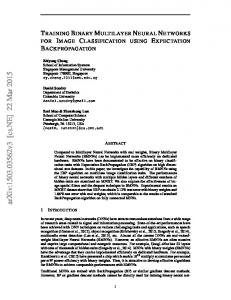
In what follows we focus our attention on the S&P500 index, exploiting related data from 1950 to 2016 (16706 data points). Usually stock market data looks like on Figure 1, which report the close prices for every days in the aforementioned time interval.
y(x1 , . . . , xn ) = f (w1 x1 +w2 x2 +. . .+wn xn ) , (1) where wi are parameters, f is the activation function, that is usually assumed to be non-linear as a sigmoid, or as rectified linear unit (ReLU). In this setting a relevant role is played by the Single-Layer Perceptron architecture, characterized by n inputs and one output, and formally defined as follows y(x1 , . . . , xn ) = f (w1 x1 + . . . + wn xn ) .
(2)
To gain flexibility in learning the decision hyperplane, we add a bias term w0 to the product sum: y(x1 , . . . , xn ) = f (w0 + w1 x1 + . . . + wn xn ) , (3) which implies the implementation of a simple algorithm mainly inspired by biological neural system. It is worth to mention that the latter can learn some functions, but still has limited capabilities. A multilayer perceptron is then defined by connecting the output of a basic-perceptron to the input of another one.
Figure 1: S&P500 index data from 2006 to 2016. Our goal is to predict the movements (up/down) of the S&P500 index, exploiting related time series. Suppose we are going to predict if the close price of E-ISSN: 2224-2899
598
Volume 13, 2016
WSEAS TRANSACTIONS on BUSINESS and ECONOMICS
Luca Di Persio, Oleksandr Honchar
The hidden layer maps inputs into a second space: feature space, and classification space. The latter allows to simplify the output classification layer procedure. In fact, each hidden unit computes a separation of the input space, their combination can carve a polytope in the input space to make output units possible to distinguish polytope membership. Basically, stacking the layers in neural network, we achieve a superposition of functions f1 ... fn , where n is the number of layers, namely
In back propagation algorithm for conventional ANN, the weight matrix is updated via stochastic gradient descent, namely according to the following ∂F , ∂wmq ˆbq = bq − α ∂F , ∂bq
w ˆmq = wmq − α
where F is the objective function. With gradient descent, we compute the error signal and update the parameters per frame of input. At the node q ∗ , we have an output represented by the softmax function. For simplicity, and only in this paragraph, we use q to also denote the input to the node q, i.e., q = Iq . The partial derivative of Oq∗ with respect to Iq , is computed as follows:
y(x1 , . . . , xn ) = fn (...f1 (w0 + w1 x1 + . . . + wn xn )) . (4)
4
ANN training algorithms
4.1
∂F 1 =− Oq∗ (δqq∗ − Oq )Om ∂wmq Oq∗ = −(δqq∗ − Oq )Om .
Backpropagation
Let us first recall some definitions: a Sigmoid function: σ(x) = 1+e1−x ∈ (0, 1), with σ 0 = σ(1 − σ). 4.1.1
We can combine the above two formulas into one, by using the Kronecker delta
Output layer
∂Oq∗ = Oq∗ (δqq∗ − Oq ) . ∂Iq
Let us define the output unit by q, while the hidden layer unit is indicated by m. Moreover we set 4.1.2
• Iq : summed input for unit q.
Hidden layer N-1 and N-2
In what follows we consider hidden unit m at layer N-1, and unit i at layer N-2. The output of unit m is a sigmoid function, hence its derivative reads as follow 1 −1 Om = σ(Im ) = = (1 + e−Im ) −I m 1+e ∂Om −2 = −(1 + e−Im ) (−1)e−Im ∂Im −I −1 e m = (1 + e−Im ) 1 + e−Im = Om (1 − Om ) .
• Oq : softmax output of layer N, unit q • W N : weight matrix from layer N-1 to layer N. • B N : bias for layer N. For the sake of clearness, the layer superscript is dropped whenever there is no ambiguity and we will use a different index letter for the nodes at each different layer. Therefore there is no ambiguity concerning which layer a node is located. Further, we indicate by sof t(.), the softmax function. At each time frame t is (t is omitted for simplicity whenever possible), we have
Analogously, for hidden unit i at layer N-2, and unit j at layer N-3, the error signal of unit i is given by
X Iq = ( wmq Om ) + bq ,
∂F ∂F ∂Oi =− ∂Ii ∂Oi ∂Ii
m
e Iq Oq = sof t(Iq ) = P I , k ke
X ={ ξm wim }(1 − Oi )Oi m
w ˆji = wji + αξi Oj ˆbi = bi + αξi .
where Om denotes the output of unit m, analogously for the output of unit q. E-ISSN: 2224-2899
599
Volume 13, 2016
WSEAS TRANSACTIONS on BUSINESS and ECONOMICS
Luca Di Persio, Oleksandr Honchar
If j is the input layer, i.e. Layer 1, then Oj = Ij .
4.2
References: [1] A. Dutta, G. Bandopadhyay and S. Sengupta, Prediction of Stock Performance in the Indian Stock Market Using Logistic Regression, International Journal of Business and Information, 2012 [2] J. Chen , M. Chen and Nan Ye, Forecasting the Direction and Strength of Stock Market Movement, Technical report, 2013 [3] G. Dasa, P.K. Pattnaikb, S.K. Padhyc, Artificial Neural Network trained by Particle Swarm Optimization for non-linear channel equalization, Expert Systems with Applications, Volume 41, Issue 7, 1, Pages 34913496, 2014 [4] L. Di Di Persio and O. Honchar, Artificial Neural Networks architectures for stock price prediction:comparisons and applications: Forecasting the Direction and Strength of Stock Market Movement, submitted, 2016 [5] L. Di Di Persio and O. Honchar, Artificial neural networks approach to the forecast of stock market price movements, International Journal of Economics and Management Systems, Vol.1, pages 158-162, 2016 [6] B.A. Garro and R.A. V´azquez, Designing Artificial Neural Networks Using Particle Swarm Optimization Algorithms, Computational Intelligence and Neuroscience, Volume 2015, Article ID 369298, 20 pages, 2015 [7] G. L. Gilardoni , Very accurate posterior approximations based on finite mixtures of the hyperparameters conditionals, Journal Computational Statistics & Data Analysis, Volume 51 Issue 2, Pages 872-884 , 2006 [8] W. Huang, K.K. Lai and Y. F. Nakamori, orecasting foreign exchange rates with arti cial neural networks: A review., International Journal of Information Technology & Decision Making, Vol.3(1):145165, 2004 [9] David J. C. MacKay , Comparison of approximate methods for handling hyperparameters, Journal Neural Computation, Volume 11 Issue 5, Pages 1035-1068 , 1999 [10] M. Meissner, M. Schmuker and G. Schneider, Optimized Particle Swarm Optimization (OPSO) and its application to artificial neural network training, BMC Bioinformatics, Volume 7:125, 2006 [11] Y. Wang and In-Chan Choi, Market Index and Stock Price Direction Prediction using Machine Learning Techniques: An empirical study on the KOSPI and HSI, Technical report, 2013
Particle Swarm Optimization
In this context, each particle is a D dimensional vector Xi with velocity Vi and we assume that some objective fitness function f is given. If Pi : represents the best position of particle i, Pg = maxi {Pi }, then the evolution equation is as folllows Vi (k + 1) = wVi (k) + c1 r1 (Pi − Xi (k)) +c2 r2 (Pg − Xi (k)) Xi (k + 1) = Xi (k) + Vi (k + 1) ,
where c1 > 0, c2 > 0 are constants, while r1 , r2 are random numbers in [0, 1]. Iteration terminates after some time or after f (Pg ) reaches some value. Such a scheme can be adapted for a discrete 0/1 problem. In particular, Vi evolves as above, with S being the a logistic transformation into [0, 1], while xi,d is set to one in each step with probability S(vi,d ). For the resulting PSO pseudocode see the Appendix.
5
Conclusion
In this paper we compared two algorithms that can be used for training artificial neural networks. Training neural networks is basically a minimization problem of an error function defined over training set. Several techniques can be applied to find a local minimum. The canonic one, back-propagation with gradient descent, is a stable method converging to some local optimum. Nevertheless, being gradient-based, it requires calculation of partial derivatives, demands long convergence time, and tends to over-fit the cost function if no regularization methods are applied. Particle swarm optimization (PSO) is a global search optimization algorithm which does not require derivatives, but it tends to find an area about some optimal point and is not suitable for finding a good weights set for a neural network. However, these two methods can be combined in a suitable way: first we perform a global search by mean of the PSO approach, then we fine-tune the given weights set by a gradient descent method.
E-ISSN: 2224-2899
600
Volume 13, 2016
WSEAS TRANSACTIONS on BUSINESS and ECONOMICS
Luca Di Persio, Oleksandr Honchar
Appendix
[12] Wei Huang, Yoshiteru Nakamori, Shou-Yang Wang, Forecasting stock market movement direction with support vector machine, Computers and Operations Research, archive Volume 32, Issue 10, 2005, pp. 2513–2522 [13] E. Samolada and A. Zapranis, Can neural networks learn the head and shoulders technical analysis price pattern ? Towards a methodology for testing the efficient market hypothesis, Lecture Notes in Computer Science, 4669, 2007 [14] Pedregosa, F., Varoquaux, G., Gramfort, A., Michel, V., Thirion, B., Grisel, O., Blondel, M., Prettenhofer, P., Weiss, R., Dubourg, V., Vanderplas, J., Passos, A., Cournapeau, D., Brucher, M., Perrot, M. and Duchesnay, E., Scikit-learn: Machine Learning in Python, Journal of Machine Learning Research Volume 12, 2011, pp.2825-2830 [15] Lecture Notes in Computer Science Volume 7700, Neural Networks: Tricks of the Trade, Second Edition, Editors: Grgoire Montavon, Genevi´eve B. Orr, Klaus-Robert M¨uller, 2012.
E-ISSN: 2224-2899
In what folllows we provide a pseudocode for the PSO approach described in Subsection 4.2. Input: ProblemSize, P opulationsize Output: Pg best Population ← ∅; Pg best ← ∅; for i = 1 to P opulationsize do Pvelocity ← RandomVelocity(); Pposition ← RandomPosition(P opulationsize ); Pp best ← Pposition ; if Cost(Pp best ) ≤ Cost(Pg best ) then Pg best ← Pp best ; end end while ¬StopCondition() do foreach P ∈ Population do Pvelocity ← UpdateVelocity(Pvelocity , Pg best , Pp best ); Pposition ← UpdatePosition(Pposition , Pvelocity ); if Cost(Pposition ) ≤ Cost(Pp best ) then Pp best ← Pposition ; if Cost(Pp best ) ≤ Cost(Pg best ) then Pg best ← Pp best ; end end end end return Pg best ; Algorithm 1: Pseudocode for PSO.
601
Volume 13, 2016