May 24, 2008 - method, data characteristics extraction, data mining, neural networks, training algorithm. I. WHAT IS A NEURAL NETWORK? An artificial neural ...
9th International Conference on DEVELOPMENT AND APPLICATION SYSTEMS, Suceava, Romania, May 22-24, 2008
Training Neural Networks Using Input Data Characteristics Cosmin CERNĂZANU, Ştefan HOLBAN University “Politehnica” of Timişoara Str. Vasile Pârvan, No. 2, Timişoara {cosmin.cernazanu,stefan.holban}@c.upt.ro Abstract—Feature selection is often an essential data processing step prior to applying a learning algorithm. The aim of this paper consists in trying to discover whether removal of irrelevant and redundant information improves the performance of neural network training results. The present study will describe a new method of training the neural networks, namely, training neural networks using input data features. For selecting the features, we used a filtering technique (borrowed from data mining) which consists in selecting the best features from a training set. The technique is made up of two components: a feature evaluation technique and a search algorithm for selecting the best features. When applied as a data preprocessing step for one common neural network training algorithms, the test data results obtained from this network are favorably comparable to a classical neural network training algorithms. Nevertheless, the first one requires less computation. Index Terms—Correlation-based Feature Subset Selection method, data characteristics extraction, data mining, neural networks, training algorithm
I. WHAT IS A NEURAL NETWORK? An artificial neural network is a model that emulates the biologic neural network. An artificial neural network is made up of thousands of artificial neurons; elements of nonlinear processing that operate in parallel. [1] The main characteristics of the neural networks are the same with those of the human brain, that is: - capacity of learning - capacity of generalizing If trained adequately, the artificial neural networks would be capable of providing correct answers even for the setentries different from those they have already been used to, as long as they do not differ too much. This generalization is made automatically as a result of their structure and not as a result of human intelligence which is included in a program as in the case of the expert systems.[2][5] Neural networks, with their remarkable ability to derive meaning from complicated or imprecise data, can be used to extract patterns and detect trends that are too complex to be noticed by either humans or other computer techniques. [3] A trained neural network can be thought of as an "expert" in the category of information it has been given to analyze. This expert can then be used to provide projections in given new situations of interest and answer "what if" questions. Other advantages include: • Adaptive learning: An ability to learn how to do tasks based on the data given for training or initial experience • Self-Organization: An ANN can create its own
•
•
organization or representation of the information it receives during learning time. Real Time Operation: ANN computations may be carried out in parallel, and special hardware devices are being designed and manufactured which take advantage of this capability. Fault Tolerance via Redundant Information Coding: Partial destruction of a network leads to the corresponding degradation of performance. However, some network capabilities may be retained even with major network damage.
II. SELECTING THE TRAINING SET FEATURES BY USING DATA MINING TECHNIQUES The idea of using input data features for training a neural network may seem simple and very natural. We may also consider that an important part of the input data currently used in training the different types of neural networks are recurrent and display unnecessary information for the training process. Nevertheless, the process of selecting some data features which can successfully represent the initial data in the training process is a challenge that, in present, is not 100% solved. The field that successfully deals with finding solutions for such problems is data mining. By using the data mining procedure, we will try to find some correlations in a data set in order to select a feature set. For this purpose, we used a well-known technique in data mining – selecting the best features from a data set. The technique implies two components: a feature evaluation technique and a search algorithm for selecting the best features. The evaluation technique used is named CFS (Correlation based Feature Selection) and it is an algorithm that combines this evaluation formula with an appropriate correlation measure and a heuristic search strategy. The technique is based on the hypothesis according to which a good feature set must have characteristics that are closely correlated to the respective set and less correlated (or uncorrelated) to other sets. [4] As search algorithm, we used the BestFirst which is a greedy hill climbing algorithm [6] coupled with a backtracking strategy. The hill climbing algorithm aims at maximizing (minimizing) an f(x) function, where x can take values in a discreet space. If we represent the x values as nods in a graph, then the arch between 2 nods represents the similitude between those 2 nods (states). The algorithm will run through the entire graph, nod by
309
9th International Conference on DEVELOPMENT AND APPLICATION SYSTEMS, Suceava, Romania, May 22-24, 2008 nod, each time trying to maximize (minimize) the f value, until a local maximum (minimum) is reached. In Fig. 1, we can see the graphic representation for a function that has a single local maximum.
The neural network was trained to recognize 4 letters: a, e, n, r. All of them are present in the training set with 200 patterns each. For the second neural network, we firstly filtered the input data and then, we selected only those features that included the characteristics common for all of the 4 letters. The data filtering operation was performed by using the Weka program, to which a supervised ‘selection of the best features’ filter was used.
Figure 1. Graphic representation for a that has a single local maximum.
For selecting the best features from a data set, we used the data mining Weka [7][8][9] program in which we combined the CSF evaluation technique for evaluating the features with the BestFirst search strategy. Further on, we will present the experiments performed and the data obtained through these experiments. III. EXPERIMENTS The first experiment consisted in training a neural network to recognize handwriting. As training and testing data for these networks, we used the NIST 19 international database letter set, that contains over 800.000 entries .[10] The characters used for this first example are represented on a 1024 pixels (32x32) image, each letter previously being processed through a corresponding scaling and a mass centre translation.
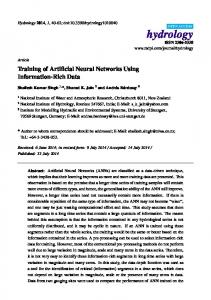
After the filtering operation, only 100 of the 1024 features involved in experiment were preserved. The remaining attributes are: 80, 84, 120, 121, 137, 175, 237, 238, 301, 396, 408, 426, 434, 436, 440, 459, 460, 467, 471, 473, 489, 491, 492, 498, 499, 500, 504, 520, 523, 530, 531, 536, 553, 554, 555, 559, 562, 563, 564, 569, 584, 585, 595, 597, 599, 616, 617, 623, 626, 633, 649, 650, 658, 660, 662, 664, 680, 690, 695, 696, 712, 714, 721, 725, 728, 754, 755, 777, 789, 790, 816, 820, 847, 852, 856, 873, 878, 881, 883, 889, 904, 910, 911, 912, 913, 914, 915, 916, 917, 918, 919, 937, 940, 944, 945, 946, 950, 951, 952 and 985. There were mentioned changes in the structure of the neural network as well, as we can see: the second neural network we used in the experiment was a multilayer perceptron network (Fig. 2) having the following configuration: • Input layer – it is made up of 100 neurons. The activating function is the linear function f(x)=x. The set entries can take the following values: 0 or 1. • Hidden layer – it is made up of 178 neurons. The activating function is a logistic function and has the following configuration: f(x)=1/(1+exp(-x)) • Output layer: it is made up of 4 neurons. The activating function is a logistic function and has the following configuration: f(x)=1/(1+exp(-x)) After the training operation, we tested both networks using a set of 4000 letter patterns, each of the 4 letters having 1000 patterns. The results obtained are presented in Table I and Table II and the graphic representation can be seen in Fig. 3 and Fig. 4.
Figure 2. Multilayer perceptron with one hidden layer.
The first neural network we used in the experiment was a multilayer perceptron network (Fig. 2) having the following configuration: • Input layer – it is made up of 1024 neurons. The activating function is the linear function f(x)=x. The set entries can take the following values: 0 or 1. • Hidden layer – it is made up of 713 neurons. The activating function is a logistic function and has the following configuration: f(x)=1/(1+exp(-x)) • Output layer: it is made up of 4 neurons. The activating function is a logistic function and has the following configuration: f(x)=1/(1+exp(-x))
310
TABLE I. EXPERIMENT 1 RESULTS FOR LETTER RECOGNITION RATE Letter Network 1 Network 2 recognition rate recognition rate A 60.2 % 60.3 % E 81.1 % 81.1 % N 85.5 % 85.9 % R 85 % 85.1 %
TABLE II. EXPERIMENT 1 RESULTS FOR NEURAL NETWORKS TRAINING TIME No. of epochs Network 1 training Network 2 training time time 1 epoch 136 s 40 s 10 epochs 1380 s 401 s 100 epochs 13900 s 4009 s
9th International Conference on DEVELOPMENT AND APPLICATION SYSTEMS, Suceava, Romania, May 22-24, 2008 100.00%
The fourth neural network has the following configuration: • Input layer – it is made up of 6 neurons. The activating function is the linear function f(x)=x. The set entries can take the following values: 0 or 1. • Hidden layer – it is made up of 41 neurons. The activating function is a logistic function and has the following configuration: f(x)=1/(1+exp(-x)) • Output layer: it is made up of 7 neurons. The activating function is a logistic function and has the following configuration: f(x)=1/(1+exp(-x)) After the training operation, we tested both networks using a set of 1500 patterns, each of the 7 letters having 215 patterns. The results obtained are presented in Table III and Table IV and the graphic representation can be seen in Fig. 5 and Fig. 6.
90.00% 80.00% 70.00% 60.00%
Network 1 recognition rate
50.00% 40.00% 30.00%
Network 2 recognition rate
20.00% 10.00% 0.00% A
E
N
R
Figure 3. Recognition rate for experiment 1.
16000 14000 12000 10000
TABLE III. EXPERIMENT 2 RESULTS FOR PATTERN RECOGNITION RATE Classes Network 3 Network 4 recognition rate recognition rate Pat 96% 96 % Foliage 97 % 97.1 % Window 95.8 % 95.8 % Brickface 97.2 % 97.2 % Cement 96.4 % 96.3 % Sky 96.8 % 97 % Grass 96 % 96 %
Network 1 training time
8000 6000
Network 2 training time
4000 2000 0 1 epoch
10 epochs
100 epochs
Figure 4. Training time for experiment 1.
We can easily notice a favorable recognition rate of Network 2 in comparison with Network 1, the training time being shorter for the second network. For the second experiment, we used training data from the „image segmentation data field”. [11] Each training pattern is made up of the features from a 3x3 pixels segment of an image. The neural network must analyze these features and classify the respective pattern into one of the 7 possible patterns available: pat, foliage, window, brickface, cement, sky, grass. The same as for the first experiment, we trained two neural networks: one with the initial data, the other with the filtered data. After filtering the pattern data features, out of 19 features, only 6 were selected as being the most important for selecting the category to which the respective pattern belongs. The remaining attributes are: region-centroid-col, region-centroid-row, hedge-mean, rawred-mean, hue-mean.
98% 97%
Network 3 recognition rate
97% 96%
Network 4 recognition rate
96% 95%
Pa t Fo liag e Wi nd ow Bri ckf ace Ce me nt Sk y Gr as s
The third neural network has the following configuration: • Input layer – it is made up of 19 neurons. The activating function is the linear function f(x)=x. The set entries can take the following values: 0 or 1. • Hidden layer – it is made up of 48 neurons. The activating function is a logistic function and has the following configuration: f(x)=1/(1+exp(-x)) • Output layer: it is made up of 7 neurons. The activating function is a logistic function and has the following configuration: f(x)=1/(1+exp(-x))
TABLE IV. EXPERIMENT 2 RESULTS FOR NEURAL NETWORKS TRAINING TIME Epochs Network 3 training Network 4 training time time 1 epoch 1s 1s 10 epochs 11 s 4s 100 epochs 115 s 39 s
Figure 5. Recognition rate for experiment 2.
311
9th International Conference on DEVELOPMENT AND APPLICATION SYSTEMS, Suceava, Romania, May 22-24, 2008 140 120 100
Network 3 training time
80
We should also mention that an input data preprocessing by filtering the data main features is more than necessary because it eliminates the data recurrences and the features that are not used in the training procedure. A preprocessing operation of the input data by selecting the data main features is highly recommendable as it considerably improves the neural network training procedure.
60
Network 4 training time
40
REFERENCES [1] [2]
20 0 1 epoch
10 epochs
100 epochs
Figure 6. Training time for experiment 2.
IV. CONCLUSION The present paper aimed at presenting a new neural network training method. The procedure consists in preprocessing the input data for selecting their main features. The filtering operation was performed by using a data mining algorithm for selecting the best features. We obtained approximately equal recognition rates (even favorable for the neural networks to which the input data were previously filtered). Moreover, the training time was shorter and the complexity of the network trained with input features was evidently superior.
Teodorean, G., “Artificial Neural Networks”, Ed. Cluj-Napoca, 1995 Negnevitsky, M., “Artificial Intelligence: A Guide to Intelligent Systems”(2nd Edition), Addison Wesley, England,2005. [3] Stergiou, C., Siganos, D., “Neural networks” , http://www.doc.ic.ac.uk/~nd/surprise_96/journal/vol4/cs11/report.htm l, 1996 [4] Hall, M. “Correlation-based Feature Selection for Machine Learning”, Ph. D. diss. Hamilton, NZ: Waikato Uiversity, Department of Computer Science, 1998 [5] Luger G., “Artificial Intelligence :Structures and Strategies for Complex Problem Solving” (Fifth Edition) Addison Wesley, 2005. [6] Boyan, J., Moore, A., “Learning evaluation functions to improve optimization by local search”, Journal of Machine Learning Research, Volume 1, pp. 77-112, 2000 [7] Weka3, “Data mining Software in Java”, The University of Waikato, http://www.cs.waikato.ac.nz/ml/weka, 2008 [8] http://weka.sourceforge.net/wiki/index.php, Performing attribute selection, 2008 [9] Witten, I. H., Frank, E., “Data mining: Practical Machine Tools and Techniques (Second Edition), Morgan Kaufmann, 2005 [10] NIST Handprinted Forms and Characters Database, www.nist.gov/srd/nistsd19.htm, 2007. [11] Image Segmentation Data, Vision Group, University of Massachusetts, November, 1990
312