U.S. Department of the Interior U.S. Geological Survey
Additional information for “TREMOR: A Wireless, MEMS Accelerograph for Dense Arrays” (Evans et al., 2003)
John R. Evans1, Robert H. Hamstra2, Jr., Paul Spudich1, Christoph Kündig3, Patrick Camina4, and John A. Rogers5
Open-file Report 03-159
This report is preliminary and has not been reviewed for conformity with U.S. Geological Survey editorial standards or the North American Stratigraphic Code. Use of trade, product, or firm names is for descriptive purposes only and does not imply endorsement by the U.S. Government. 1
U.S. Geological Survey, 345 Middlefield Road, MS-977, Menlo Park, California, 94025,
[email protected] 2 Circuit Solutions, 6125 Prospect Rd., San Jose CA 95129,
[email protected] 3 GeoSIG Ltd., KanalStraβe 11, 8152 Glattbrugg, Switzerland,
[email protected] 4 Now at 1A 1/02 Cathedral Court, U. Surrey, Guildford, Surrey GU2 7JH, UK 5 DAQ Systems, 15044 Kelly Canyon Rd., Bozeman MT 59715,
[email protected]
2
CONTENTS CONTENTS....................................................................................................................... 2 FIGURES ........................................................................................................................ 2 TABLES.......................................................................................................................... 2 ON-LINE VERSIONS.................................................................................................... 2 INTRODUCTION............................................................................................................. 3 SPATIAL VARIABILITY—THE DEVELOPMENT OF FIGURE 1 ........................ 3 THE RAPID COMPUTATION OF PEAK GROUND VELOCITY........................... 4 SITING METHODS AND COOPERATIVE EFFORTS ............................................. 6 SOME GENERAL MEMS DETAILS ............................................................................ 7 A BIT OF HISTORY...................................................................................................... 9 CONCLUSIONS ............................................................................................................. 10 ACKNOWLEDGMENTS .............................................................................................. 11 REFERENCES................................................................................................................ 12 FIGURES Figure 1: PSV Spatial Variability Figures 2a,b: Precision of PGV Computation Figure 3: A Nested Array TABLES Table 1: A Classification of Strong-Motion Instruments Table 2: Selected MEMS Accelerometers
4 5 11
3 8
ON-LINE VERSIONS This report is available via anonymous ftp on the computer “clover.wr.usgs.gov” as file “/ftp/pub/ehz/jrevans/OFR_03_159/OFR_03_159.pdf”. Use your e-mail address as the login password for username “anonymous”. Because the file is in Adobe™ Acrobat™, use only a binary transfer. Should the particular computer and path change in the future, the Acrobat™ file is also available at the USGS Web site “http://pubs.usgs.gov/products/books/openfile/” by browser retrieval techniques. Look for “2003” under “Open-File Reports” or search for this volume number, “03-159”.
3
INTRODUCTION The length of Evans et al. (2003) necessitated transfer of several less germane sections to this alternate forum to meet that venue’s needs. These sections include a description of the development of Figure 1, the plot of spatial variability so critical to the argument for dense arrays of strong-motion instruments; the description of the rapid, integer, computational method for PGV used in the TREMOR instrument (the Oakland instrument, the commercial prototype, and the commercial instrument); siting methods and strategies used for Class B TREMOR instruments and those that can be used for Class C instruments to preserve the cost advantages of such systems; and some general discussion of MEMS accelerometers, including a comparative Table with representative examples of Class A, B and C MEMS devices. (“MEMS” means “Micro-ElectroMechanical” Systems—“micromachined” sensors, generally of silicon. Classes A, B, and C are defined in Table 1.) Table 1. A classification of strong-motion instruments.
Class A B C
Resolution* Bits dB _20 bits _120 16-19 bits 96-114 12-15 bits 72-90
Retail Cost ~$7000, quantity 100 ~$2500, quantity 1000 ≤$1000à , quantity 10,000
* For RMS noise versus full-scale range. Complete from sensors through telemetry. à $500 should be readily attainable.
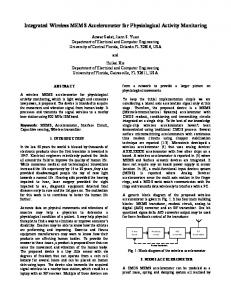
SPATIAL VARIABILITY—THE DEVELOPMENT OF FIGURE 1 Figure 1 of Evans et al. (2003), reproduced here as our Figure 1, contains data from only two publications, Abrahamson and Sykora (1993) for station separation distances of 10 and 100 m, and Field and Hough (1997) for separations from 511 m to 5 km. By definition, uncertainty is also zero at zero station separation—estimation presumably is perfect when sitting on a station. Abrahamson and Sykora (1993) mainly use data from the SMART-1 and LSST arrays in Taiwan, but also include data from California and elsewhere in Taiwan. They characterize site conditions only as “soil” for the stations we reproduce here, and give ln-normal standard deviations and associated error estimates. We converted the standard deviations to log-normal (base-10) to combine them with the similar results of Field and Hough (1997), whose data came entirely from a dense array in the San Fernando Valley recording aftershocks of the 1994 Northridge earthquake. These sites have estimated 150 ≤ VS,30m ≤ 285 m/s—in or near NEHRP Site Class D, firm soil. Field and Hough corrected amplitudes for geometric spreading and site effects so the comparison is effectively between equals. In both cases, because Field and Hough (1997) could not resolve any frequency dependence, the response spectra have been averaged over the band from 0.5 to 10 Hz. Finally, we approximately converted from the Sa reported by Abrahamson and Sykora (1993) to the PSV used by Field and Hough as PSV ≈ Sa/ω. The curve fitting in Figure 1 is simply by eye, using a form suggested by Boore (1997), constrained to be asymptotic to the variance for firm soil PSV in the ground-motion prediction equations of Boore et al. (1993). We also attempted a similar plot for PGA, using data from numerous authors. These data proved to be far noisier. This result was not well enough constrained for publication, but was at least grossly similar to the PSV result in Figure 1.
4 THE RAPID COMPUTATION OF PEAK GROUND VELOCITY To support ShakeMap (Wald et al., 1999), TREMOR stations must at a minimum return PGA and PGV in near-real-time. (Additionally, to support loss-estimation models such as HAZUS (e.g., Nishenko et al., 1998), they should report Sa for which the USGS also has a rapid computational technique used in the Oakland instruments.) The commercial prototypes built under the CRADA contained only a Motorola H8 microcontroller, which is a 16-bit compute engine of limited capability (10 MHz internally, ~1.5 MIPS for average instructions) Worse yet, these recorders had very limited memory space for the executable code (the primary reason Sa was not supported).
Figure 1. Site-to-site PSV response-spectrum variance versus station separation for soil sites. This degree of variability suggests that sub-kilometer station spacing may be required to map shaking strength substantially more precisely than to the uncertainty of attenuation relations. Data are from Abrahamson and Sykora (1993) and Field and Hough (1997). “BJF93” means Boore et al. (1993) variance scaled for a site pair.
While PGA is trivially computed, PGV requires filtering and integration. With some care, integration can be done by sum and shift, both fast operations. However two bits of cleverness are required to obtain a stable result with a slow, integer compute engine. (1) One must find a way to perform the filtering operation without multiplication or division and without floating point operations. (2) One must overcome the significant baseline drift associated with the inability to correct baselines to any better than the nearest integer sample.
5 The latter problem creates a constant offset of up to one half count, or about 30 µg, in this case (16 bits over ±2 g). After 60 s, this error accumulates to 1.8 cm/s in velocity, which is a significant error up to about Instrumental Intensity V. Our solution to this baselinequantization problem is to pre-whiten (“dither”) the acceleration trace with a pseudo-random sequence added to the trace. To save memory, this sequence was limited to just one particular value randomly either added or subtracted at each point, and this random sign represented by single bits stored in seven long words of memory, thus 1.12 s at 200 sps, after which the sequence repeats. We also arranged for nearly equal numbers of positive and negative values in the sequence—zero mean. Hence, the sequence was hardly random in any strict sense, notwithstanding its origins in a MatLab™ pseudorandom number generator. The value added or subtracted is 6 counts, selected empirically in tests with small and moderate events gathered from the Oakland TREMOR array and the USGS database of Seekins et al. (1992). Filtering was accomplished by noting that all coefficients of the first order low-cut filter used were either unity or very near 0.99. (We restricted our attention to the three sample rates of the commercial prototype—50, 100, and 200 sps.) By approximating the values near 0.99 with 1–2–n (where, in this case, n ranged from 5 to 8) and by taking advantage of the relative computational tolerance of the direct form II transposed difference equation (e.g., Oppenheim and Schafer, 1989; Rabiner and Gold, 1975), we were able to program the filter entirely in integer using only addition, subtraction, and bit shifting, all of which are very fast operations. The worst error in a coefficient was 0.7% at 50 sps; the rest were within 0.3% of their correct values. We first shifted all data up by seven bits (128×) to improve computational precision without risking overflow, and performed all operations as 32-bit integers.
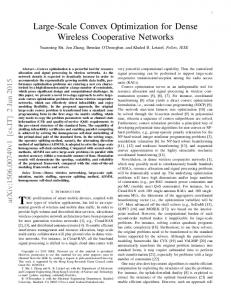
Figure 2. The precision of our 16-bit high-speed computation of peak ground velocity. (a) Comparison of PGV results when computed in floating point and computed approximately in integer using our method, including approximate filter coefficients and pre-whitening by six counts. (b) The differences between integer and floating-point results in (a).
Comparing the accuracy of PGV computed with a fully floating-point algorithm to an algorithm where only the filter is replaced by this integer technique produced a very small error. A linear regression between these two ways of computing PGV yielded a slope of 1.008, where a slope of 1.0 would have indicated equivalent results. PGV values computed with the integer filters were slightly higher than those computed with floating point filters. When the integration operation also is made integer and pre-whitening is added to compensate for the resulting baseline drift effects, a linear regression between the floating-point and integer PGV results has a slope of 0.982 (Figure 2a), leaving the errors shown in Figure 2b. The typical
6 error is about 2.5%, with PGV values usually underestimated. The algorithm is occasionally mislead by a substantially larger fraction, most often for very small events. SITING METHODS AND COOPERATIVE EFFORTS While not strictly a hardware instrumentation issue, an intrinsically related cost-conscious compromise introduced with TREMOR was our choice to accept less than ideal free-field sites. Again with the advice of W. Joyner (personal comm., ca. 1995-1998), we accepted that one and two-story light-weight structures, and even 1.5-story concrete and masonry structures (e.g., truck bays), are sufficiently good approximations of free-field sites. This pragmatism permits far easier and quicker installation, access to power, and protection from weather and vandalism while greatly increasing the viable stock of potential sites, particularly those associated with fire stations, churches, and other naturally allied organizations. Hence, this compromise provides a major cost saving factor in network operations. The process of selecting sites and obtaining permission for their use (“siting and permitting”) is extremely time consuming, thus expensive. It is essential in dense arrays to reduce these expenses in addition to the direct instrument costs. Similarly, it will be essential to find and work closely with every possible ally if dense arrays are to be operated economically. For Class-A and -B instruments, we anticipate professional operation of some type, perhaps by consortia and loose groupings of governments, universities, and commercial interests. Indeed, ANSS has formed several such alliances between traditional professional groups in its regional networks, as well as the beginnings of joint efforts with commercial parties through the ANSS Corporate-USGS Strong-Motion Partnership (Zoback et al., 1999; Savage, 2002). In this partnership, companies interested in using Class-A or -B instruments as part of their emergency-response and business-resumption programs will purchase and maintain them but share the data with the USGS in return for the operational support of the USGS and the rapid generation of a data package for emergency and business resumption use (corrected time histories, spectra, and parameters). Corporations are typically very conscious of costs and personnel demands. Therefore, we anticipate that the Class-B alternative may be useful in expanding these partnerships. We also anticipate the active participation of firefighters, churches, high-school and college science classes, and other naturally allied groups as providers of easily permitted sites, local assistance, protection of the instruments, and local monitoring of the data and structural responses. For Class-C instruments, even less traditional approaches will be required. We foresee very few if any such instruments being operated directly by professional concerns, excepting perhaps in extremely remote areas like Tibet where weight limitations, export restrictions, or high loss rates (akin to early OBS work) may require their use. However, there may be a very large opportunity for their use by earthquake insurance concerns in the mutual protection of the insured and the insurer. For example, to limit frivolous claims following tiny earthquake and to assist the insured following large events, one could imagine a clause or a law placing the burden of proof upon the insured below some threshold PGV, and upon the insurer above that threshold. This provision would require the placement of a Class-C instrument at the insured structure, for example on the garage slab of a private home, plugged into the wall socket. The insurer might be obliged to pay for the instrument and the insured to care for it, with some higher PGV threshold obtained from a third-party source to be used if the instrument were not tended properly. Most of these data could be downloaded via Bluetooth™ or some similar short-range telemetry through the insured’s (or any neighbor’s) computer upon their next login. Most of the rest can be retrieved by a purpose vehicle passing on the street and the few remaining by direct visits.
7 Additional Class-C installation options, some also applicable to Class-B, are fire and police stations, schools, amateurs, churches, highway departments, other lifeline providers, and janitorial closets in city parks (there are a surprising number). We also have found through media calls for volunteers that many private individuals are interested in hosting instruments. What most of these classes of hosts share in common are large infrastructures with central points of permission. It may take some time to get that permission, but many sites then follow. Additionally, many of these groups have some form of motivation, either economic, political, or egalitarian. Finally, they tend to own light-weight and/or low-rise structures or open land suitable for free-field sites. One design consideration for Class-C instruments operated by non-professionals is worthy of comment, and may partly apply to Class B too. Backup batteries are still needed, of course, since the units must operate at least through the mainshock. No battery technology yet exists that does not require replacement every three years or so. The best battery chemistry in this application (continuous trickle charging) remains the venerable sealed lead-acid battery, but this and most other types must be recycled when replaced. Careful design should make both the accelerograph itself and the battery within it host-installable. Thoughtful design of packaging and instruction materials, and use of Business Reply Mail (sealed lead acid batteries can be mailed and taken on aircraft) would allow replacement and return of the battery at regular intervals through a contracted, automated system requiring no visits to the site. Connectors naturally would have to be polarized, and probably integrated with the battery so that a single act both emplaced and connected the battery. (In the quantities applicable to Class C, such customized battery designs are routinely performed at very modest cost.) The tilt-measuring capabilities of the accelerometers would provide a degree of quality control to assure that the recorder had not been dislodged in the battery-replacement process, and that the instrument had been installed level in the first place. Azimuth control, if installed by the host, is difficult. Given the variation in skill levels among hosts, azimuth might have to come from first arrivals, or the horizontals simply be treated as random-azimuth. However, there is some chance that careful instructions based on street orientation might work most of the time in conjunction with GIS information. Again, one must change philosophies somewhat when dealing with the mass deployment of 104 Class-C instruments. SOME GENERAL MEMS DETAILS There is a wide range of architectures, performance specifications, and prices among MEMS accelerometers. They range from Class A to below Class C. Our original notion was that MEMS could fill the need for Class B and C sensors in a nested array, but the recent introduction of the Applied MEMS Si-Flex™ 1500 and its kin has brought the robustness advantages of the technology to Class A. A very limited list of MEMS accelerometers is given in Table 2, relying almost exclusively on manufacturers’ specifications and written and verbal communications. It includes the most interesting devices known to us and a few representatives in other categories. There are at least dozens of alternatives if not hundreds. Some MEMS devices are built up on a single silicon wafer, but the majority appear to be assembled from three wafers, an inertial mass surrounded by two caps that provide motion stops, usually viscous gas damping, and often capacitive plates. Indeed, most MEMS sensors use capacitive sensing of the inertial-mass offset, though a few use piezoresistive bridges in the cantilever springs, and there is at least one report of an experimental optical system. Both open-loop and force-feedback systems are widely used. When present, feedback is supplied electrostatically in all cases we have reviewed. The arguments for using force feedback are less compelling in MEMS than conventional devices because displacements are small, and
8 often rotation-canceling, and the mechanical systems are much more reliable and have less net effect on system response functions in seismic applications. Some MEMS accelerometers have signal conditioning circuits on the same silicon as the sensor, but the highest performance devices typically do not (optimal manufacturing-process requirements for the mechanical and active electronic components are too divergent). Of course, sensing elements such as capacitive plates or piezoresistors are uniformly part of the inertial-mass device. Damping is often supplied by the motion of gas trapped between the inertial mass and the surrounding plates, however some systems supply damping through the feedback mechanism, and may evacuate the inertial-mass volume to reduce Brownian-motion noise or raise Q. Manufacturer
Model
Range
Dynamic Range
10
1000
$2000à $159 $300
--$122 ~$200
$105
$70
(all ª)
(g)
(dB)
("bits")
Applied MEMS Silicon Designs Applied MEMS
SF3000L 1221L SF1000**
±3.5 ±2 ±3.5
129 105 101
22.5 18.4 16.9
ICSensors (MSI*)
3028
±2 (±4)*
96 (102)*
16.9 (17.9)*
400
1
Colibrys VTI Hamlin Analog Devices
MS 7002 SCA610-C28H1G ADXL202AE
±2 ±1.7 ±2
>79 81àà 65
>13.2 13.5 11.7
6,000 20,000 1,000
3 5àà 2
(all ª)
Price in Quantity
Cross Axis (%FS) 0.1 2 0.1
Shock Limit (g) 1,500 2000 1,500
$300-$100 $53.00 $13.20 $14.55 $9.70
RMS noise floor versus full scale over 35 Hz: 20 log 10 (FS /RMS ), where FS (Full Scale) is the clipping amplitude (e.g., +2 g) and RMS is the system noise floor over a 35-Hz bandwidth. "Bits" adds one, for ±full scale: 1+ log 2 (FS/RMS). More conservative metrics might be appropriate. à Three-axis device; per-axis equivalent cost $667. Quantity-1000 price unavailable. ** Available 2003. * USGS test results, 0.1-35 Hz, in configuration destined for GeoSIG Ltd. release in 2003. This sensor is capable of operation to ±5 g if needed (103 dB dynamic range). Performance at ±4 g range is shown in parentheses for ANSS comparison. Prices are for sensor without conditioning electronics. (ICSensors is a division of Measurement Specialties.) Manufacturer only gives range of prices, without explicit quantities. Manufacturer claims 110 dB dynamic range. Published specifications produce the numbers shown here. àà Corner frequency (Ğ3 dB point) is 50±30 Hz due to overdamping of 1-kHz natural-frequency pendulum; response is approximately proportional to velocity above corner frequency. All others shown have high corners and much less damping. Cross-axis sensitivity is almost entirely due to die-alignment uncertainty. Intrinsic cross-axis sensitivity is