Presented at the 1999 Symposium on Advanced Research in VLSI, Atlanta, GA, March 1999
Battery-powered, Wireless MEMS Sensors for High-Sensitivity Chemical and Biological Sensing C. L. Britton, Jr. a,b , R. J. Warmack a,b, S. F. Smith a,b, P. I. Oden a,b, R. L. Jones b, T. Thundat a, G. M. Brown a , W. L. Bryan a, J. C. Depriest a, M. N. Ericson a, M. S. Emery a, M. R. Moore a, G. W. Turner a, A. L. Wintenberg a,b, T. D. Threatt b, Z. Hu b, L. G. Clonts a, and J. M. Rochelle b a
Oak Ridge National Laboratory, MS 6006, Oak Ridge, TN 37831-6006 b
The University of Tennessee, Knoxville, TN 37996 {
[email protected]}
Abstract Researchers at Oak Ridge National Laboratory (ORNL) are developing selectively coated cantilever arrays in a surface-micromachined MEMS process for very high sensitivities in chemical and biological sensing. Toward this end, we have developed a one-dimensional (1-D) 10-element microcantilever array that we have coated with gold for mercury sensing and palladium for hydrogen sensing. Ultimately we will coat each element with a different coating. Currently, measurements have been performed using a companion analog 1.2-µm CMOS eight channel readout chip also designed at ORNL specifically for the microcantilever arrays. In addition, we have combined our sensors with an ORNL-developed RF-telemetry chip having on-chip spread spectrum encoding and modulation circuitry to improve the robustness and security of sensor data in typical interference- and multipath-impaired environments. We have also provided for a selection of distinct spreading codes to serve groups of sensors in a common environment by the application of code-division multiple-access techniques. Our initial system is configured for use in the 915-MHz Industrial, Scientific, and Medical (ISM) band. The entire package is powered by four AA batteries.
1: Integrated Microsensors Researchers at Oak Ridge National Laboratory and the University of Tennessee have been actively involved for years in various novel sensor developments and highly integrated custom analog integrated circuit development for large particle-physics experiments, some having over 300,000 channels of integrated CMOS electronics. More recently, we have begun to marry the two areas of research into integrated sensors and wireless telemetry. The first section describes selectively coated microcantilevers, a sensor technology that exhibits a great deal of promise for low-power sensing of environmental contaminants. The second section presents the present work to date on the wireless telemetry initiative.
2: Selectively-Coated Microcantilevers 1.1: Background Although cantilevered sensors based on frequency variation have been constructed since the sixties, there has recently been a great surge in microcantilever sensor research [1-9]. Microcantilever sensor technology is a next-generation electromechanical technique with
Page 1
Presented at the 1999 Symposium on Advanced Research in VLSI, Atlanta, GA, March 1999
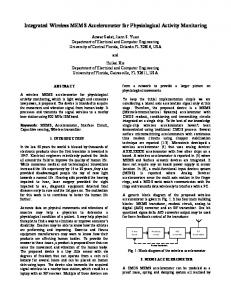
broad application in chemical, physical, and biological detection. Microcantilevers, such as those used by atomic force microscopes (AFM), have been demonstrated as a universal platform for real-time, in-situ measurements of physical and bio-chemical properties. We have developed a wide variety spectrum of physical, chemical, and biological sensors based upon the microcantilever platform. The typical dimensions of commercially available micromachined, mass-produced microcantilevers are 50 -200 µm long, 10-40 µm wide and 0.3 -3 µm thick, with mass in the range of a few nanograms. The resonant frequency of these cantilevers are in the range of a few kHz to a few hundred kHz. Depending on the dimensions, the cantilever spring constant can vary from 0.008 - 30 N/m. The deflections of these cantilevers can be detected with sub-angstrom precision using current techniques perfected for AFM technology such as optical, piezoresistive, piezoelectric, capacitive, and electron tunneling [10]. Sensitive detection of the cantilever deflection due to adsorption-induced forces (stress response) and resonance frequency variation due to mass loading can result in part-per-billion (ppb) to part-per-trillion (ppt) sensitivity11. The two approaches are illustrated in Figure 1. Species selectivity can be achieved by using chemically selective coatings on the cantilevers. We have demonstrated a number of extremely sensitive physical, chemical, and biological sensors using microcantilevers. Examples include relative humidity, mercury vapor, mercaptans, toluene, viscosity, infrared and ultraviolet radiation [12-14], flow rate, lead in water [15], DNA hybridization, and antibody-antigen interactions.
Unexposed beam
Beam exposed to vapor
Selective coating
Beam stress response
Unexposed beam
Direction of beam movement
Beam exposed to vapor
Selective coating
Beam resonant frequency response
Vibrational frequency decreases with increasing exposure
Figure 1. Two modes of cantilever response Until recently, we used only commercially available, V-shaped silicon nitride and silicon cantilevers with typical dimensions of 100-200 µm in length, 20-40 µm in width and 0.6 µm in thickness (supplied by Digital Instruments and Parks Scientific). Readout of the position of the cantilever tip was performed by reflecting a laser off the tip to an optical detector. This allowed excellent sensitivity but required alignment of the optical path, was limited to one (or at least very few) cantilever at a time, and required a great deal of power.
Page 2
Presented at the 1999 Symposium on Advanced Research in VLSI, Atlanta, GA, March 1999
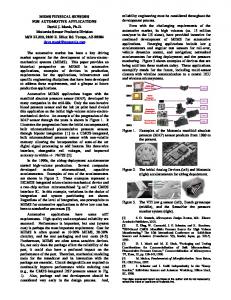
1.2: Present research Our current research has been focused on developing arrayable, electronically read cantilevers in a commercial MEMS process [16]. We ultimately intend to put a variety of cantilevers with many different coatings on one single chip in order to detect many different compounds. The process we chose for custom fabrication was the surface-micromachined MUMPS process from MCNC in North Carolina. We have found that this process is acceptable for prototyping but that the polysilicon thickness is too great for the levels of sensitivity we ultimately desire. For example, the AFM cantilevers are only about 0.6 µm thick but the polysilicon cantilevers in the MUMPS process are 2 µm thick. As it has been experimentally observed (and theoretically confirmed) that the sensitivity is inversely proportional to the cantilever thickness, it seems certain that significant sensitivity has been sacrificed due to the increased thickness of the MUMPS-processed devices [17]. Part of the prototype 1-D array is shown in Figure 2.
Coated areas
Capacitor
Beam anchor
Readout pad
Figure 2. Photograph of representative microcantilever structures The beam is ‘pi’ shaped, with the coating areas as shown. As the coating reacts with the vapor being sensed, the change in structural stress from this interaction causes a deflection of the beam, thus changing the spacing between the upper and lower plates; this in turn is sensed as a change in sensor capacitance. 1.2: Integrated Capacitance Readout The readout of the cantilevers has been accomplished using an application-specific integrated circuit (ASIC) expressly designed for the task of measuring capacitance changes. The ASIC itself contains 8 channels of electronics; a block diagram is shown in Figure 3 and a photo of the mounted sensor/readout chipset in Figure 4. As can be seen from the diagram, a channel consists of two stages, a gain stage followed by a sample/hold circuit, the sample/hold being used to provide a DC output voltage. With the appropriate drive signal, the output voltage is given as
∆Vout = − ∆C Cantilever *
V in( peak − to − peak ) C Feedback
Page 3
(1)
Presented at the 1999 Symposium on Advanced Research in VLSI, Atlanta, GA, March 1999
It can be seen in the gain equation that the output voltage is inversely proportional to the value of the feedback capacitance. This feedback value is controlled externally by switching in (or out) a second feedback capacitor to optimize dynamic range. The reset switch and sample/hold circuit are synchronized with the input signal so that the circuit will reset and sample at the desired times in relation to the input square wave. The major advantage of this circuit topology is that the gain is rendered insensitive to stray capacitance due to virtual grounds at both ends of the cantilever. These strays, however, affect the overall front-end noise gain. The output noise is given as 2 out
e
=e
2 n _ Sample / hold
+e
2 n _ Amp1
CCantilever + CStray 1 + C Feedback
2
(2)
The first noise term in the equation is due to the equivalent noise voltage of the op-amp in the sample hold circuit. The second term is due to the gain stage’s equivalent noise voltage, taking Readout Chip MUMPS Chip
Amp 1 Cf
Cantilever _ + V01
Sample and Hold Circuit
Output
VDC
Vin
Arrays Continue in both Directions
C V01 = − Cantilever *Vin + V DC Cf
Figure 3. Readout chip block diagram the gain of the sample/hold stage to be unity. The measured power for the readout circuit was approximately 18mW/channel. readout chip has a measured noise of 13 mV rms.
Cantilever array chip
CMOS readout chips
Figure 4. Chipset mounted on printed circuit board
Page 4
The
Presented at the 1999 Symposium on Advanced Research in VLSI, Atlanta, GA, March 1999
3: Wireless Telemetry 3.1: Background The development of the integrated wireless sensor ASIC has largely been the result of an internally funded ORNL R&D program entitled “Intelligent Wireless Sensors & Systems.” Since high-quality integrated wireless sensors do not yet exist on the commercial market, ORNL management elected to fund this ambitious effort to produce a ‘smart’, highly integrated sensor device to address the specific needs of scientific research in several areas. Premiumgrade analog sensor integration with on-board RF circuitry is more difficult than “plug and play” - good understanding of the device physics is required. Further, to obtain the benefits of low-noise, high-resolution and high-reliability sensor readout requires special RF transmission techniques, e.g., spread spectrum. Spread-spectrum transmission is vastly superior to traditional narrowband RF communication methods for several reasons. First, spread spectrum, whether in the directsequence or frequency-hopping format, can be designed to be highly resistant to interference and multipath effects. Second, spread-spectrum permits multiple access channels (e.g., CDMA cellular telephone) and concurrent ranging functions. The spread-modulation coding can also provide high data security (i.e., encryption) at modest incremental cost. Finally, due to its lower power spectral density which results in a markedly reduced tendency to cause interference to other RF spectrum users, the Federal Communication Commission has allocated five special frequency bands (902-928, 2450-2483.5, 5150-5250, 5250-5350, and 5725-5825 MHz) for the unlicensed use of spread-spectrum devices which meet specific power and spectral requirements. We began the development of the fully integrated device by designing, fabricating and testing numerous RF/wireless “building block “ circuits in 1.2-µm, 0.8-µm, and finally 0.5-µm CMOS processes. These processes, from Orbit and Hewlett-Packard, had been used extensively by ORNL staff for a variety of developments. The more versatile CMOS technology was chosen over bipolar processes due to its ability to concurrently produce highspeed, low-power digital and analog circuitry, coupled with sufficient speed to fabricate useful RF devices. The progression to sub-micron CMOS was accomplished by a series of prototype fabrications of the basic RF circuit blocks including data modulators, phase-locked loop frequency synthesizers, spread-spectrum sequence generators, analog-to-digital (A/D) converters, RF power amplifiers, voltage references, temperature transducers and the control logic required to orchestrate the numerous chip functions. The final 0.5-µm H-P process was utilized for several key reasons: (1) it is a main-line stable commercial process; (2) its inherent speed supports RF circuits up to at least ~1 GHz; (3) its 3.3 V supply rating is useful for lowvoltage systems; (4) the high circuit density can handle complex chip architectures; (5) it will also permit inclusion of high-quality analog circuitry; and (6) it can fabricate very highperformance logic circuits. All these attributes are necessary to support the integrated spreadspectrum sensor device. 3.2: Wirtx1 chip design The integration of the previously mentioned building block elements has resulted in the production of an integrated chip named ‘wirtx1’. Wirtx1 is a “smart” wireless sensor chip prototype, a simplified block diagram of which is shown in Figure 5, that has been designed in a 0.5-µm Hewlett-Packard CMOS process which incorporates temperature sensors, a fourchannel analog multiplexer to support multiple sensor inputs, a 10-bit A/D converter with
Page 5
Presented at the 1999 Symposium on Advanced Research in VLSI, Atlanta, GA, March 1999
bandgap voltage reference, a programmable spread-spectrum generator with selectable families of Gold-code polynomials, an integrated state-machine system controller, high-speed data modulator, and output RF power amplifier. The chip utilizes an internal sequence controller that cycles the device through an entire data acquisition/transmit routine at a regular, controllable interval. The various sub-systems are described below. The unmodulated output of the PLL and output amplifier is shown in Figure 6. The output of –5 dBm is adequate for our present testing; for our future needs we are presently testing a new series of higher output RF power amplifiers to increase the device transmission range.
Sensors
Data Acquisition and Formatting
Spread Spectrum Generator
Transmitter
Sequence Controller
Figure 5. Simplified block diagram of the integrated chip
3.2: Transmitter Output The Wirtx1 chip utilizes a two-bit externally programmable acquisition rate control which allows the data acquisition cycle rate to be altered in order to meet measurement-cycle requirements and to reduce average power dissipation. The measured power for the four switch settings accommodated in the chip is shown in Table 1. The cycle time is from start-oftransmit to start-of-transmit and includes an entire acquisition cycle for each transmit. The particular receiver board we used for this development had problems receiving and decoding the transmitted signal at any transmitter setting other than the fastest so we were unable to run the transmitter at the lower power settings. The die size of the transmitter chip is 3.1 mm x 3.1 mm.
Figure 6. Output of Wirtx1 chip with no modulation
Page 6
Presented at the 1999 Symposium on Advanced Research in VLSI, Atlanta, GA, March 1999
4: "Wireless Nose" System Results The measurement of three cantilever channels was done using the Wirtx1 wireless transmitter. One channel was used as a frame word so that the receiver could more easily synchronize to the incoming data. This left three channels usable for the transmission of cantilever data. The system was configured such that both the wireless and cantilever test boards were powered by 4 AA batteries, thus realizing a complete unattended wireless transmitter. A photograph of the sensor board mounted on the battery pack is presented in Figure 7. The wireless board is mounted on the opposite side of the battery pack. Table 1. Average power and Cycle Time for the four external pin settings BIT SETTINGS (1=high, 0=low) 0-0 0-1 1-0 1-1
CYCLE TIME 8s 1s 0.147 s 0.007 s
AVERAGE POWER 1.1 mW 1.5 mW 4.6 mW 76 mW
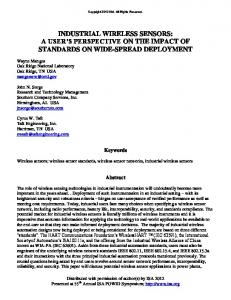
4.1: Sensor Test Results The results from a series of hydrogen tests are shown in Figure 8. Hydrogen flow into and concentration within the test enclosure were regulated using a four-channel MKS Type 247 Mass-Flow Controller System. For this data, cantilevers 2 and 4 were sputter-coated with palladium for 5 minutes and 15 minutes, respectively. It can be seen that the cantilevers that were coated did react to the introduction of hydrogen to the system by an output voltage change, and that there was no response to the hydrogen by the uncoated cantilevers. One can also see the effect of different coating thickness on the cantilever response—as the coating is made thicker, the overall response is greater but the response time is also increased. The figure also illustrates the self-regeneration of the coated cantilevers to near the levels at the beginning of the test. Results from gold-coated cantilevers sensitive to mercury vapor are presented in Figure 9. Concentrations below 100 ppm of hydrogen and 30 ppb of mercury vapor have been successfully measured using this sensor front-end (unpublished results).
5: Future Work We are presently performing measurements of various coating materials on the 1-D array for their sensitivity to alkane thiols and NOx and their relative selectivities. We are also considering fabrication using other MEMS processes. Our plan is to reduce this system in size and power during the next year. We are continuing our development of output amplifiers and further developing techniques for RF-output amplifier power management. We believe these are key elements in the development of practical, low-cost, battery-powered, unattended wireless sensors.
6: Acknowledgements The authors would like to thank Norma Hensley for her assistance in preparing this manuscript. This research sponsored by the U. S. Department of Energy and performed at Oak
Page 7
Presented at the 1999 Symposium on Advanced Research in VLSI, Atlanta, GA, March 1999
Ridge National Laboratory, managed by Lockheed Martin Energy Research, Inc. for the U. S. Department of Energy under Contract No. DE-AC05-96OR22464.
Figure 7. Wireless multi-sensor unit
Figure Figure8.8.Hydrogen Hydrogen test testdata data
Page 8
2.6
80
2.4
70
2.2
60
2
50
#6
1.8 1.6
40 Cantilever #6 (uncoated) Cantilever #7 (10.2nm Au) Mercury Concentration (ppb)
#7
1.4
30 20
1.2
10
1 300
Mercury (ppb)
Cantilever readout voltage (V)
Presented at the 1999 Symposium on Advanced Research in VLSI, Atlanta, GA, March 1999
400
500
600
700
800
0 900
Time (s)
Figure 9. Mercury test data
7: References [1] G. Y. Chen, T. Thundat, E. A. Wachter, and R. J. Warmack, "Adsorption-induced surface stress and its effect on resonance frequency of microcantilevers," Journal of Applied Physics, vol. 77, pp. 3618-3622, 1995. [2] T. Thundat, R. J. Warmack, G. Y. Chen, and D. P. Allison, "Thermal and ambient-induced deflections of scanning force microscope cantilevers," Applied Physics Letters, vol. 64, pp. 2894, 1994. [3] T. Thundat, G. Y. Chen, R. J. Warmack, D. P. Allison, and E. A. Wachter, "Vapor Detection Using Resonating Microcantilevers," Analytical Chemistry, vol. 67, pp. 519-521, 1995. [4] P. I. Oden, P. G. Datskos, T. Thundat, E. A. Wachter, and R. J. Warmack, "Infrared Imaging Using Microcantilevers," Proceedings of the International Mechanical Engineering Congress/Expo, 1996. [5] P. I. Oden, G. Y. Chen, R. A. Steele, R. J. Warmack, and T. Thundat, "Viscous Drag Measurements Utilizing Microfabricated Cantilevers," Applied Physics Letters, vol. 68, pp. 3814-3816, 1996. [6] J. R. Barnes, R. J. Stephenson, C. N. Woodburn, S. J. O’Shea, M. E. Welland, T. Rayment, J. K. Gimzewski, and C. Gerber, "A Femtojoule calorimeter using micromechanical sensors," Review of Scientific Instruments, vol. 65, pp. 3793, 1994. [7] J. R. Barnes, R. J. Stephenson, M. E. Welland, C. Gerber, and J. K. Gimzewski, "Photothermal spectroscopy with femtojoule sensitivity using a micromechanical device," Nature, vol. 372, pp. 79, 1994. [8] R. Berger, C. Gerber, H. P. Lang, and J. K. Gimzewski, "Micromechanics: A Toolbox for Femtoscale Science: Toward a Laboratory on a Tip"," presented at International Conference on Micro- and Nanoengineering "MNE ’96", Glasgow, Scotland, 1996. [9] E. Meyer, J. K. Ginzewski, C. Gerber, and R. R. Schlittler, "Micromechanical calorimeter with picojoule sensitivity," presented at Ultimate Limits of Fabrication and Measurement, 1995. [10] D. Sarid, Scanning Force Microscopy. New York: Oxford University Press, 1991. [11] T. Thundat, P. I. Oden, and R. J. Warmack, "Microcantilever Sensors," Microscale Thermophysical Engineering, vol. 1, pp. 185-199, 1997. [12] P.I. Oden, P.G. Datskos, T. Thundat, R.J. Warmack,"Uncooled Thermal Imaging Using a Piezoresistive Microcantilever"; Applied Physics Letters , 69(21), 3277-3279 (1996) [13] P. I. Oden, P. G. Datskos, T. Thundat, E. A. Wachter, and R. J. Warmack, "Infrared Detection Using Microcantilevers," presented at ASME - Thermal Imaging conference, Atlanta, Georgia, 1996.
Page 9
Presented at the 1999 Symposium on Advanced Research in VLSI, Atlanta, GA, March 1999 [14] E. A. Wachter, T. Thundat, P. G. Datskos, P. I. Oden, S. L. Sharp, and R. J. Warmack, "Remote Infrared Detection Using Microcantilevers," Review of Scientific Instruments, 67(10), 3434-3439 (1996). [15] P. I. Oden, T. Thundat, and R. J. Warmack, "Electrochemical Deposition Induced Stress Measurements on a Microcantilever Investigated with Cyclic Voltammetry," Scanning Microscopy, vol. 10, 1997. [16] C. L. Britton, Jr, R. J. Warmack, S. F. Smith, P. I. Oden, G. M. Brown, W. L. Bryan, L. G. Clonts, M. G. Duncan, M. S. Emery, M. N. Ericson, Z. Hu, R. L. Jones, M. R. Moore, J. A. Moore, J. M. Rochelle, T. D. Threatt, T. Thundat, G. W. Turner, A. L. Wintenberg, “MEMS Sensors and Wireless Telemetry for Distributed Systems”, Proceedings of the SPIE,Vol. 3328, pp. 112-123. [17] P.I. Oden, "Gravimetric Sensing of Metallic Deposits Using an End-Loaded Microfabricated Beam Structure"; Sensors and Actuators B - Chemical (in press 1999).
Page 10