2015 IEEE International Conference on Electrical and Computer Engineering (WIECON-ECE) 19-20 December 2015, BUET, Dhaka, Bangladesh
Tunable-Q Wavelet Transform Based Approach for Recognition of Power Quality Disturbances Karthik Thirumala
M. Siva Prasad
Trapti Jain
Amod C. Umarikar
Dept. of Electrical Engg. IIT Indore Indore, India
[email protected]
Dept. of Electrical Engg. IIT Indore Indore, India
Dept. of Electrical Engg. IIT Indore Indore, India
Dept. of Electrical Engg. IIT Indore Indore, India
Abstract— This paper proposes a new tunable-Q wavelet transform (TQWT) based feature extraction for classification of power quality (PQ) disturbances. The filters are designed to extract the fundamental frequency component from the complete voltage/current signal. This is achieved by tuning the Q-factor (Q) and redundancy (r) of the wavelet by primarily investigating the presence of interharmonics near the fundamental frequency. To test the effectiveness of the proposed scheme, the system is verified with noise-added disturbance signals generated in MATLAB and finally on some practical signals. The proposed methodology is computationally efficient as the traditional PQ analyzers. Keywords—Tunable-Q Wavelet Transform (TQWT), Q-factor (Q), IEEE Std. 1159-1995, Power Quality Disturbances (PQDs).
I. INTRODUCTION Identification of the source and type of power quality (PQ) disturbance [1] is essential before deploying any mitigation measures to improve the PQ. Various signal processing techniques such as fast Fourier transform (FFT), Wavelet transform (WT), S-transform (ST), empirical mode decomposition (EMD) and Kalman Filter [2] - [6] have been employed to extract some unique features representing PQ disturbances. These features are utilized by classifiers based on expert system, fuzzy logic, rule base, artificial neural network (ANN) and support vector machine (SVM) [7] – [11] for detection. The classification accuracy depends on the design of classifier as well as on the features utilized. The FFT suffers from spectral leakage, picket fencing and loss of time related information. The WT based features are strongly influe-nced by noise whereas the accuracy of ST depends on the frequency window width of center frequency. Moreover, the approximation coefficients of the WT belong to a band of frequencies rather than the fundamental frequency component alone. Consequently, the features based on these coefficients do not reflect the PQ disturbances accurately, necessitating exploration of new techniques for feature extraction. Recently, a tunable-Q wavelet transform (TQWT) [12], with the ability to adjust the Q-factor (Q) of the wavelet, has been reported. This flexibility of tuning the Q and r of TQWT for designing the customized filters makes it appropriate for capturing time-localized fundamental amplitude variations. It is easier and better to separate fundamental component from the input signal rather than the complete harmonic
decomposition. The time-varying root mean square (rms) variations of disturbance can also be identified from the fundamental frequency amplitude. Moreover, if the extracted fundamental component is accurate, a simple rule based decision tree classifier with standard features can automatically detect the single PQ disturbances. With this motive, the paper aims to extract the fundamental component from the time varying signal by tuning the Q and r of TQWT and utilize the extracted features to frame a user friendly rule based decision tree for classification of PQ disturbances. In this work, the Q and r are tuned by a primary investigation of the presence of interharmonics near the fundamental frequency. The estimated features include rms of fundamental component (X1rms) [7], Number of zero crossings of the rms variations (NZ) [7], maximum variation of the signal rms (SVmax) [8], mean of high frequency harmonic distortion (HHDm) and standard deviation of fundamental rms (SD). The new feature, HHDm plays a crucial role in recognizing the transients, harmonics and flicker with harmonics. The disturbances investigated are eight single disturbances and a combined disturbance of flicker with harmonics. II. METHODOLOGY The first step is to extract fundamental and harmonic components using TQWT. This is followed by feature extraction and the final step is decision making, during which the extracted features are tested according to the predefined rules to determine the type of the PQ disturbance. A. Tunable-Q Wavelet Transform This section presents a brief review of the TQWT [12] that customizes the filter design by tuning the Q and r. One-level decomposition using TQWT is illustrated in Fig. 1. The TQWT of J levels is implemented by repeatedly performing the filtering of low pass sub band V0(n). For a discrete input signal x(n) of length N, the low pass sub band signal V0(n) and high pass sub band signal V1(n) at the j level will be of length N 0j and N1j , respectively. The low pass scaling parameter V0(n)
y0(n)
H0(k)
LPS N:N0
LPS N0 :N
H1(k)
HPS N:N1
HPS N1 :N
+
x(n)
V1(n)
Fig. 1.
y1(n)
Analysis and synthesis filter banks of TQWT for signal x(n).
y(n)
Fig. 2.
Fig. 3.
Filter design for the noisy voltage sag signal. Fig. 4.
Voltage sag signal and its fundamental from TQWT.
Fig. 5.
Voltage flicker signal and its fundamental from TQWT.
Filter design for the noisy voltage flicker signal.
and high pass scaling parameter are obtained from the given Q and r as follows
2 and 1 Q 1 r
(1)
In summary, the implementation of TQWT can be described as follows: 1) Compute DFT X(k) of the discrete signal x(n). 2) Design low pass filter H 0 (k ) and high pass filter H1 (k ) in frequency domain [12]. 3) Apply low pass and high pass filters and obtain the filtered coefficients as defined U0 (k ) X (k )H0 (k ) and U1(k ) X (k )H1(k )
(2)
4) Perform low pass and high pass scaling [12] on the filtered DFT coefficients to obtain V0(k) and V1(k). 5) Finally compute inverse DFT to obtain the low pass and high pass sub band signals, V0(n) and V1(n). 6) The input signal can be perfectly reconstructed from the sub bands using synthesis filter bank shown in Fig. 1. The performance of the TQWT is fully determined by the input parameters Q, r and the number of levels J. Predefining the Q and r values for TQWT will not fulfill the requirement of perfect extraction of the fundamental component during disturbances. At the same time, tuning them adaptively will make the methodology unsuitable for online detection. Thus, the input signals are categorized into two types, one with the low frequency interharmonics and the other without any interharmonics near 50 Hz. The presence of low frequency interharmonics is primarily investigated by detecting the number of zero crossings (NZ) of the signal rms variation, given in (7). For a windowed signal of 200 ms, NZ ≥ 3 indicates the presence of low frequency interharmonics. If the signal has no interharmonics near 50 Hz, a low pass filter is designed for the fundamental component as shown in Fig. 2 otherwise a new narrow bandpass filter is designed as shown in Fig. 3. This is achieved, by selecting one of the two tuned
set of parameters to design the appropriate filters for extracting the fundamental component with minimal overlapping of other frequency components. 1st set of parameters: Q = 2.3, r = 3.4 and J = 18 2nd set of parameters: Q = 5, r =1.53 and J = 19 The proposed method extracts the fundamental component accurately in presence of all sorts of disturbances. The fundamental component shown in Fig. 4b clearly reflects the occurrence of sag and its intensity. It is evident from Fig. 5b that the amplitude variation due to low frequency interharmonics/ flicker frequencies (of Fig. 5a) is not present in the extracted fundamental component. This makes the proposed method suitable for classification of PQ disturbances by extracting the features described in the next subsection. B. Feature Extraction F1: The RMS value of the nth cycle fundamental component is defined as
X1rms (n)
nS 1 x1 (i)2 S i ( n 1) S 1
(3)
Where n=1,2,.…10 represents the order number of signal cycles and S is the number of samples in one cycle. x1(i) is the sampled fundamental signal obtained using TQWT. X 1rms is the fundamental rms vector having values calculated per cycle, shown as follows:
X 1rms [ X1rms (1),..., X1rms (n),..., X1rms (10)]
(4)
F2: It represents the variation of rms values of the input signal.
SV (n) X rms (n) X rms (n 1)
(5)
Where X rms (n) is the nth cycle rms of the signal. The feature is the maximum variation of signal rms, defined as follows:
F2 SVmax max SV
(6)
Signal
C1
Disturbance
C5, C7, C8, C9
C7, C8, C9
C2, C3, C4, C6, C7, C10
C5
C2
C7 C6
C9
C7 C8
Rule based Decision tree for classification of PQ disturbances.
Fig. 8.
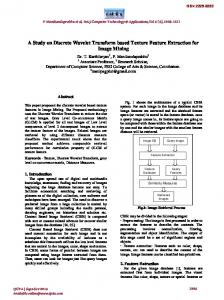
Feature F2 distribution for all classes.
F3: The oscillations of the rms values of the power signal [7] is obtained as
SO = X rms - mean( X rms )
(7)
Then the feature F 3 NZ corresponds to the number of zero crossings of the oscillation vector, SO. F3 ≥ 3 represent the presence of low frequency interharmonics / flicker [8]. F4: This is an important feature that recognizes the transients and harmonics. The high frequency harmonic rms value of nth cycle is obtained as
X Hrms (n)
nS 1 xh (i )2 S i ( n 1) S 1
(8)
Where, xh is the harmonic signal containing all frequency components of 300 Hz and above. The high frequency harmonic distortion per cycle is calculated as follows
HHD(n)
C10
C4
C3
Fig. 6.
Fig. 7.
C6, C10
C2, C3, C4, C7
X Hrms (n) X1rms (n)
(9)
Thus, the mean of these high frequency harmonic distortion values is the fourth feature. F 4 HHDm mean ( HHD)
(10)
Feature F3 distribution for all classes.
F5: The standard deviation of fundamental rms vector, X 1rms as shown below
F 5 SD stnd. devaiation X1rms
(11)
C. Rule based Decision Tree According to the standards [1], [13] and the PQ disturbances definition, the above features are utilized to frame the rule based decision tree shown in Fig. 6. The decision tree has been refined to improve the accuracy for all classes by analyzing enormous data of the PQ disturbances. The classes are labeled as C1-normal, C2-voltage interruption, C3-voltage sag, C4swell, C5-harmonics, C6-flicker, C7-oscillatory transients, C8notch, C9-spike and C10-flicker with harmonics. III. RESULTS AND DISCUSSIONS Accurate recognition of PQ disturbances is dependent on the rules defined with appropriate thresholds. Analysis has been performed on 100 signals of each disturbance class and then tested on 100 other signals and three practical signals. First, the synthetic signals are generated in MATLAB using the mathematical models given in [5]. The signals are generated at sampling rate of 10 kHz and up to 10 cycles having fundamental frequency variation and different noise levels of SNR varying from 25 to 55 dB. The signals are processed by TQWT and the final feature vector is formed by estimating the five features.
TABLE I. Classes C2 C3 C4 C5 C6 C7 C8 C9 C10 Accuracy (%)
Fig. 9.
RECOGNITION ACCURACY OF PQ DISTURBANCES C2 100 2
C3
C4
C5
C6
C7
C8
C9
92 4 3
6 96 5
2 92
92
96
92
C10
98 94
1 100 100
100
98
94
100
100
100 100
Feature F4 distribution for all classes.
Fig. 7 illustrates the spread of feature F2 for all 200 signals of each PQ disturbances. The plot is limited to 0.05 in order to clearly visualize the threshold region that divides the notch, spike and harmonics from the rest. The value for interruption, sag, swell and flicker are higher than the set threshold of 0.025. The transient is the only disturbance whose values are in both the regions as it occurs for very short durations and also depends on the intensity. Fig. 8 indicates the number of zero crossings for all 200 signals of each PQ disturbance. It is clear that flicker and flicker with harmonics are the only disturbances that have zero crossings more than two. Fig. 9 presents the feature F4 for all classes. The threshold of 0.14 separates the harmonics, flicker with harmonics from the rest of the disturbances. The interruption with high noise level (first 50 signals) also has F4>0.14 but the other features F2, F3 and F5 are sufficient in easy recognition of interruption. The ability of the proposed approach is tabulated as shown in Table I. The proposed approach with well-defined rules is able to accurately recognize the occurrence of voltage sag, interruption, harmonics, flicker, notch and flicker with harmonics. However, the misclassification among the classes of similar characteristics is mainly due to high noise content and less impact of disturbance. For example, swell with amplitude of 1.1 pu and of duration less than one cycle are treated as normal signal. Similarly, the sag with depth around 0.9 pu can be taken as interruption and oscillatory transients of very less intensity are considered as either notch or spike signals. The overall average recognition accuracy of the proposed method is found to be 96.8 %, which is satisfactory.
the time-varying input signal by tuning the wavelets. The NZ feature indicates the presence of interharmonics near the fundamental frequency, based on which the filters are designed. The significant PQ disturbances have easily been detected with a simple decision tree classifier as the fundamental information and features utilized are efficient. Finally, testing on large data base of signals covering all extremes and three practical signals shows the validity and applicability of the proposed scheme. REFERENCES [1] [2] [3]
[4]
[5]
[6]
[7]
The average computational burden of the proposed scheme to recognize a PQ disturbance on a 3.1 GHZ Intel core i5 processor is noted to be 17 ms. Hence, the proposed methodology is feasible to implement in hardware for online detection of PQ disturbances, but has a limitation associated with the detection of combined disturbances. The tuning capability of the TQWT can be further improved by considering combined disturbances. However, the development of either novel distinct features or a robust complex classifier may overcome this limitation.
[8]
IV. CONCLUSIONS
[12]
This paper presents a simple and practically suitable recognition approach based on tunable-Q wavelet transform (TQWT). For achieving the accurate classification, the paper focuses on extracting the actual fundamental component from
[9]
[10]
[11]
[13]
IEEE Recommended Practice for Monitoring Electric Power Quality, IEEE Std 1159-1995, 1995. S.A. Deokar, L.M. Waghmare, Integrated DWT–FFT approach for detection and classification of power quality disturbances, Int. Journal of Electrical Power & Energy Systems, vol. 61, pp. 594-605, 2014. Murat Uyar, Selcuk Yildirim, Muhsin Tunay Gencoglu, “An effective wavelet-based feature extraction method for classification of power quality disturbance signals,” Elect. Power Syst. Res., vol. 78, no. 10, pp. 1747-1755, 2008. Guo-Sheng Hu, Feng-Feng Zhu, and Zhen Ren., “Power quality disturbance identification using wavelet packet energy entropy and weighted support vector machines,” Expert Syst. Appl. vol. 35, no.1, pp. 143-149, 2008. Lee, Chun-Yao; Yi-Xing Shen, “Optimal Feature Selection for PowerQuality Disturbances Classification,” IEEE Trans. Power Del., vol.26, no.4, pp.2342-2351, 2011. D. Granados-Lieberman, R.J. Romero-Troncoso, R.A. Osornio-Rios, A. Garcia-Perez and E. Cabal-Yepez, “Techniques and methodologies for power quality analysis and disturbances classification in power systems: a review,” IET Gen., Transm. Distrib., vol. 5, no. 4, pp. 519-529, 2011. Kezunovic, M.; Yuan Liao, “A novel software implementation concept for power quality study,” IEEE Trans. Power Del., vol.17, no.2, pp.544549, 2002. Ming Zhang, Kaicheng Li, Yisheng Hu, “A real-time classification method of power quality disturbances,” Elect. Power Syst. Res., vol.81, no.2, pp.660-666, 2011. B. Biswal, P. K. Dash, B. K. Panigrahi, “Power Quality Disturbance Classification Using Fuzzy C-Means Algorithm and Adaptive Particle Swarm Optimization,” in IEEE Trans. Ind. Electron., vol.56, no.1, pp.212-220, 2009. B. Biswal, M. Biswal, S. Mishra, R. Jalaja, “Automatic Classification of Power Quality Events Using Balanced Neural Tree,” IEEE Trans. Ind. Electron., vol.61, no.1, pp.521-530, 2014. Okan Ozgonenel, Turgay Yalcin, Irfan Guney, Unal Kurt, “A new classification for power quality events in distribution systems,” Elect. Power Syst. Res., vol. 95, 2013. I. W. Selesnick, “Wavelet Transform with Tunable Q-Factor,” IEEE Trans. Sig. Process., vol.59, no.8, pp.3560-3575, 2011. IEC Std. 61000-4-30, Testing and measurement techniques - Power quality measurement methods, 2003.